Research | Open Access | Volume 9 (1): Article 21 | Published: 04 Feb 2026
Views: 721
Menu, Tables and Figures
| Year | Total Births | Stillbirth | Total Stillbirth Rate | Macerated Stillbirth | Macerated Stillbirth Rate | Fresh Stillbirth | Fresh Stillbirth Rate |
|---|---|---|---|---|---|---|---|
| 2014 | 61,349 | 1,102 | 18.0 | 701 | 11.4 | 401 | 6.5 |
| 2015 | 59,644 | 1,060 | 17.8 | 668 | 11.2 | 392 | 6.6 |
| 2016 | 60,995 | 985 | 16.1 | 616 | 10.1 | 369 | 6.0 |
| 2017 | 60,281 | 872 | 14.5 | 554 | 9.2 | 318 | 5.3 |
| 2018 | 63,842 | 898 | 14.1 | 562 | 8.8 | 336 | 5.3 |
| 2019 | 65,283 | 910 | 13.9 | 542 | 8.3 | 368 | 5.6 |
| 2020 | 67,489 | 912 | 13.5 | 543 | 8.0 | 369 | 5.5 |
| 2021 | 71,162 | 970 | 13.6 | 595 | 8.4 | 375 | 5.3 |
| 2022 | 70,608 | 878 | 12.4 | 562 | 8.0 | 316 | 4.5 |
Source: Ghana DHIMS II
Table 1: Stillbirth rate, macerated stillbirth rate, fresh stillbirth rate from 2014 to 2022
| District / Year | 2014 | 2015 | 2016 | 2017 | 2018 | 2019 | 2020 | 2021 | 2022 | ||||||||||||||||||
|---|---|---|---|---|---|---|---|---|---|---|---|---|---|---|---|---|---|---|---|---|---|---|---|---|---|---|---|
| Total Births | Stillbirth | Rate | Total Births | Stillbirth | Rate | Total Births | Stillbirth | Rate | Total Births | Stillbirth | Rate | Total Births | Stillbirth | Rate | Total Births | Stillbirth | Rate | Total Births | Stillbirth | Rate | Total Births | Stillbirth | Rate | Total Births | Stillbirth | Rate | |
| Abuakwa North | 1975 | 24 | 12.2 | 1892 | 38 | 20.1 | 1891 | 38 | 20.1 | 1906 | 34 | 17.8 | 2063 | 42 | 20.4 | 2278 | 41 | 18.0 | 2103 | 30 | 14.3 | 2578 | 50 | 19.4 | 2437 | 24 | 9.8 |
| Abuakwa South | 1642 | 39 | 23.8 | 1441 | 30 | 20.8 | 1524 | 17 | 11.2 | 1451 | 8 | 5.5 | 1399 | 3 | 2.1 | 1380 | 1 | 0.7 | 1630 | 14 | 8.6 | 1737 | 24 | 13.8 | 1697 | 5 | 2.9 |
| Achiase | 523 | 1 | 1.9 | 398 | 0 | 0.0 | 504 | 3 | 6.0 | 496 | 3 | 6.0 | 606 | 0 | 0.0 | 650 | 0 | 0.0 | 678 | 0 | 0.0 | 705 | 0 | 0.0 | 649 | 0 | 0.0 |
| Akuapem North | 2611 | 18 | 6.9 | 2295 | 24 | 10.5 | 1901 | 21 | 11.0 | 1952 | 11 | 5.6 | 2298 | 6 | 2.6 | 2277 | 6 | 2.6 | 2573 | 14 | 5.4 | 2471 | 5 | 2.0 | 2582 | 13 | 5.0 |
| Akuapem South | 381 | 3 | 7.9 | 427 | 2 | 4.7 | 522 | 0 | 0.0 | 547 | 1 | 1.8 | 508 | 2 | 3.9 | 478 | 0 | 0.0 | 478 | 2 | 4.2 | 700 | 2 | 2.9 | 724 | 1 | 1.4 |
| Akyemansa | 1289 | 6 | 4.7 | 1049 | 4 | 3.8 | 1170 | 4 | 3.4 | 1201 | 1 | 0.8 | 1088 | 4 | 3.7 | 987 | 0 | 0.0 | 956 | 3 | 3.1 | 1004 | 0 | 0.0 | 1309 | 2 | 1.5 |
| Asene Manso Akroso | 450 | 4 | 8.9 | 507 | 1 | 2.0 | 636 | 6 | 9.4 | 676 | 6 | 8.9 | 591 | 5 | 8.5 | 614 | 4 | 6.5 | 689 | 7 | 10.2 | 707 | 2 | 2.8 | 774 | 4 | 5.2 |
| Asuogyaman | 2348 | 45 | 19.2 | 2159 | 28 | 13.0 | 2234 | 31 | 13.9 | 1958 | 30 | 15.3 | 1953 | 34 | 17.4 | 2090 | 27 | 12.9 | 1861 | 22 | 11.8 | 1955 | 16 | 8.2 | 1991 | 27 | 13.6 |
| Atiwa East | 1516 | 31 | 20.4 | 1433 | 46 | 32.1 | 1469 | 54 | 36.8 | 1570 | 33 | 21.0 | 1526 | 27 | 17.7 | 1589 | 28 | 17.6 | 1725 | 25 | 14.5 | 1849 | 36 | 19.5 | 2020 | 44 | 21.8 |
| Atiwa West | 715 | 7 | 9.8 | 754 | 8 | 10.6 | 795 | 3 | 3.8 | 742 | 0 | 0.0 | 726 | 1 | 1.4 | 647 | 0 | 0.0 | 800 | 0 | 0.0 | 823 | 2 | 2.4 | 798 | 1 | 1.3 |
| Ayensuano | 997 | 1 | 1.0 | 1034 | 2 | 1.9 | 1039 | 0 | 0.0 | 965 | 0 | 0.0 | 894 | 2 | 2.2 | 984 | 4 | 4.1 | 1138 | 2 | 1.8 | 1384 | 1 | 0.7 | 1268 | 2 | 1.6 |
| Birim Central | 3709 | 128 | 34.5 | 3642 | 115 | 31.6 | 3773 | 110 | 29.2 | 3686 | 106 | 28.8 | 3845 | 75 | 19.5 | 3923 | 75 | 19.1 | 4068 | 72 | 17.7 | 4133 | 67 | 16.2 | 3903 | 62 | 15.9 |
| Birim North | 1408 | 22 | 15.6 | 1534 | 32 | 20.9 | 1574 | 26 | 16.5 | 1584 | 26 | 16.4 | 1691 | 28 | 16.6 | 1902 | 36 | 18.9 | 1973 | 32 | 16.2 | 2197 | 39 | 17.8 | 2103 | 29 | 13.8 |
| Birim South | 473 | 9 | 19.0 | 434 | 6 | 13.8 | 423 | 1 | 2.4 | 505 | 4 | 7.9 | 500 | 1 | 2.0 | 426 | 2 | 4.7 | 358 | 5 | 14.0 | 388 | 0 | 0.0 | 428 | 3 | 7.0 |
| Dekyembour | 3129 | 89 | 28.4 | 2696 | 66 | 24.5 | 2702 | 55 | 20.4 | 2601 | 60 | 23.1 | 2769 | 69 | 24.9 | 2861 | 76 | 26.6 | 2906 | 77 | 26.5 | 2802 | 46 | 16.4 | 2808 | 44 | 15.7 |
| Fante Akwa North | 1110 | 31 | 27.9 | 1119 | 27 | 24.1 | 1086 | 29 | 26.7 | 1182 | 14 | 11.8 | 1311 | 25 | 19.1 | 1128 | 24 | 21.3 | 1185 | 23 | 19.4 | 1217 | 18 | 14.8 | 1186 | 20 | 16.9 |
| Fante Akwa South | 468 | — | 0.0 | 434 | 2 | 4.6 | 456 | 2 | 4.4 | 511 | 3 | 5.9 | 543 | 0 | 0.0 | 435 | 1 | 2.3 | 431 | 1 | 2.3 | 445 | 0 | 0.0 | 533 | 0 | 0.0 |
| Kwaebibrim | 2045 | 20 | 9.8 | 2030 | 28 | 13.8 | 2001 | 10 | 5.0 | 1841 | 16 | 8.7 | 2048 | 13 | 6.3 | 2048 | 16 | 7.8 | 2133 | 18 | 8.4 | 2223 | 11 | 4.9 | 2224 | 16 | 7.2 |
| Kwahu Afram Plain North | 1120 | 35 | 31.3 | 1098 | 26 | 23.7 | 1086 | 21 | 19.3 | 1378 | 28 | 20.3 | 1479 | 20 | 13.5 | 1384 | 33 | 23.8 | 1525 | 37 | 24.3 | 1540 | 33 | 21.4 | 1503 | 35 | 23.3 |
| Kwahu Afram Plain South | 898 | 12 | 13.4 | 856 | 6 | 7.0 | 723 | 4 | 5.5 | 777 | 11 | 14.2 | 920 | 6 | 6.5 | 1027 | 3 | 2.9 | 1076 | 4 | 3.7 | 1083 | 8 | 7.4 | 1047 | 13 | 12.4 |
| Kwahu East | 1288 | 4 | 3.1 | 1198 | 10 | 8.3 | 1256 | 2 | 1.6 | 1260 | 2 | 1.6 | 1183 | 4 | 3.4 | 1253 | 3 | 2.4 | 1412 | 0 | 0.0 | 1396 | 1 | 0.7 | 1352 | 1 | 0.7 |
| Kwahu South | 2968 | 41 | 13.8 | 2748 | 73 | 26.6 | 2635 | 47 | 17.8 | 2720 | 49 | 18.0 | 2789 | 53 | 19.0 | 2790 | 47 | 16.8 | 2944 | 49 | 16.6 | 3000 | 64 | 21.3 | 2799 | 43 | 15.4 |
| Kwahu West | 3860 | 100 | 25.9 | 3808 | 96 | 25.2 | 4010 | 86 | 21.4 | 3776 | 60 | 15.9 | 3961 | 65 | 16.4 | 3962 | 67 | 16.9 | 4041 | 64 | 15.8 | 4052 | 81 | 20.0 | 4342 | 65 | 15.0 |
| Lower Manya Krobo | 3562 | 71 | 19.9 | 3297 | 42 | 12.7 | 3139 | 46 | 14.7 | 3247 | 22 | 6.8 | 3391 | 21 | 6.2 | 3438 | 33 | 9.6 | 3644 | 34 | 9.3 | 4193 | 39 | 9.3 | 3716 | 23 | 6.2 |
| New Juaben North | 263 | 1 | 3.8 | 343 | 0 | 0.0 | 427 | 3 | 7.0 | 531 | 5 | 9.4 | 576 | 6 | 10.4 | 665 | 10 | 15.0 | 800 | 9 | 11.3 | 923 | 12 | 13.0 | 888 | 13 | 14.6 |
| New Juaben South | 6294 | 212 | 33.7 | 6260 | 166 | 26.5 | 6324 | 195 | 30.8 | 5950 | 165 | 27.7 | 6386 | 198 | 31.0 | 6472 | 184 | 28.4 | 6582 | 163 | 24.8 | 6556 | 203 | 31.0 | 6596 | 191 | 29.0 |
| Nsawam- Adoagyiri | 6026 | 75 | 12.4 | 6438 | 77 | 12.0 | 7238 | 67 | 9.3 | 7206 | 92 | 12.8 | 8015 | 86 | 10.7 | 8142 | 109 | 13.4 | 8069 | 120 | 14.9 | 8427 | 119 | 14.1 | 7825 | 101 | 12.9 |
| Okere | 477 | 1 | 2.1 | 536 | 1 | 1.9 | 543 | 0 | 0.0 | 454 | 0 | 0.0 | 611 | 1 | 1.6 | 566 | 0 | 0.0 | 605 | 0 | 0.0 | 660 | 3 | 4.5 | 653 | 0 | 0.0 |
| Suhum | 2648 | 37 | 14.0 | 2511 | 26 | 10.4 | 2439 | 20 | 8.2 | 2360 | 26 | 11.0 | 2375 | 28 | 11.8 | 2553 | 38 | 14.9 | 2929 | 39 | 13.3 | 3072 | 38 | 12.4 | 3326 | 38 | 11.4 |
| Upper Manya Krobo | 1076 | 18 | 16.7 | 1189 | 21 | 17.7 | 1107 | 32 | 28.9 | 1095 | 25 | 22.8 | 1272 | 22 | 17.3 | 1323 | 121 | 91.5 | 1226 | 15 | 12.2 | 1320 | 13 | 9.8 | 1307 | 22 | 16.8 |
| Upper West Akim | 826 | 2 | 2.4 | 787 | 1 | 1.3 | 832 | 3 | 3.6 | 872 | 2 | 2.3 | 1062 | 3 | 2.8 | 1349 | 4 | 3.0 | 1149 | 0 | 0.0 | 1387 | 0 | 0.0 | 1342 | 7 | 5.2 |
| West Akim | 2417 | 44 | 18.2 | 2290 | 53 | 23.1 | 2296 | 48 | 20.9 | 2201 | 26 | 11.8 | 2215 | 40 | 18.1 | 2190 | 22 | 10.0 | 2359 | 29 | 12.3 | 2613 | 35 | 13.4 | 2751 | 28 | 10.2 |
| Yilo Krobo | 880 | 1 | 1.1 | 1007 | 3 | 3.0 | 1234 | 1 | 0.8 | 1080 | 3 | 2.8 | 1248 | 2 | 1.6 | 1463 | 4 | 2.7 | 1403 | 2 | 1.4 | 1622 | 2 | 1.2 | 1733 | 3 | 1.7 |
Source: Ghana DHIMS II
Table 2: Stillbirth Rates for districts in the Eastern Region from 2014 to 2022
| District | Total Births | Macerated Stillbirth | Macerated Stillbirth Rate | Fresh Stillbirth | Fresh Stillbirth Rate |
|---|---|---|---|---|---|
| Abuakwa North | 2437 | 16 | 6.6 | 8 | 3.3 |
| Abuakwa South | 1697 | 0 | 0.0 | 5 | 2.9 |
| Achiase | 649 | 0 | 0.0 | 0 | 0.0 |
| Akuapem North | 2582 | 10 | 3.9 | 3 | 1.2 |
| Akuapem South | 724 | 0 | 0.0 | 1 | 1.4 |
| Akyemansa | 1309 | 0 | 0.0 | 2 | 1.5 |
| Asene Manso Akroso | 774 | 2 | 2.6 | 2 | 2.6 |
| Asuogyaman | 1991 | 18 | 9.0 | 9 | 4.5 |
| Atiwa East | 2020 | 33 | 16.3 | 9 | 4.5 |
| Atiwa West | 798 | 0 | 0.0 | 1 | 1.3 |
| Ayensuano | 1268 | 1 | 0.8 | 1 | 0.8 |
| Birim Central | 3903 | 43 | 11.0 | 19 | 4.9 |
| Birim North | 2103 | 11 | 5.2 | 18 | 8.6 |
| Birim South | 428 | 1 | 2.3 | 2 | 4.7 |
| Dekyembour | 2808 | 23 | 8.2 | 21 | 7.5 |
| Fante Akwa North | 1186 | 14 | 11.8 | 6 | 5.1 |
| Fante Akwa South | 533 | 0 | 0.0 | 0 | 0.0 |
| Kwaebibrim | 2224 | 10 | 4.5 | 6 | 2.7 |
| Kwahu Afram Plain North | 1503 | 24 | 16.0 | 11 | 7.3 |
| Kwahu Afram Plain South | 1047 | 6 | 5.7 | 7 | 6.7 |
| Kwahu East | 1352 | 0 | 0.0 | 1 | 0.7 |
| Kwahu South | 2799 | 36 | 12.9 | 7 | 2.5 |
| Kwahu West | 4342 | 46 | 10.6 | 19 | 4.4 |
| Lower Manya Krobo | 3716 | 16 | 4.3 | 7 | 1.9 |
| New Juaben North | 888 | 10 | 11.3 | 3 | 3.4 |
| New Juaben South | 6596 | 122 | 18.5 | 69 | 10.5 |
| Nsawam- Adoagyiri | 7825 | 61 | 7.8 | 40 | 5.1 |
| Okere | 653 | 0 | 0.0 | 0 | 0.0 |
| Suhum | 3326 | 25 | 7.5 | 13 | 3.9 |
| Upper Manya Krobo | 1307 | 11 | 8.4 | 11 | 8.4 |
| Upper West Akim | 1342 | 7 | 5.2 | 0 | 0.0 |
| West Akim | 2751 | 13 | 4.7 | 15 | 5.5 |
| Yilo Krobo | 1733 | 2 | 1.2 | 1 | 0.6 |
Source: Ghana DHIMS II
Table 3: Macerated and Fresh Stillbirth rate for districts in the Eastern Region in 2022


Francis Asare Yeboah1, Winfred Ofosu1, John Ekow Otoo1, Simon Adu-Poku2, Delia Akosua Bandoh3,&, Samuel Asare1, Esther Berchie Osei1, Michael Obodai Topson1, James Forson4 , Ernest Kenu3
1Regional Health Directorate, Ghana Health Services, Eastern Region, Koforidua, Ghana, 2District Health Directorate, Ghana Health Services, Eastern Region, Okere District, Ghana, 3Ghana Field Epidemiology and Laboratory Training Programme (GFELTP), Ghana, 4Regional Health Directorate, Ghana Health Services, North East Region, Gambaga, Ghana
&Corresponding author: Delia Akosua Bandoh, Ghana Field Epidemiology and Laboratory Training Programme (GFELTP), Ghana Email: dbandoh@afenet.net
Received: 22 Mar 2025, Accepted: 30 Jan 2026, Published: 04 Feb 2026
Domain: Maternal and Child Health
Keywords: Stillbirth, Macerated Stillbirth, Fresh Stillbirth, Stillbirth rate, Total birth, Trend, Distribution, Eastern Region
©Francis Asare Yeboah et al. Journal of Interventional Epidemiology and Public Health (ISSN: 2664-2824). This is an Open Access article distributed under the terms of the Creative Commons Attribution International 4.0 License (https://creativecommons.org/licenses/by/4.0/), which permits unrestricted use, distribution, and reproduction in any medium, provided the original work is properly cited.
Cite this article: Francis Asare Yeboah et al. The trend and distribution of stillbirth in the Eastern Region of Ghana. Journal of Interventional Epidemiology and Public Health. 2026; 9(1):21. https://doi.org/10.37432/jieph-d-25-00080
Introduction: The trend of stillbirth in Ghana is on a slow decline from 22.5/1,000 total births in 2018 to 21.4/1,000 total births in 2021, and has not met its target. After many interventions implemented in the Eastern Region to reduce stillbirth, little is known about the trend of stillbirth rates in the region. This study determined the trend and distribution of stillbirths in the Eastern Region.
Methods: We employed a secondary data analysis on stillbirth in the Eastern Region, 2014-2022. The data source was from the District Health Information Management System. We calculated the stillbirth rate per 1,000 deliveries at the district and regional level. The stillbirth rates were presented as a trend line graph. We tested for the consistency of the trend using the Mann-Kendall trend analysis test on STATA 13.1. We used QGIS software version 3.30 to draw choropleth maps to depict the distribution of the stillbirth rate in the region.
Results: Over the nine-year period from 2014 to 2022, a total of 8,587 stillbirths were recorded out of 580, 653 total births. The highest number of stillbirths was reported in 2014, with 1,102 stillbirths, out of which macerated stillbirths accounted for 701 and a stillbirth rate of 18.0 per 1,000 total births. Across all years, macerated stillbirths outnumbered fresh stillbirths. Stillbirth rate declined from 18.0 per 1,000 total births in 2014 to 12.4 per 1,000 total births in 2022. Mann-Kendall trend analysis showed a significant decline in the total stillbirth trend over time (p <0.05). Over the nine-year period, districts with a high incidence of stillbirth (19.9-34.5/1,000 total births) were Kwahu Afram Plains North, Kwahu West, New Juaben South and Denkyembour.
Conclusion: The stillbirth rate is on a decline, and there are specific districts which have a high incidence of stillbirth. We recommend that interventions for stillbirths should be strengthened to meet the SDG target of 12/1,000 total births by 2030.
Stillbirths are a major problem in many countries that have generally received little attention [1]. According to the World Health Organization (WHO), stillbirth occurs when a baby is born after 28 weeks of pregnancy and exhibits no signs of life [2]. Approximately one in every 160 to 200 deliveries in the United States of America result in stillbirth, a common pregnancy complication despite advancements in obstetric care [3] and of the estimated 2.6 million stillbirths that occur globally each year, 98% are believed to occur in low and middle income nations, with South Asia and Sub-Saharan Africa accounting for 78% of these cases [1,4,5].
At the 67th World Health Assembly, the WHO created the Every Newborn Child Action Plan (ENAP) campaign to promote the Global Strategy for Women’s and Children’s Health in 2014, which redoubled efforts to lower stillbirths globally by highlighting access to high-quality maternal services as a key component of reaching national objectives [6,7]. By 2030, the WHO’s Every Newborn Child Action Plan: An action plan to end preventable deaths campaign seeks to lower the global stillbirth rate to no more than 12 per 1,000 total births [8]. Although stillbirth rates are declining internationally, they have not yet attained their goal. Between 2010 and 2016, the global rate decreased by 3.0% yearly, from 31.7 per 1,000 total births to 26.4 per 1,000 total births [4]. Between 2018 and 2021, Africa’s stillbirth rate gradually decreased from 21.41 per 1,000 total births to 20.65 per 1,000 total births[9]. In 2019, the stillbirth rate per 1,000 total births differed significantly by region, ranging from 2.9 (2.7–3.0) in Western Europe to 22.8 per 1,000 total births in West and Central Africa. The second and third greatest stillbirth rates were seen in South Asia, East and South Africa, and West and Central Africa, respectively [10]. In the Sub-Saharan African region, the prevalence of stillbirths rose from 0.77 million in 2000 to 0.82 million in 2019, accounting for 27% of all stillbirths globally [6,11].
In Ghana, stillbirths accounted for 1.7% of the 650,000 births recorded annually in public health facilities, with 40% occurring during labour [12]. Ghana’s stillbirth rate per 1,000 total births was 22.5 in 2018, 22.17 in 2019, 21.75 in 2020, and 21.4 in 2021. But even if it has improved from previous years, it is still high in comparison to the regional average for Sub-Saharan Africa [6,9]. In September 2013, PATH and Kybele Inc., two non-governmental organizations, worked with the Ghana Health Service (GHS) and received funding from the Children’s Investment Fund Foundation to undertake a five-year Making Every Baby Count Initiative (MEBCI). Enhancing national leadership in newborn health and building regional and district-level newborn care capability were the main goals of the effort in four areas, including the Eastern Region. [13]. With many other interventions implemented in the Eastern Region and after the development of ENAP by the WHO in 2014 to reduce stillbirth and improve newborn care, little is known about the trend of stillbirth rates in the region. The study determined the trend and distribution of stillbirth in the Eastern Region, 2014 to 2022 to inform planning for safe pregnancies and births in the region.
Study design and area
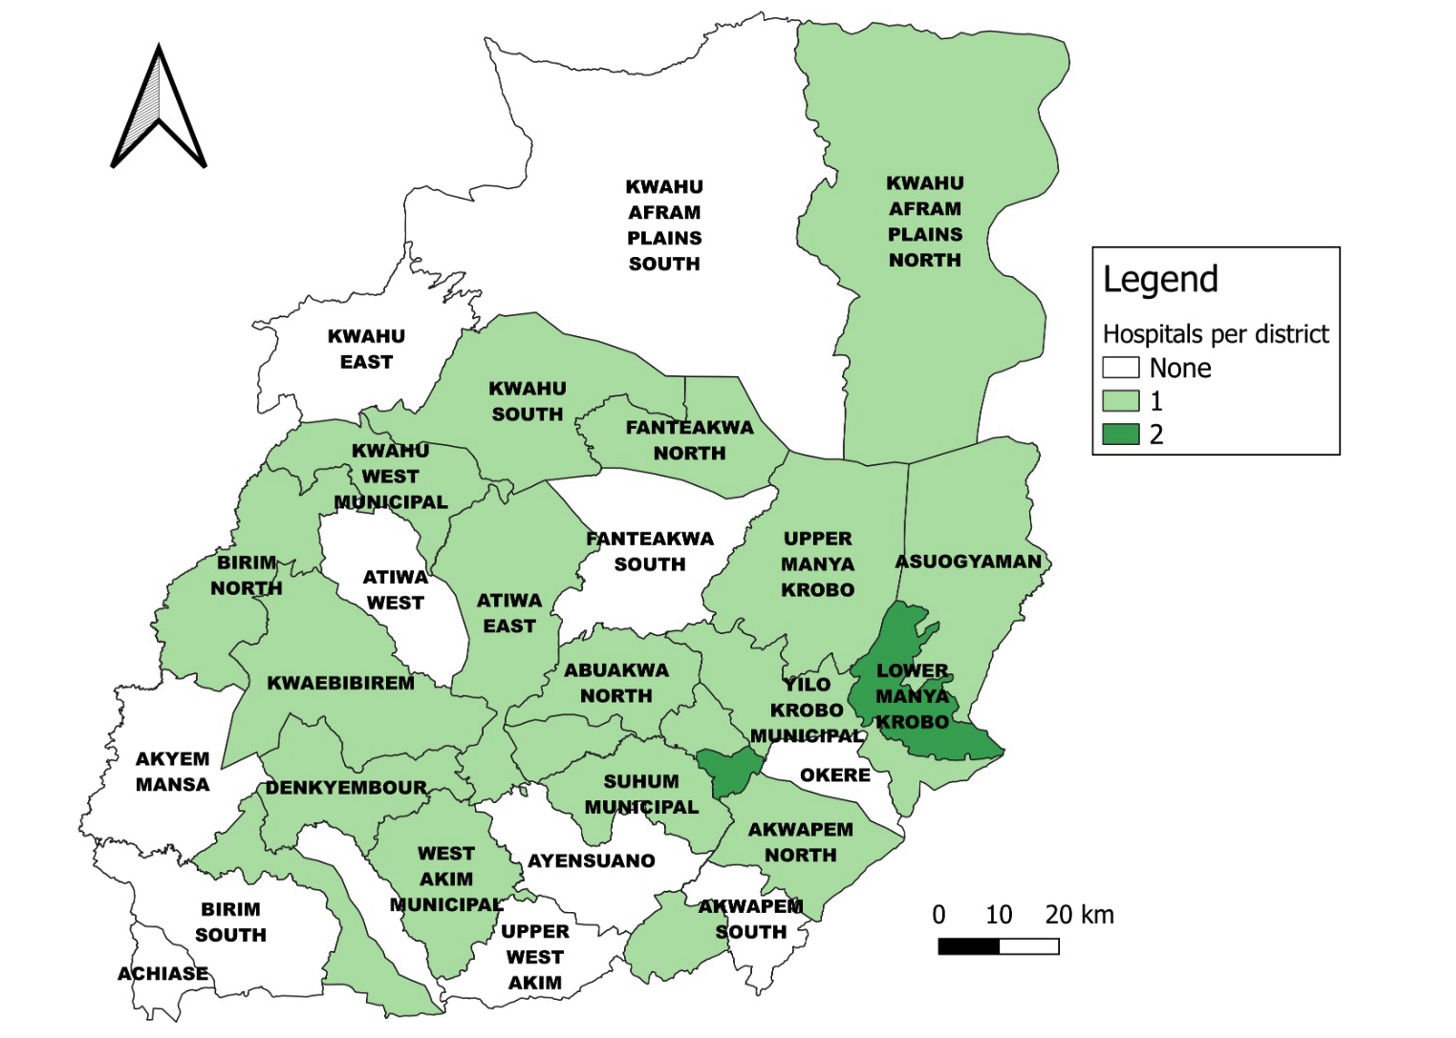
This study was a secondary data analysis conducted in the Eastern Region of Ghana. The study used stillbirth data over a nine-year period from January 1 2014, to December 31 2022. The Eastern Region is one of the administrative regions in Ghana. The regional capital is Koforidua, which is in the New Juaben South Municipality. The region shares boundaries with six other regions, which are Bono East, Ashanti, Central, Greater Accra, Volta, and Oti Region. The region consists of 33 districts and municipalities. The region has a projected population of 3,049,821 in 2020 and is the third highest in Ghana, of which 51% of the population are females, among whom 731,957 are of the fertility age.
The region has a total of 1,226 health facilities comprising 903 CHPS facilities, 97 clinics, 29 maternity homes, 148 health centres, 5 polyclinics, 18 district hospitals, 25 other general hospitals and a regional hospital. Among these facility types, only 26.9% of CHPS and 20.6% of clinics offered delivery services, 48.3 % of maternity homes conducted deliveries, indicating limited delivery services. Delivery services were most widely available at higher–level primary care facilities, with 89.9% of health centres offering delivery services. Among secondary-level facilities, 83.3% of polyclinics provided delivery services, and 100% of the hospitals conducted delivery services [14]. All these facilities are reported on the DHIMS II platform. The region has 158 medical officers, 19 obstetricians and 1,811 midwives. Below is the map of the Eastern Region (Figure 1):
Data source
The study utilised secondary data from the District Health Information Management System (DHIMS II). The DHIMS II is a nationwide integrated electronic database accessible over the internet that compiles data from health facilities [15]. Stillbirths and the number of deliveries are manually recorded in facility registers at all healthcare facilities and are subsequently summarised monthly onto the Monthly Midwives’ Return Form A in the DHIMS2 database at the district or sub-district level
Data extraction
Data were abstracted from the DHIMS2. The data were abstracted over a nine-year span from 2014 to 2022. The data were abstracted using DHIMS2 pivot tables and exported into Microsoft Excel 365. Data abstracted included fresh stillbirths, macerated stillbirths, total births and reporting rate of stillbirth at the regional and district level from 2014 to 2022. There was availability of data for all years from 2014 to 2022, indicating a high level of completeness, although there were variations in the reporting rate across the districts. The data captured facility-based births and stillbirths at both public and private health facilities. Therefore, stillbirths occurring outside health facilities, such as home births or unreported community events, were not captured.
Data analysis
Data cleaning was done using Microsoft Excel 365. After the data were cleaned, they were imported into STATA version 13.1 (StataCorp. 2013. Stata Statistical Software: Release 13. College Station, TX: StataCorp LP) for statistical analysis and Quantum Geographic Information System software version (QGIS) version 3.30 for spatial analysis.
We determined the total stillbirths by adding the fresh and macerated stillbirths. Proportions were calculated from absolute counts of the data abstracted. We calculated the fresh stillbirth rate, macerated stillbirth rate and total stillbirth rate by dividing the fresh stillbirth, macerated stillbirth and total stillbirth by total births, multiplied by 1,000 from 2014 and 2022, respectively. According to the WHO, stillbirth rate is defined as the number of babies born with no signs of life at 28 weeks or more of gestation, per 1,000 total births. The stillbirth rate is calculated as:
$$
\text{Stillbirth Rate} = \frac{\text{Stillbirth}}{\text{Total births}} \times 1{,}000
$$
[9]. Data on the reporting rate of stillbirth were abstracted to determine data completeness from 2014 to 2022. The annual total stillbirth rates, fresh stillbirth rates, macerated stillbirth rates and reporting rates were presented as line graph to determine the trend from 2014 to 2022.
Mann-Kendall trend analysis test was done to determine if there were statistically significant trends existing in the total stillbirth rate over time using STATA version 13.1 (StataCorp. 2013. Stata Statistical Software: Release 13. College Station, TX: StataCorp LP). Under the null hypothesis, it was assumed that there was no trend in the total stillbirth rate over time, whereas the alternative hypothesis was that there was an increasing or decreasing trend in the total stillbirth rate over time. We assumed a p-value (p <0.05) to be statistically significant.
Quantum Geographic Information System software version (QGIS) version 3.30 was used to draw choropleth maps depicting the distribution of the stillbirth rate among the districts in the region between 2014 and 2022. Data on fresh and macerated stillbirth rates among districts were also imported into QGIS version 3.30 from Microsoft Excel 365 to draw choropleth maps to depict the distribution of the fresh and macerated stillbirth rates among the districts in the region for the year 2022.
Ethical consideration
Permission for this study was approved by the management of the Eastern Regional Health Directorate. The aggregate data abstracted did not have any personal identifiers. Secondary data abstracted were kept in a folder with a protected password on a computer and shared with only the investigation team.
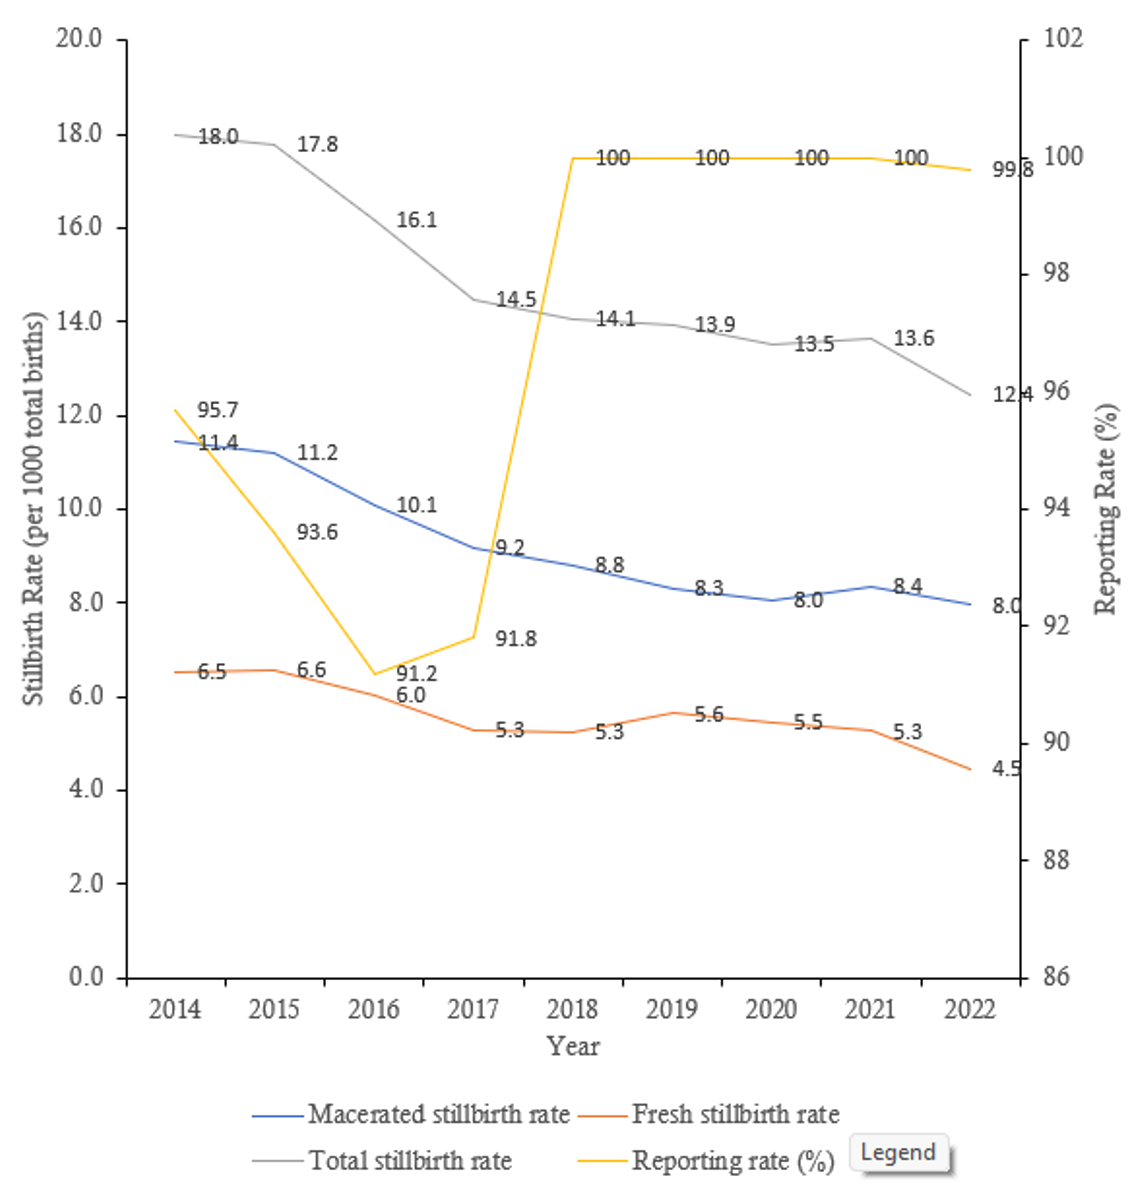
The regional stillbirth trend
There is a decline in the total stillbirth rate from 18.0 per 1,000 total births in 2014 to 12.4 per 1,000 total births in 2022. The highest total stillbirth rate was recorded in 2014, while the lowest was recorded in 2022. The average decline in the annual total stillbirth rate was 4.1%. The macerated stillbirth was more than the fresh stillbirth over the nine-year period (Figure 2). From 2018 to 2021, the reporting rate maintained a constant of 100% but for the other years, it was lower than 100%. Between 2014 and 2022, a total of 8,578 stillbirths were recorded (Table 1). The annual number of stillbirths declined over the study period, decreasing from 1,102 in 2014 to 878 in 2022 despite an overall increase in total births. Across all years, macerated stillbirths were consistently more common than fresh stillbirths. The highest number of both macerated (701 cases) and fresh stillbirths (401 cases) was observed in 2014, whereas the lowest number of fresh stillbirths occurred in 2022 (316 cases). Overall, the findings indicate a progressive reduction in total stillbirths over time, with macerated stillbirths constituting the larger proportion of stillbirths in every year of the study period (Table 2).
Kendall’s tau-a and Kendall’s tau-b were both -0.9444 which depicts a decreasing trend. The Kendall’s score was -34 with a standard error of 9.592. The p-value, adjusted with continuity correction, was 0.0006, which indicates that the trend was statistically significant (p < 0.05).
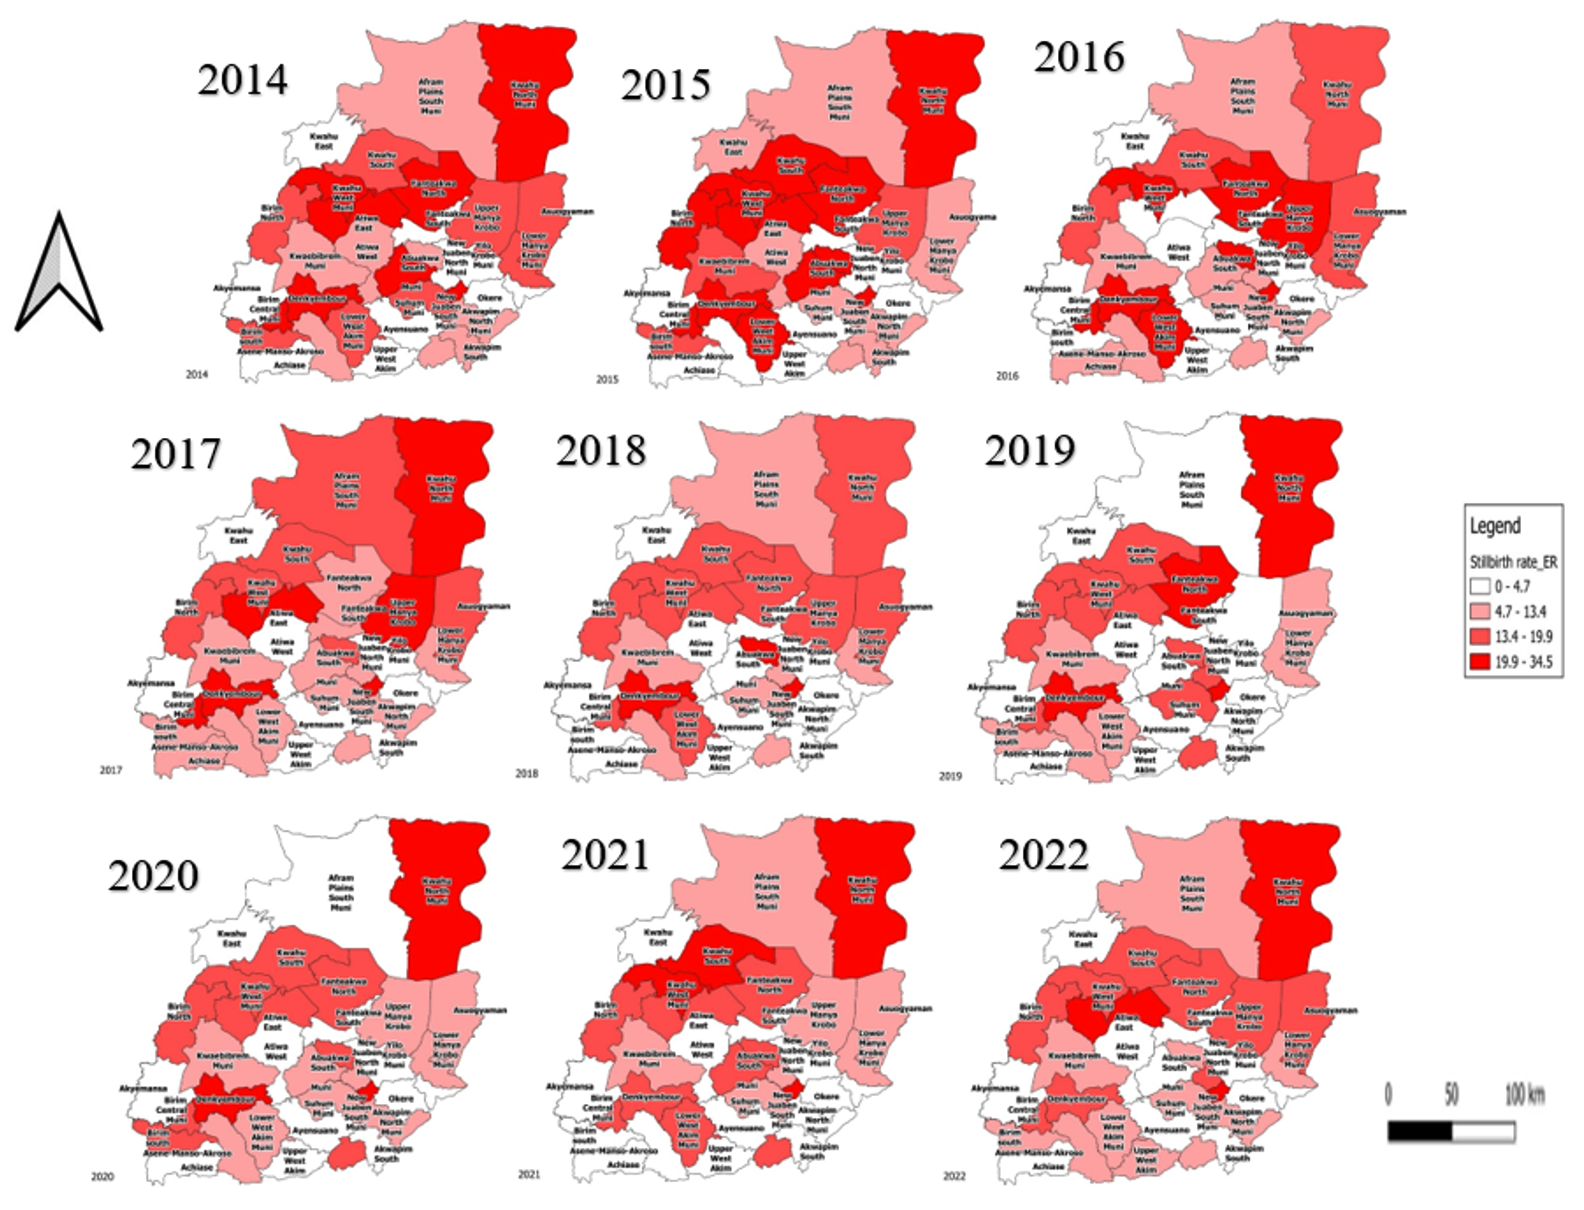
Geo-spatial distribution of stillbirth in the Eastern Region
There is a high incidence of stillbirth from 2014 to 2016 among districts in the Eastern Region. About 8-14 districts recorded a stillbirth rate of a range of 19.9 to 34.5 per 1,000 total births from 2014 to 2016. Apart from 7 districts that recorded a stillbirth rate of 19.9 to 34.5 per 1,000 total births in 2017, 4 or fewer districts recorded a stillbirth rate range of 19.9 to 34.5 per 1000 total births from 2018 to 2022. Districts that had a persistent stillbirth rate of range 19.9 to 34.5 per 1,000 total births from 2014 to 2022 are the Kwahu Afram Plains North district, Kwahu West District, New Juaben South Municipal and Denkyembour district. Districts that had a persistent stillbirth rate of range 0.0 to 4.7 per 1,000 total births from 2014 to 2022 are Akyemansa, Ayensuano, Okere and Yilo Krobo (Figure 3) (Table 2).
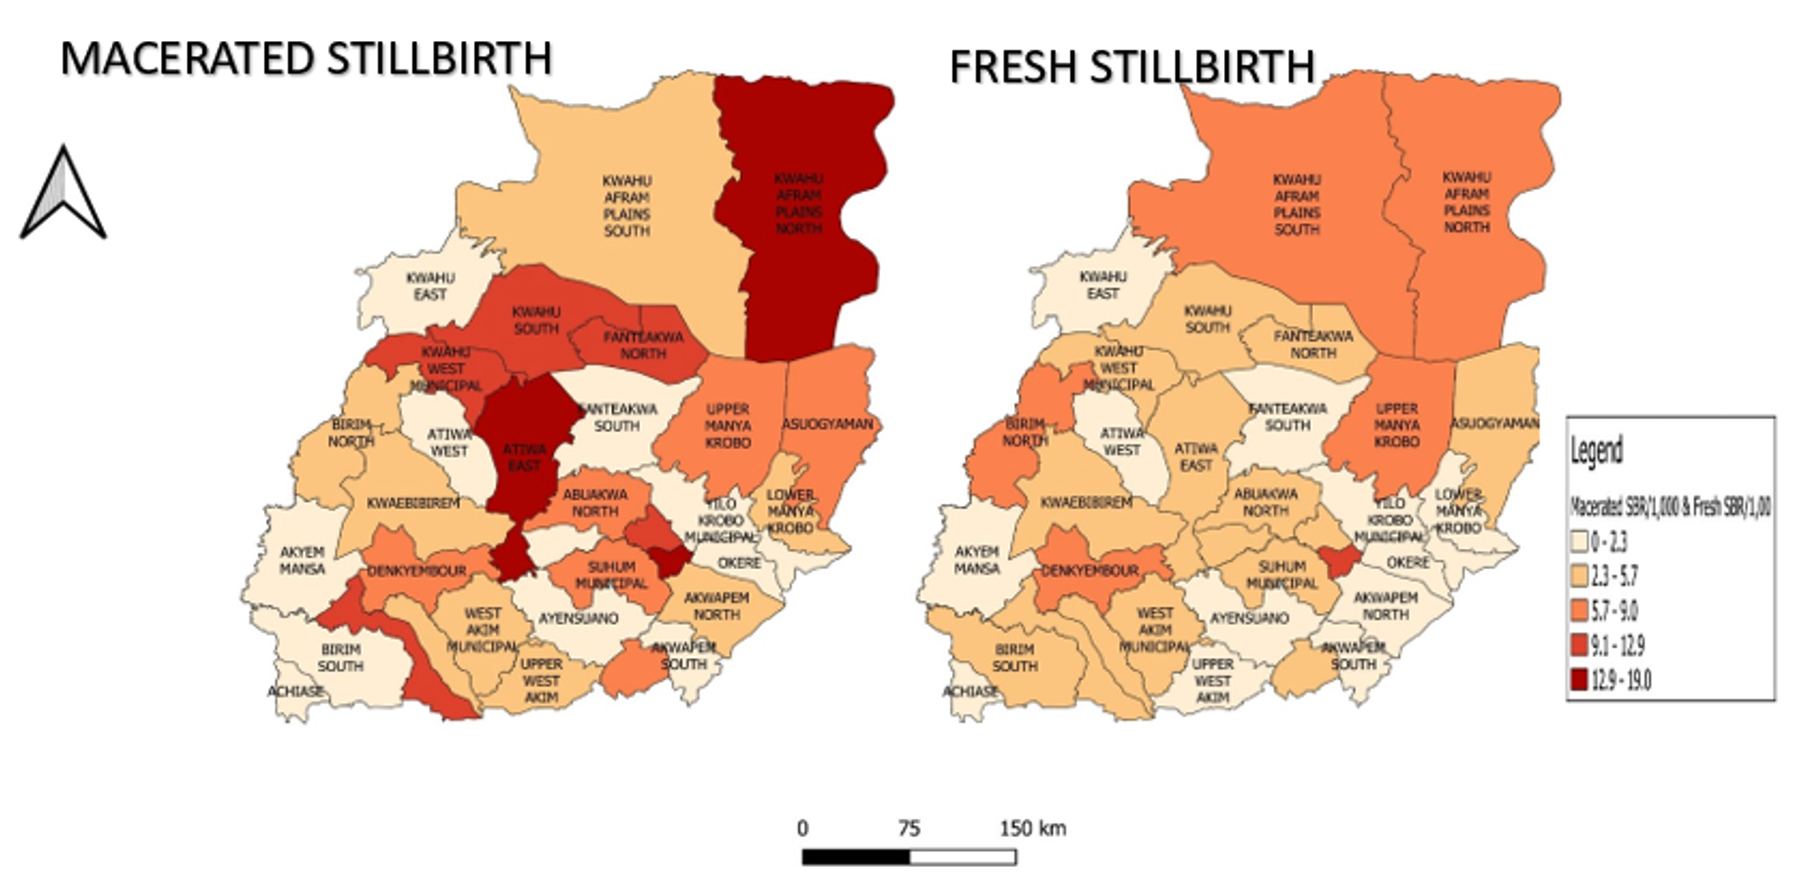
Geo-spatial distribution of fresh and macerated stillbirth in the Eastern Region
Atiwa East, Kwahu Afram Plains North District and New Juaben South Municipal had a macerated stillbirth rate of 12.9 to 19.0 per 1,000 total births in 2022. New Juaben South Municipal had a fresh stillbirth rate of 10.5 per 1,000 total births (Figure 4) (Table 3).
Stillbirth is one of the worst outcomes pregnant women and their families can experience [16]. The stillbirth rate is declining globally, but has not reached its target yet [4]. In the Eastern Region, there was a decline of stillbirth rate from 2014 to 2022, even though it is slow. The slow progress in preventing stillbirths emphasises the inadequate effort and investments by governments in terminating preventable stillbirths [17,18]. The highest stillbirth rate recorded was in 2014, with the lowest in 2022. This decline of stillbirth rate over the past years could be due to general improvements in the health care delivery over the past years. An increase in human resources and infrastructure, such as health facilities and midwives, could account for the decline in the stillbirth rate over the period. Improvements in Community Health Planning Services (CHPS) have increased access to the health facilities at the community level, especially in hard-to-reach communities. This has helped midwives and Community Health Nurses (CHNs) detect emergency cases in communities and refer them to higher facilities early to prevent mortalities.
One of the key actions proposed to improve quality maternal care during the ENAP in 2014 was that every country was to ensure that all facilities have adequate staff with multidisciplinary teams and have basic ideal infrastructure to prevent maternal and newborn deaths and stillbirth [8]. It was also suggested in the Every Newborn Action Plan (ENAP) that, where access to health services is inequitable or limited, governments should consider empowering community health workers as a key resource for improving maternal and newborn care, especially in hard-to-reach communities [8]. Another contributing factor to the decline in stillbirths could also be attributed to higher maternal education and media exposure [19]. However, the slow pace of the decline in stillbirth could be attributed to factors such as low attention to stillbirth-related issues in the region and late arrival of pregnant mothers who need emergency care. This is similar to a study done in Ghana, where factors contributing to stillbirths were attributed to poor monitoring, delayed arrival, inadequate attention to stillbirth matters, and intake of local herbs [6].
The rate of macerated stillbirth is more than that of fresh stillbirth. This current result differs from other studies that found that more than half of the stillbirths were fresh stillbirths [20,21] but is similar to a study in South Africa that found that several of the stillbirths were macerated[22]. Atiwa East, Kwahu Afram Plains North District and New Juaben South Municipal have very high rates of macerated stillbirths, which could be due to poor ANC attendance by pregnant women. A study found that mothers who did not receive antenatal care had a higher likelihood of macerated stillbirths. Antenatal care is essential for women and maternal health services [23]. Poor quality ANC is more likely to overlook medical/obstetric problems and other risk factors connected with stillbirth, leading to stillbirth [24]. Antenatal services at the community level have a positive impact on reducing macerated stillbirths [25]. Most of these stillbirth cases could be coming from neighbouring districts that do not have hospitals, but the pregnant women from the neighbouring districts accessed health care service at the Atiwa East, Kwahu Afram Plains North District and New Juaben South Municipal districts, which have hospitals. Moreover, New Juaben South Municipal is recording a high incidence of fresh stillbirth, which could be due to a gap during labour. Macerated stillbirths are mostly linked to problems before birth throughout the antenatal period, whereas fresh stillbirths are linked to gaps in treatment during labour and upon delivery [26].
The reporting rate target for stillbirth in the region is 100%. However, from 2014 to 2017 and 2022, the target for reporting rate on stillbirth was not achieved. This may affect the actual representation of the burden of stillbirth in the region, hence underestimating the stillbirth figures in these years, respectively. This is similar to a study conducted in Uganda, where the rates of reporting on stillbirths were also lower than their national target (80%) for each of the years and affected the representation of the genuine burden of stillbirths. The low reporting rate confirms an under-estimate of the stillbirths in Uganda [26].
The Mann-Kendall trend analysis showed a statistically significant downward trend of stillbirth rate over time. This implies that there are many interventions on maternal and newborn health services in the region and more philanthropic exercises such as health screening and health education in communities, influencing the decline of the stillbirth rate yearly. Intrapartum management strategies which include a four-hourly review of all cases in labour by obstetrician-led teams of doctors, strict labour monitoring with partographs, cardiotocograph monitoring of high-risk pregnancies in labour, and regular in-service training of midwives and doctors on cardiotocograph interpretation could result in quick detection of compromised fetuses and timely interventions, with emergency cesarean sections performed within 15-30 minutes of diagnosis to avoid stillbirth [27]. Continuation of these interventions could help the region achieve the SDG target of a stillbirth rate of 12 or less per 1,000 total births by 2030 in Ghana [28].
Most of the districts from 2014-2022, which have a stillbirth rate range 13.4 to 34.5 per 1,000 total births, have at least one primary or secondary health facility that is either a regional hospital, district hospital or a CHAG hospital or both. However, all districts below a stillbirth rate range of 0.0 to 4.7 per 1,000 total births have no primary hospital or CHAG hospital. Hence, districts without a primary hospital or CHAG hospital mostly refer maternal emergency cases to these hospitals, where there may be delays which could lead to a stillbirth. Thaddeus and Maine established the ‘three delays’ conceptual framework, which highlights three types of impediments or delays that can limit access to maternal health services and lead to death. These problems include delaying the decision to seek care, arriving at a well-equipped health facility, and receiving adequate care. These delays may raise the risk of maternal and neonatal problems, including stillbirths [29,30].
Districts with a high incidence of stillbirth were Kwahu Afram Plain North, Kwahu West, New Juaben South and Denkyembour. New Juaben South Municipal, which has the regional hospital and a CHAG health facility, had a stillbirth rate range of 19.9 to 34.5 per 1,000 total births from 2014 to 2022. This is because most critical maternal cases are referred from the district hospitals and CHAG hospitals (primary) to the regional hospital (secondary). In Ghana, the referral system enables patients who access care at primary (lower) level health facilities to be referred to secondary or tertiary level to receive emergency care [31]. This may increase the burden on the hospital staff at the regional hospital, and more stillbirths can occur.
Study limitations
The study utilised secondary data, which is limited in terms of variables, to understand the burden of stillbirth in the Eastern Region. The rate of reporting of stillbirth in the DHIMS2 was less than the 100% target for most of the years, which limited the study of the actual representation of stillbirth in the region. The numbers reported are lower. This, however, did not restrict us from determining the trend and distribution of stillbirth in the region.
The stillbirth rate in the Eastern region is on a decline and is still above the regional target, and Kwahu Afram Plain North district, Kwahu West District, New Juaben South Municipal and Denkyembour district have a high incidence of stillbirth rate from 2014 to 2022. The stillbirth target may not be achieved by 2030. Since most stillbirths are preventable, our healthcare professionals need to be trained on how to educate mothers to live healthy lifestyles for safe deliveries, on the dangers of pregnancy-related diseases, and trained on how to screen for and manage hypertension, diabetes, malaria and other diseases that pose risk to safe delivery. Community durbars and radio talks need to be organised to sensitise the public on danger signs and symptoms in pregnancy and healthy nutrition and lifestyle during pregnancy. We highly recommend that our community health workers be trained to conduct more home visits, provide basic health education to pregnant mothers and their families. Referral systems must be strengthened and health workers must be trained adequately to ensure mothers deliver safely. We recommend that there should be capacity building to manage maternal cases in the New Juaben South Municipal. We recommend that the Ghana Health Service strengthen interventions for stillbirth to meet the SDG target of a stillbirth rate of 12 per 1,000 total births by 2030. The Eastern Regional Health Directorate should ensure that data validation is done extensively, especially at the facility level, to ensure data completeness.
What is already known about the topic
What this study adds
We acknowledge the management of the Ghana Health Service, Headquarters and the Eastern Regional Health Directorate for giving us access to the DHIMS2 data that was used for the analysis of the work. We acknowledge AFENET for the technical assistance in making the analysis. We acknowledge Joseph Yaw Jerela for the technical assistance in drawing the choropleth maps.
FAY, WO, JEO, SAP, DAB and MOT were involved in the conceptualization of the work; FAY, EBO were involved in the acquisition of data. FAY, SA, DAB, were involved in the analysis of the data. FAY. SA, SAP, DAB, WO, JF were involved in the interpretation of the data. FAY, EBO, MOT were involved in the drafting of the work; FAY, DAB, JEO, WO, SA, SAP and JF were involved in the critical review of the work. All authors gave the final approval of the work to be published and agreed to be accountable for all aspects of the work.
| Year | Total Births | Stillbirth | Total Stillbirth Rate | Macerated Stillbirth | Macerated Stillbirth Rate | Fresh Stillbirth | Fresh Stillbirth Rate |
|---|---|---|---|---|---|---|---|
| 2014 | 61,349 | 1,102 | 18.0 | 701 | 11.4 | 401 | 6.5 |
| 2015 | 59,644 | 1,060 | 17.8 | 668 | 11.2 | 392 | 6.6 |
| 2016 | 60,995 | 985 | 16.1 | 616 | 10.1 | 369 | 6.0 |
| 2017 | 60,281 | 872 | 14.5 | 554 | 9.2 | 318 | 5.3 |
| 2018 | 63,842 | 898 | 14.1 | 562 | 8.8 | 336 | 5.3 |
| 2019 | 65,283 | 910 | 13.9 | 542 | 8.3 | 368 | 5.6 |
| 2020 | 67,489 | 912 | 13.5 | 543 | 8.0 | 369 | 5.5 |
| 2021 | 71,162 | 970 | 13.6 | 595 | 8.4 | 375 | 5.3 |
| 2022 | 70,608 | 878 | 12.4 | 562 | 8.0 | 316 | 4.5 |
| District / Year | 2014 | 2015 | 2016 | 2017 | 2018 | 2019 | 2020 | 2021 | 2022 | ||||||||||||||||||
|---|---|---|---|---|---|---|---|---|---|---|---|---|---|---|---|---|---|---|---|---|---|---|---|---|---|---|---|
| Total Births | Stillbirth | Rate | Total Births | Stillbirth | Rate | Total Births | Stillbirth | Rate | Total Births | Stillbirth | Rate | Total Births | Stillbirth | Rate | Total Births | Stillbirth | Rate | Total Births | Stillbirth | Rate | Total Births | Stillbirth | Rate | Total Births | Stillbirth | Rate | |
| Abuakwa North | 1975 | 24 | 12.2 | 1892 | 38 | 20.1 | 1891 | 38 | 20.1 | 1906 | 34 | 17.8 | 2063 | 42 | 20.4 | 2278 | 41 | 18.0 | 2103 | 30 | 14.3 | 2578 | 50 | 19.4 | 2437 | 24 | 9.8 |
| Abuakwa South | 1642 | 39 | 23.8 | 1441 | 30 | 20.8 | 1524 | 17 | 11.2 | 1451 | 8 | 5.5 | 1399 | 3 | 2.1 | 1380 | 1 | 0.7 | 1630 | 14 | 8.6 | 1737 | 24 | 13.8 | 1697 | 5 | 2.9 |
| Achiase | 523 | 1 | 1.9 | 398 | 0 | 0.0 | 504 | 3 | 6.0 | 496 | 3 | 6.0 | 606 | 0 | 0.0 | 650 | 0 | 0.0 | 678 | 0 | 0.0 | 705 | 0 | 0.0 | 649 | 0 | 0.0 |
| Akuapem North | 2611 | 18 | 6.9 | 2295 | 24 | 10.5 | 1901 | 21 | 11.0 | 1952 | 11 | 5.6 | 2298 | 6 | 2.6 | 2277 | 6 | 2.6 | 2573 | 14 | 5.4 | 2471 | 5 | 2.0 | 2582 | 13 | 5.0 |
| Akuapem South | 381 | 3 | 7.9 | 427 | 2 | 4.7 | 522 | 0 | 0.0 | 547 | 1 | 1.8 | 508 | 2 | 3.9 | 478 | 0 | 0.0 | 478 | 2 | 4.2 | 700 | 2 | 2.9 | 724 | 1 | 1.4 |
| Akyemansa | 1289 | 6 | 4.7 | 1049 | 4 | 3.8 | 1170 | 4 | 3.4 | 1201 | 1 | 0.8 | 1088 | 4 | 3.7 | 987 | 0 | 0.0 | 956 | 3 | 3.1 | 1004 | 0 | 0.0 | 1309 | 2 | 1.5 |
| Asene Manso Akroso | 450 | 4 | 8.9 | 507 | 1 | 2.0 | 636 | 6 | 9.4 | 676 | 6 | 8.9 | 591 | 5 | 8.5 | 614 | 4 | 6.5 | 689 | 7 | 10.2 | 707 | 2 | 2.8 | 774 | 4 | 5.2 |
| Asuogyaman | 2348 | 45 | 19.2 | 2159 | 28 | 13.0 | 2234 | 31 | 13.9 | 1958 | 30 | 15.3 | 1953 | 34 | 17.4 | 2090 | 27 | 12.9 | 1861 | 22 | 11.8 | 1955 | 16 | 8.2 | 1991 | 27 | 13.6 |
| Atiwa East | 1516 | 31 | 20.4 | 1433 | 46 | 32.1 | 1469 | 54 | 36.8 | 1570 | 33 | 21.0 | 1526 | 27 | 17.7 | 1589 | 28 | 17.6 | 1725 | 25 | 14.5 | 1849 | 36 | 19.5 | 2020 | 44 | 21.8 |
| Atiwa West | 715 | 7 | 9.8 | 754 | 8 | 10.6 | 795 | 3 | 3.8 | 742 | 0 | 0.0 | 726 | 1 | 1.4 | 647 | 0 | 0.0 | 800 | 0 | 0.0 | 823 | 2 | 2.4 | 798 | 1 | 1.3 |
| Ayensuano | 997 | 1 | 1.0 | 1034 | 2 | 1.9 | 1039 | 0 | 0.0 | 965 | 0 | 0.0 | 894 | 2 | 2.2 | 984 | 4 | 4.1 | 1138 | 2 | 1.8 | 1384 | 1 | 0.7 | 1268 | 2 | 1.6 |
| Birim Central | 3709 | 128 | 34.5 | 3642 | 115 | 31.6 | 3773 | 110 | 29.2 | 3686 | 106 | 28.8 | 3845 | 75 | 19.5 | 3923 | 75 | 19.1 | 4068 | 72 | 17.7 | 4133 | 67 | 16.2 | 3903 | 62 | 15.9 |
| Birim North | 1408 | 22 | 15.6 | 1534 | 32 | 20.9 | 1574 | 26 | 16.5 | 1584 | 26 | 16.4 | 1691 | 28 | 16.6 | 1902 | 36 | 18.9 | 1973 | 32 | 16.2 | 2197 | 39 | 17.8 | 2103 | 29 | 13.8 |
| Birim South | 473 | 9 | 19.0 | 434 | 6 | 13.8 | 423 | 1 | 2.4 | 505 | 4 | 7.9 | 500 | 1 | 2.0 | 426 | 2 | 4.7 | 358 | 5 | 14.0 | 388 | 0 | 0.0 | 428 | 3 | 7.0 |
| Dekyembour | 3129 | 89 | 28.4 | 2696 | 66 | 24.5 | 2702 | 55 | 20.4 | 2601 | 60 | 23.1 | 2769 | 69 | 24.9 | 2861 | 76 | 26.6 | 2906 | 77 | 26.5 | 2802 | 46 | 16.4 | 2808 | 44 | 15.7 |
| Fante Akwa North | 1110 | 31 | 27.9 | 1119 | 27 | 24.1 | 1086 | 29 | 26.7 | 1182 | 14 | 11.8 | 1311 | 25 | 19.1 | 1128 | 24 | 21.3 | 1185 | 23 | 19.4 | 1217 | 18 | 14.8 | 1186 | 20 | 16.9 |
| Fante Akwa South | 468 | — | 0.0 | 434 | 2 | 4.6 | 456 | 2 | 4.4 | 511 | 3 | 5.9 | 543 | 0 | 0.0 | 435 | 1 | 2.3 | 431 | 1 | 2.3 | 445 | 0 | 0.0 | 533 | 0 | 0.0 |
| Kwaebibrim | 2045 | 20 | 9.8 | 2030 | 28 | 13.8 | 2001 | 10 | 5.0 | 1841 | 16 | 8.7 | 2048 | 13 | 6.3 | 2048 | 16 | 7.8 | 2133 | 18 | 8.4 | 2223 | 11 | 4.9 | 2224 | 16 | 7.2 |
| Kwahu Afram Plain North | 1120 | 35 | 31.3 | 1098 | 26 | 23.7 | 1086 | 21 | 19.3 | 1378 | 28 | 20.3 | 1479 | 20 | 13.5 | 1384 | 33 | 23.8 | 1525 | 37 | 24.3 | 1540 | 33 | 21.4 | 1503 | 35 | 23.3 |
| Kwahu Afram Plain South | 898 | 12 | 13.4 | 856 | 6 | 7.0 | 723 | 4 | 5.5 | 777 | 11 | 14.2 | 920 | 6 | 6.5 | 1027 | 3 | 2.9 | 1076 | 4 | 3.7 | 1083 | 8 | 7.4 | 1047 | 13 | 12.4 |
| Kwahu East | 1288 | 4 | 3.1 | 1198 | 10 | 8.3 | 1256 | 2 | 1.6 | 1260 | 2 | 1.6 | 1183 | 4 | 3.4 | 1253 | 3 | 2.4 | 1412 | 0 | 0.0 | 1396 | 1 | 0.7 | 1352 | 1 | 0.7 |
| Kwahu South | 2968 | 41 | 13.8 | 2748 | 73 | 26.6 | 2635 | 47 | 17.8 | 2720 | 49 | 18.0 | 2789 | 53 | 19.0 | 2790 | 47 | 16.8 | 2944 | 49 | 16.6 | 3000 | 64 | 21.3 | 2799 | 43 | 15.4 |
| Kwahu West | 3860 | 100 | 25.9 | 3808 | 96 | 25.2 | 4010 | 86 | 21.4 | 3776 | 60 | 15.9 | 3961 | 65 | 16.4 | 3962 | 67 | 16.9 | 4041 | 64 | 15.8 | 4052 | 81 | 20.0 | 4342 | 65 | 15.0 |
| Lower Manya Krobo | 3562 | 71 | 19.9 | 3297 | 42 | 12.7 | 3139 | 46 | 14.7 | 3247 | 22 | 6.8 | 3391 | 21 | 6.2 | 3438 | 33 | 9.6 | 3644 | 34 | 9.3 | 4193 | 39 | 9.3 | 3716 | 23 | 6.2 |
| New Juaben North | 263 | 1 | 3.8 | 343 | 0 | 0.0 | 427 | 3 | 7.0 | 531 | 5 | 9.4 | 576 | 6 | 10.4 | 665 | 10 | 15.0 | 800 | 9 | 11.3 | 923 | 12 | 13.0 | 888 | 13 | 14.6 |
| New Juaben South | 6294 | 212 | 33.7 | 6260 | 166 | 26.5 | 6324 | 195 | 30.8 | 5950 | 165 | 27.7 | 6386 | 198 | 31.0 | 6472 | 184 | 28.4 | 6582 | 163 | 24.8 | 6556 | 203 | 31.0 | 6596 | 191 | 29.0 |
| Nsawam- Adoagyiri | 6026 | 75 | 12.4 | 6438 | 77 | 12.0 | 7238 | 67 | 9.3 | 7206 | 92 | 12.8 | 8015 | 86 | 10.7 | 8142 | 109 | 13.4 | 8069 | 120 | 14.9 | 8427 | 119 | 14.1 | 7825 | 101 | 12.9 |
| Okere | 477 | 1 | 2.1 | 536 | 1 | 1.9 | 543 | 0 | 0.0 | 454 | 0 | 0.0 | 611 | 1 | 1.6 | 566 | 0 | 0.0 | 605 | 0 | 0.0 | 660 | 3 | 4.5 | 653 | 0 | 0.0 |
| Suhum | 2648 | 37 | 14.0 | 2511 | 26 | 10.4 | 2439 | 20 | 8.2 | 2360 | 26 | 11.0 | 2375 | 28 | 11.8 | 2553 | 38 | 14.9 | 2929 | 39 | 13.3 | 3072 | 38 | 12.4 | 3326 | 38 | 11.4 |
| Upper Manya Krobo | 1076 | 18 | 16.7 | 1189 | 21 | 17.7 | 1107 | 32 | 28.9 | 1095 | 25 | 22.8 | 1272 | 22 | 17.3 | 1323 | 121 | 91.5 | 1226 | 15 | 12.2 | 1320 | 13 | 9.8 | 1307 | 22 | 16.8 |
| Upper West Akim | 826 | 2 | 2.4 | 787 | 1 | 1.3 | 832 | 3 | 3.6 | 872 | 2 | 2.3 | 1062 | 3 | 2.8 | 1349 | 4 | 3.0 | 1149 | 0 | 0.0 | 1387 | 0 | 0.0 | 1342 | 7 | 5.2 |
| West Akim | 2417 | 44 | 18.2 | 2290 | 53 | 23.1 | 2296 | 48 | 20.9 | 2201 | 26 | 11.8 | 2215 | 40 | 18.1 | 2190 | 22 | 10.0 | 2359 | 29 | 12.3 | 2613 | 35 | 13.4 | 2751 | 28 | 10.2 |
| Yilo Krobo | 880 | 1 | 1.1 | 1007 | 3 | 3.0 | 1234 | 1 | 0.8 | 1080 | 3 | 2.8 | 1248 | 2 | 1.6 | 1463 | 4 | 2.7 | 1403 | 2 | 1.4 | 1622 | 2 | 1.2 | 1733 | 3 | 1.7 |
Source: Ghana DHIMS II
| District | Total Births | Macerated Stillbirth | Macerated Stillbirth Rate | Fresh Stillbirth | Fresh Stillbirth Rate |
|---|---|---|---|---|---|
| Abuakwa North | 2437 | 16 | 6.6 | 8 | 3.3 |
| Abuakwa South | 1697 | 0 | 0.0 | 5 | 2.9 |
| Achiase | 649 | 0 | 0.0 | 0 | 0.0 |
| Akuapem North | 2582 | 10 | 3.9 | 3 | 1.2 |
| Akuapem South | 724 | 0 | 0.0 | 1 | 1.4 |
| Akyemansa | 1309 | 0 | 0.0 | 2 | 1.5 |
| Asene Manso Akroso | 774 | 2 | 2.6 | 2 | 2.6 |
| Asuogyaman | 1991 | 18 | 9.0 | 9 | 4.5 |
| Atiwa East | 2020 | 33 | 16.3 | 9 | 4.5 |
| Atiwa West | 798 | 0 | 0.0 | 1 | 1.3 |
| Ayensuano | 1268 | 1 | 0.8 | 1 | 0.8 |
| Birim Central | 3903 | 43 | 11.0 | 19 | 4.9 |
| Birim North | 2103 | 11 | 5.2 | 18 | 8.6 |
| Birim South | 428 | 1 | 2.3 | 2 | 4.7 |
| Dekyembour | 2808 | 23 | 8.2 | 21 | 7.5 |
| Fante Akwa North | 1186 | 14 | 11.8 | 6 | 5.1 |
| Fante Akwa South | 533 | 0 | 0.0 | 0 | 0.0 |
| Kwaebibrim | 2224 | 10 | 4.5 | 6 | 2.7 |
| Kwahu Afram Plain North | 1503 | 24 | 16.0 | 11 | 7.3 |
| Kwahu Afram Plain South | 1047 | 6 | 5.7 | 7 | 6.7 |
| Kwahu East | 1352 | 0 | 0.0 | 1 | 0.7 |
| Kwahu South | 2799 | 36 | 12.9 | 7 | 2.5 |
| Kwahu West | 4342 | 46 | 10.6 | 19 | 4.4 |
| Lower Manya Krobo | 3716 | 16 | 4.3 | 7 | 1.9 |
| New Juaben North | 888 | 10 | 11.3 | 3 | 3.4 |
| New Juaben South | 6596 | 122 | 18.5 | 69 | 10.5 |
| Nsawam- Adoagyiri | 7825 | 61 | 7.8 | 40 | 5.1 |
| Okere | 653 | 0 | 0.0 | 0 | 0.0 |
| Suhum | 3326 | 25 | 7.5 | 13 | 3.9 |
| Upper Manya Krobo | 1307 | 11 | 8.4 | 11 | 8.4 |
| Upper West Akim | 1342 | 7 | 5.2 | 0 | 0.0 |
| West Akim | 2751 | 13 | 4.7 | 15 | 5.5 |
| Yilo Krobo | 1733 | 2 | 1.2 | 1 | 0.6 |
Source: Ghana DHIMS II