Research | Open Access | Volume 9 (1): Article 07 | Published: 09 Jan 2026
Views: 403
Menu, Tables and Figures
| Variable | Numerator | Denominator |
|---|---|---|
| Proportion of PBC-TB index cases whose contacts were listed | Number of PBC-TB index cases whose contacts were listed | Total number of PBC-TB index cases diagnosed |
| Proportion of listed contacts screened for TB using GeneXpert | Number of contacts screened | Total number of contacts listed |
| Proportion of presumptive TB cases among the contacts | Number of presumptive TB cases identified | Total number of TB contacts screened |
| Proportion of presumptive contacts that were tested for TB | Number of presumptive contacts tested | Total number of presumptive contacts |
| Proportion of TB-positive contacts that were initiated on treatment | Number of TB-positive contacts initiated on treatment | Total number of TB contacts that tested positive |
| Proportion of contacts below 5 years that were initiated on TPT | Number of contacts below 5 years initiated on TPT | Total number of contacts below 5 years that were not positive for TB |
| Proportion of HIV-positive contacts that were initiated on TPT | Number of HIV-positive contacts initiated on TPT | Total number of HIV-positive contacts |
| Proportion of TB-positive contacts initiated on TB treatment who were cured | Number of TB-positive contacts on treatment who were cured | Total number of TB-positive contacts initiated on TB treatment |
This table defines the indicators used to measure performance along the TB contact tracing cascade.
Indicators include proportions of index cases with contacts listed, contacts screened, presumptive
cases identified, presumptive cases tested, TB-positive contacts initiated on treatment, children
under 5 years initiated on TB preventive therapy (TPT), and HIV-positive contacts initiated on TPT.
Proportions were calculated by dividing the numerator by the corresponding denominator as described.
These indicators are adapted from national and WHO guidelines for TB contact tracing and treatment monitoring.
Table 1: Tuberculosis Contact Tracing Performance Indicators
| Variable | Cases (n=231) n (%) | 95% CI | Contacts (n=1215) n (%) | 95% CI |
|---|---|---|---|---|
| Age (years) | ||||
| <5 | 3 (1.3) | 0.4–3.7 | 169 (13.9) | 12.1–16.0 |
| 5–9 | 9 (3.9) | 2.1–7.2 | 175 (14.4) | 12.5–16.5 |
| 10–14 | 1 (0.4) | 0.1–2.4 | 163 (13.4) | 11.6–15.4 |
| 15–19 | 0 (0.0) | 0.0–1.6 | 136 (11.2) | 9.5–13.1 |
| ≥20 | 218 (94.4) | 90.6–96.7 | 570 (47.0) | 44.1–49.7 |
| Sex | ||||
| Male | 143 (62.0) | 55.5–67.9 | 562 (46.3) | 43.5–49.1 |
| Female | 88 (38.0) | 32.1–44.5 | 653 (53.7) | 50.9–56.5 |
| HIV status | ||||
| Positive | – | – | 12 (1.0) | 0.6–1.7 |
| Negative | – | – | 820 (67.5) | 64.8–70.1 |
| Unknown | – | – | 383 (31.5) | 29.0–34.2 |
| Hospital reported to | ||||
| Soroti RRH | 51 (22.0) | 17.2–27.9 | 368 (30.3) | 27.8–32.9 |
| Mbale RRH | 71 (30.7) | 25.1–37.0 | 359 (29.5) | 27.0–32.2 |
| Masaka RRH | 59 (25.5) | 20.3–31.5 | 291 (24.0) | 21.6–26.4 |
| Naguru RRH | 50 (21.7) | 16.8–27.4 | 197 (16.2) | 14.2–18.4 |
| Relationship to TB case | ||||
| Family member | – | – | 1176 (96.8) | 95.6–97.6 |
| Institution | – | – | 39 (3.2) | 2.4–4.4 |
NB: NA means Zero.
Table 2: Description of tuberculosis cases and contacts from four regional referral hospitals, Uganda, January – December 2022

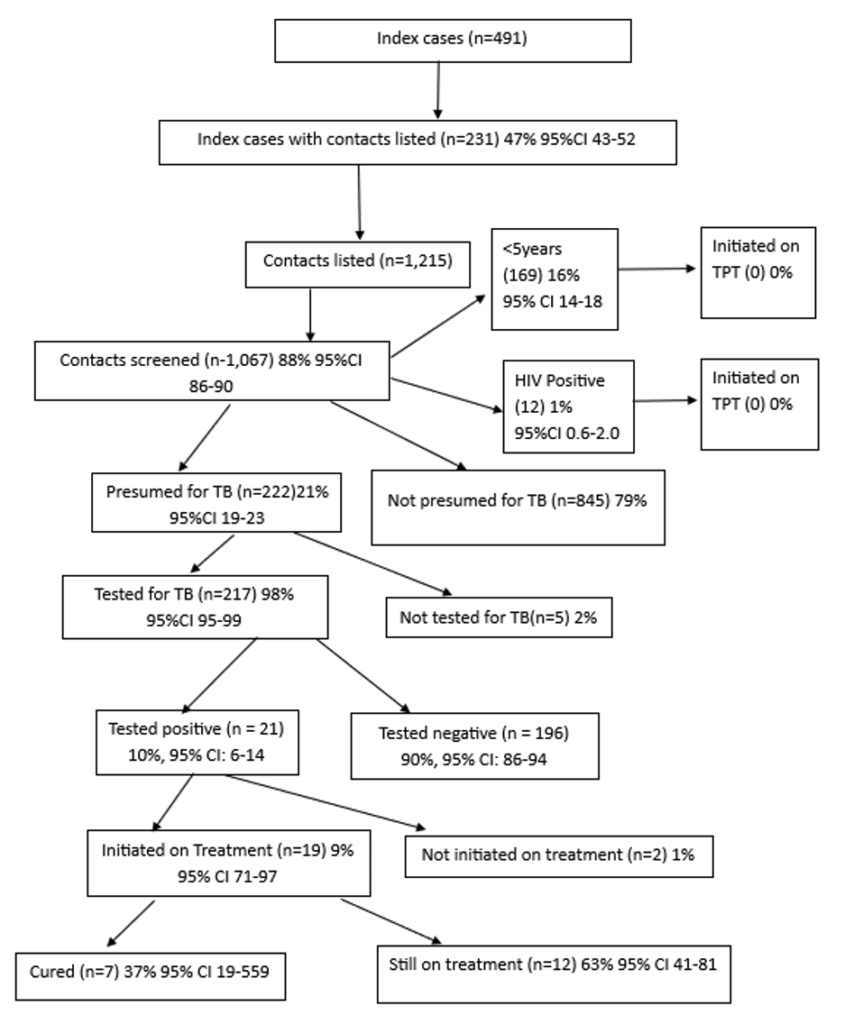

This figure illustrates the TB contact tracing cascade from index case listing to treatment outcomes.
Of 491 index cases, 231 (47%) had contacts listed (n=1,215). Of these, 1,067 (88%) were screened,
222 (21%) were presumptive, 217 (98%) were tested, 21 (10%) tested positive, 19 (91%) initiated
treatment, 7 (37%) cured, and 12 (63%) were still on treatment. No contacts aged <5 years or
HIV-positive individuals were initiated on TPT.
Gertrude Abbo1,2,&, Norbert Muhoozi1,2, Charity Kakuru1,2, Margaret Ndagire Ireeta1,3, Dinah Nandudu1,3, Violet Chemutai1,3, Herbert Isabirye1,3, Robert Maiteki1,3, Agnes Flavia Wanyoto1,4, Moureen Asimire1,4, Dansan Atim1,4, Kenneth Turyahabwe1,4, Wellborn Osinde1,5, Apolo Ayebare1,5, Winfred Ayenyo1,5, Samuel Gidudu6, Irene Kyamwine Byakatonda6, Hildah Tendo Nansikombi1,6, Lilian Bulage6, Sarah Elayeete1,6, Patricia Eyu1,6, Alex Riolexus Ario6
1Intermediate Field Epidemiology Training Program, Uganda National Institute of Public Health, Kampala, Uganda, 2Masaka Regional Referral Hospital, Masaka, Uganda, 3Mbale Regional Referral Hospital, Mbale, Uganda, 4Ministry of Health, Kampala, Uganda, 5Soroti Regional Referral Hospital, Soroti, Uganda, 6Uganda National Institute of Public Health, Kampala, Uganda
&Corresponding author: Gertrude Abbo, Intermediate Field Epidemiology Training Program, Uganda National Institute of Public Health, Kampala, Email: abbog@uniph.go.ug, ORCID: https://orcid.org/0009-0007-9072-5783
Received: 21 Sep 2025, Accepted: 08 Jan 2026, Published: 09 Jan 2026
Domain: Infectious Disease Epidemiology
Keywords: Tuberculosis, Contact tracing, Contact screening, Uganda
©Gertrude Abbo et al. Journal of Interventional Epidemiology and Public Health (ISSN: 2664-2824). This is an Open Access article distributed under the terms of the Creative Commons Attribution International 4.0 License (https://creativecommons.org/licenses/by/4.0/), which permits unrestricted use, distribution, and reproduction in any medium, provided the original work is properly cited.
Cite this article: Gertrude Abbo et al., Tuberculosis contact follow-up cascade in four regional referral hospitals, Uganda, 2022. Journal of Interventional Epidemiology and Public Health. 2025; 9(1):07. https://doi.org/10.37432/jieph-d-25-00202
Introduction: Uganda continues to experience a high tuberculosis (TB) burden, with persistent gaps in contact identification and linkage to care. We evaluated the TB contact follow-up cascade in four regional referral hospitals in Uganda from January to December 2022 to inform programmatic improvements.
Methods: We conducted a descriptive cross-sectional analysis using routinely collected data from the TB unit and contact tracing registers. We summarised cascade indicators using proportions and 95% confidence intervals (CIs), including contact listing, screening, diagnostic testing, treatment initiation, and eligibility for TB preventive therapy (TPT).
Results: Among 491 index TB cases, 231 (47.0%, 95% CI: 42.7–51.5) had contacts listed, yielding 1,215 contacts with a median age of 19 (IQR: 8–32) years. Of these contacts, 88.0% (1067/1215) were screened, 21% (222/1067) were presumptive for TB, 98% (217/222) of presumptive contacts were tested, and 10%(21/217) tested positive. Among confirmed TB cases, 91% (19/21) were initiated on treatment. Despite eligibility, no contacts under five years of age or living with HIV were initiated on TPT.
Conclusion: While screening and diagnostic testing were well implemented, substantial gaps remain in contact listing and TB preventive therapy initiation for high-risk groups. Strengthening systematic contact identification and integrating TPT into routine TB services are critical to improving cascade completion and advancing Uganda’s End TB targets. Our findings are based on routinely collected data from four purposively selected facilities, which may limit generalizability and underestimate cascade proportions where data were missing.
Keywords: Tuberculosis, Contact tracing, Contact screening, Uganda
Tuberculosis (TB) remains a major global health challenge despite decades of control efforts [1]. Building on earlier initiatives such as the DOTS strategy and the Stop TB Strategy, in 2014, the World Health Organization (WHO) developed the END TB strategy to reduce new TB cases by 90% and TB-related deaths by 95% during 2015–2035 [2] Achieving these targets requires integrated, patient-centred TB care and prevention services and intensified research and innovation.
Central to the End-TB strategy is contact tracing for index TB cases in low-income countries [3]. Contact tracing for pulmonary bacteriologically confirmed tuberculosis (PBC-TB) cases involves the systematic evaluation for TB among close contacts of an index PBC-TB case, including: index relatives or the patient’s social networks [4]. This aids the identification of undiagnosed TB among household and close contacts of any TB patient who is HIV positive, has pulmonary TB (PTB) or smear-positive TB, is a child less than five years old, or has drug resistant TB [5]. Upon identification of contacts, TB preventive treatment (TPT) is recommended for children less than 5 years and HIV-positive adults. Contact tracing has been proven to facilitate early diagnosis and treatment, and is associated with higher treatment success, cure, lower death, and lower loss-to-follow-up [3,5].
Identifying TB patients via contact investigation requires the effective completion of four key steps in the delivery cascade: scheduling visits to homes or workplaces of index PBC-TB patients; initiating these visits by physically reaching the homes or workplaces of index patients; screening all household contacts; and ensuring that all symptomatic and high-risk contacts complete TB evaluation [3,5].
In Uganda, the proportion of TB contacts investigated in 2021 was estimated to be 58.5% [5]. Of these, about 85% were screened, falling short of the national target of 90% [6]. However, there is limited information about the performance of the other steps of the TB contact tracing cascade, particularly regarding the identification of new patients with TB and their initiation on treatment [3]. The lack of data on when and where contacts are lost to follow-up constrains efforts to strengthen contact investigation delivery [7]. Addressing this gap requires paying close attention to each step of the cascade to account for contacts reached and identify weaknesses along the pathway [8]. This study assessed the TB contact tracing cascade to identify gaps in contact listing, screening, testing and TPT initiation in four selected regional referral hospitals of Uganda, January-December 2022.
Study setting and design
We conducted a descriptive cross-sectional study using routinely collected data from the unit TB and contact tracing registers at four regional referral hospitals (RRH) in Uganda. These included: Mbale, Masaka, Soroti, and Naguru RRH, which were conveniently selected because they were the operational sites of the study investigators. These hospitals serve a population of approximately 2,000,000 people monthly [9]. The four provide free TB diagnostic and treatment services, including screening, diagnosis, and inpatient care, which are all integrated into the general health care system [10]. Given the descriptive focus of our study, inferential statistics were not applied; our analyses aimed to describe the summarize the TB contact tracing cascade and identify programmatic gaps rather than test for associations.
Study population and eligibility criteria
All bacteriologically confirmed pulmonary TB (PBC-TB) index cases diagnosed between January and December 2022 at the four RRHs were included, together with their listed household and close contacts. PBC-TB index cases were defined as newly diagnosed patients recorded in the unit TB register whose contacts were eligible for listing and follow-up during the study period. Contacts were defined as individuals recorded in the National TB and Leprosy Program (NTLP) contact tracing register as having been exposed to a PBC-TB index case.
Presumptive TB cases were defined as contacts who reported at least one WHO-recommended TB symptom (cough, fever, night sweats, or weight loss) or met NTLP criteria for further evaluation, including children under five years of age and people living with HIV [11]. This definition was applied uniformly across all facilities.
Index cases and contacts were linked using unique identifiers and cross-checked using patient registration number, age, sex, and residence. Records that could not be reliably linked were excluded. A random 10% sample of matched records was validated against source documents.
Data sources and linkage procedures
All data were extracted and entered electronically using Kobo Collect by trained data officers stationed at the TB clinics. We extracted data from the unit TB registers and contact tracing registers at each RRH. The two datasets were linked using the unit registration number and patient identifiers, which included age, sex, and residence. Duplicate records were cross-checked and resolved by matching demographic household information. The cleaned dataset was compiled into a single database for analysis.
Study variables, data management, and analysis
We first collected data on all PCB-TB index cases from the unit TB register. For each index case, we recorded demographic information (age, sex, district, and subcounty) and clinical details, including TB type, HIV status, bacteriological confirmation, and treatment outcome. Each index case was assigned a unique identifier to link it to its corresponding contacts.
We also abstracted data on all contacts of the index cases from the contact tracing register. For each contact, we collected demographic characteristics (name, age, sex, district, subcounty, and village), the relationship to the index case, TB screening status and results, and information on tuberculosis preventive therapy (TPT), including initiation and completion dates where applicable.
Data completeness and internal consistency were assessed through double-entry verification and review of source registers. Overall, 3.8% of contact records had missing screening information, and 2.1% had missing testing or TPT documentation and these were excluded from their respective denominators. Records with missing information were excluded from the denominators for the relevant cascade indicators only. To minimize potential bias, data abstraction procedures were standardized across all sites, and a random sample of records was verified against source documents. We performed descriptive analyses using Epi Info version 7. For each cascade step, we calculated numerators, denominators, proportions, and Wilson 95% confidence intervals (CIs) to quantify precision. Results were summarized overall and by facility, age group, sex, and HIV status (Table 1).
Ethical Considerations
This analysis utilized aggregated programmatic surveillance data from the unit TB and contact tracing registers in four selected Regional Referral hospitals (RRHs). No personal identifiers were abstracted. Approval to access the facility TB registers was obtained from the facility in charge and the National TB and Leprosy Program (NTLP). Permission from the MoH to use the data. The US Centres for Disease Control and Prevention (CDC) also provided the non-research determination for non-human subjects, which was conducted in accordance with applicable federal law and CDC policy. §§See, e.g., 45 C.F.R. part 46, 21 C.F.R. part 56; 42 U.S.C. §241(d); 5 U.S.C. §552a; 44 U.S.C. §3501 et seq, and waives the need for a full Institutional Review Board. We collected de-identified data and stored it in password-protected computers, and access was limited to only the study team.
Additionally, permission to contact cases and their listed contacts by phone was obtained as part of the study protocol. During data verification, a limited number of contacts were followed up to confirm screening and treatment outcomes. Before each call, the purpose of the follow-up was explained, and verbal consent was obtained from the respondent. Respondents were informed about the purpose of the call, assured of confidentiality before collecting any additional data.
All follow-up calls were conducted in accordance with approved ethical guidelines to ensure confidentiality and voluntary participation. This process adhered to the Uganda Ministry of Health ethical guidelines for surveillance data, ensuring protection of the participants’ privacy. Our overall analysis used de-identified datasets and was classified as non-research by the United States Centres for Disease Control and Prevention (CDC) under the MOH-CDC cooperative agreement.
Overall, we identified 491 index TB cases. Of these, 231 (47.0%, 95% CI: 42.7-51.5) had contacts listed for follow-up (Table 2). Of the cases listed, 143 (62.0%) were male with a median age of 38 (Interquartile range [IQR]: 28–50) years. Three (1.3%) of the index cases were under 5 years. Most, 218 (94.0%), were aged ≥20 years with an average of five contacts listed per case, with a median of 5 (IQR: 3–7.3).
A total of 1,215 contacts were listed for the identified 231 index cases, with a median age of 18 (IQR: 8-32) years. Of these, 653 (53.7%, 95% CI: 50.9-56.5) were female, 169 (13.9%) were under 5 years, and 12 (0.9% 95% CI: 0.6-1.7) were HIV positive. The majority, 1,176 (96.7% 95% CI: 95.6-97.6) were household members of the index cases (Table 2).
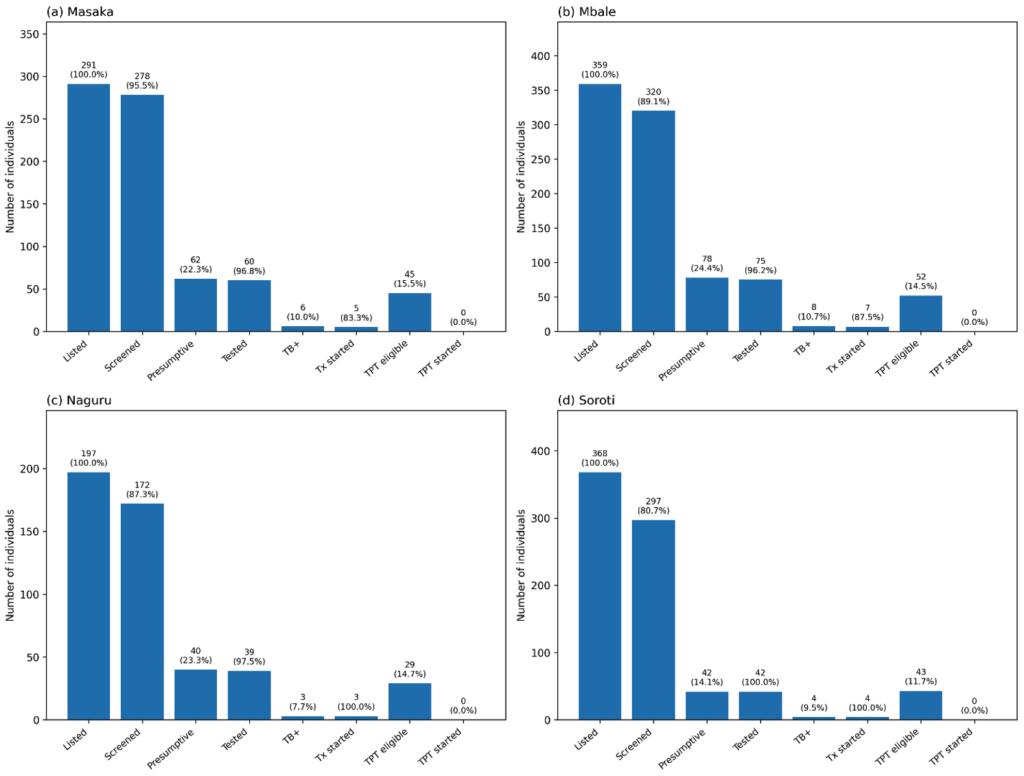
TB contact tracing cascade by facility, Uganda, January-December, 2022
By facility, Masaka RRH achieved the highest screening rate (96.0%, 95% CI 92.1–97.6) and testing completion (97.0%). Soroti RRH had the lowest screening rate (81%) and the smallest proportion of presumptive contacts (14.0%) (Figure 1). Naguru RRH and Mbale RRH had moderate screening rates (87.0% and 81.0%, respectively. Importantly, Naguru and Soroti RRH had all its TB contacts initiated on treatment (100%) compared to the other two RRHs (Figure 1).
Performance of contact tracing indicators across the tuberculosis contact tracing cascade in selected regional referral hospitals, Uganda, January-December 2022
Among 491 index TB cases, 231 (47%,95% CI 42.7-51.5) had their contacts listed for follow-up. The contacts numbered 1,215. (Figure 1) Of these listed contacts, 1,067 (88.0%, 95% CI 85.9-89.5) were screened for TB, and 222 (21.0%, 95% CI 18.5-23.3) were presumed to have TB. Of those presumed for TB, 217 (98.0%, 95% CI 94.8-99.0) were tested, and 21 (10.0%, 95% CI: 6.4-14.3) tested positive (Figure 1). Among the positive cases, 19 (90.4%, 95% CI: 71.1-97.3) were started on treatment. Of those started on treatment, 7 (37.0%, 95% CI 19.1-59.0) were declared cured, while 12 (63.0%, 95% CI 41.0-80.9) were still on treatment at the time of data collection (Figure 1).
Of the 1,067 contacts screened, 169 (16.0%, 95% CI 13.8-18.2) were children <5 years, and 12 (1.0%, 95% CI: 0.6-2.0) were HIV-positive. Despite being eligible, none of the TB contacts <5 years or those who were HIV-positive were initiated on TPT (Figure 2).
This study examined gaps in TB contact tracing follow-up across the care cascade across the four regional referral hospitals in Uganda, highlighting strengths in screening and diagnostic evaluation alongside critical weaknesses in contact listing and TPT initiation. While most contacts who were identified progressed through screening, testing, and treatment initiation, substantial losses occurred at the earliest and preventive stages of the cascade. The most prominent gap was observed during contact listing. Less than half of index TB cases had contacts documented for follow-up, indicating missed opportunities for early identification of exposed individuals. Incomplete contact listing represents the most critical weakness in the TB contact tracing cascade, as it directly limits the pool of individuals eligible for screening, diagnosis, and prevention. In practice, this gap reduces the effectiveness of contact investigation and increases the risk of undetected transmission within households and communities. Similar challenges have been reported in other Ugandan and regional studies, suggesting persistent system barriers to comprehensive contact identification in routine programmatic settings [11].
Most PBC-TB cases were among adults, while a substantial proportion of contacts were children and adolescents. This pattern suggests ongoing household exposure driven by close and prolonged contact, overcrowded living conditions, and delayed identification of infectious cases, as documented in previous studies [11,12]. Children remain particularly vulnerable due to their dependence on household environments and frequent exposure to infectious adults.[12,13, 14].
Facility-level performance varied, reflecting differences in operational capacity, including staffing stability, coordination between clinical and community teams, and partner-supported outreach. Facilities with stronger screening and testing performance seemed to benefit from more consistent human and logistic resources, while lower-performing facilities, such as Soroti RRH, may be affected by staffing shortages, competing clinical workloads, reduced outreach, and weaker contact tracing systems. Although diagnostic and treatment performance was strong once contacts were identified, a significant gap was observed in TB preventive therapy (TPT) delivery, with no eligible children under five or contacts living with HIV started on preventive treatment. This gap indicates a disconnect between policy and practice and may be caused by limited health worker confidence, concerns about drug availability, high workload, inadequate training, weak integration of TPT into routine workflows, poor documentation, and delayed dissemination of eligibility guidelines. Similar challenges have been reported elsewhere [15,16], highlighting the need to improve facility capacity and ensure equitable support from partners.
Less than half of the PBC-TB cases had their contacts listed for follow-up, far below the national target of 100%. This low performance may be partly attributed to limited funding for TB contact tracing, which constrains critical operational activities such as community outreach, transport facilitation for field teams, and adequate staffing for contact investigation. Insufficient financial support may also limit supervision, data capture, and follow-up visits, reducing the ability of health facilities to systematically identify and document all eligible contacts. Nevertheless, this level of contact listing is comparable to findings from studies in Northern and Central Uganda [5]. Additional contributing factors may include the conduct of contact tracing during daytime hours when many household members are away at work or engaged in business activities [17], as well as high health worker turnover, which reduces the available workforce for sustained contact follow-up [18].
The relatively high screening rate observed in this study may reflect improvements in the health workforce over time and support from nongovernmental organizations that provide human resources for TB contact tracing [19]. Similar findings across studies may be attributed to comparable settings, including symptom-based screening approaches, similar health system structures, and the predominance of household contacts as the primary source of exposure. The relatively low proportion of presumptive TB cases suggests gaps in case finding that may limit early detection and contribute to ongoing transmission. Nearly all presumptive contacts were tested for TB, exceeding the End TB strategy target of 90% [20] and findings from studies in central Uganda [20]. High testing coverage may be attributed to patient incentives such as transport refunds, meal or airtime support, and reduced waiting times at facilities, as well as improved diagnostic capacity through expanded use of GeneXpert, which has shortened turnaround times [3,21].
The proportion of presumptive contacts that tested positive and TB-positive contacts initiated on treatment was way below national targets [22]. The gap can be attributed to a combination of causes, such as underreporting and data quality issues [23]. Further studies are needed to explore this finding in detail. Evidence from previous studies suggests this may be due to the side-effects of TB drugs [9], missed clinic appointments [24], stigma [9,25], transportation challenges [9,26], limited social support [9,27], stock out of medicine [24,28], and poor communication between the health worker and the patient [29,30].
Young children and HIV-positive contacts living in close contact with an index TB case are at high risk of infection and progression to TB disease [31,32]. However, in our study, none of the under-fives and HIV-positive contacts in our study were initiated on TPT. This gap may partly reflect the delayed release of guidelines extending TPT eligibility from children under 5 years to those under 15 years [33]. Evidence also shows that progress in TPT initiation has been slower among children under 5 years than among people living with HIV [34]. Additional barriers include health workers’ reluctance to initiate TPT due to fears of irregular drug supply and shortages of dedicated TB staff [35]. To improve TB prevention among children and TB-exposed contacts, standardized approaches are needed [34]. Such strategies should be fully integrated into existing national TB and leprosy program guidelines to ensure consistency and sustainability.
Studies examining treatment outcomes for new and relapse TB cases indicate that African countries, on average, achieve 83% treatment success [36,37], although a few countries report substantially lower success rates [38,39]. In our study, approximately one third of patients initiated on TB treatment had completed treatment and were cured, which is lower than previously reported rates. This lower proportion is primarily because the majority of patients had not yet completed their treatment course at the time of data collection. Strengthening patient adherence through enhanced counselling, follow-up, and measures to prevent treatment default could improve TB treatment success rates [40].
Overall, these findings have important implications for Uganda’s TB control strategy. Strengthening systematic contact listing at the point of diagnosis, improving coordination between facility-based teams and community structures, and institutionalizing TPT delivery within routine outreach activities are essential to closing remaining gaps in the cascade. Reinforcing supportive supervision, expanding digital contact tracing tools, and ensuring reliable preventive therapy supply would further enhance accountability and cascade completion [41]. These actions align with the WHO End TB strategy pillars, emphasizing patient-centred care, strengthened surveillance, and innovation, and support Uganda’s national goal of expanding TB prevention coverage among priority populations [42].
Study limitations
This analysis relied on routinely collected program data, which may be subject to reporting errors and missing information. Although records were cross-validated through phone follow-up with selected cases and contacts, some variables remained incomplete. Excluding records with missing documentation from denominators for screening, testing, and TPT initiation may have introduced bias and likely led to underestimation of cascade performance. Additionally, the lack of temporal data limited the assessment of the timeliness of contact follow-up, testing, and treatment initiation. Future evaluations should incorporate temporal indicators to better assess delays and program responsiveness.
This study demonstrates strong performance in TB contact screening and diagnostic evaluation once contacts are identified; however, substantial gaps remain in systematic contact listing and initiation of TPT among high-risk groups. Addressing these gaps will require strengthening routine contact identification at diagnosis, ensuring consistent availability and delivery of preventive therapy, and enhancing community-based follow-up. Targeted operational improvements in these areas are essential to improve cascade completion and accelerate progress towards Uganda’s End TB targets.
What is already known about the topic
What this study adds
We acknowledge the Ministry of Health, US CDC, for providing technical support during the data collection process. We also acknowledge the staff at the Masaka, Mbale, Naguru, and Soroti regional referral hospitals for permitting data collection. We acknowledge the Data to Impact Program at the Uganda National Institute of Public Health for funding a five-day workshop that supported the development of this manuscript
GA, NM, CK, MNI, DN, VC, HI, RM, AFW, MA, DA, KT, WO, AA, WAY, SG, IKB, GA drafted the initial manuscript. GA, CK, MNI, VC, AFW, DA, KT, and RM wrote the protocol of the study, and GA, WO, WAY, AA, DN, SG, and MA analyzed and interpreted the data. GA, PE, IKB, HN, LB, and SE contributed to the first draft. HN, LB, SE, PE, and ARA reviewed the manuscript to ensure intellectual content and scientific integrity. All authors read and approved the final manuscript. Permission to publish the article was obtained from all authors.
| Variable | Numerator | Denominator |
|---|---|---|
| Proportion of PBC-TB index cases whose contacts were listed | Number of PBC-TB index cases whose contacts were listed | Total number of PBC-TB index cases diagnosed |
| Proportion of listed contacts screened for TB using GeneXpert | Number of contacts screened | Total number of contacts listed |
| Proportion of presumptive TB cases among the contacts | Number of presumptive TB cases identified | Total number of TB contacts screened |
| Proportion of presumptive contacts that were tested for TB | Number of presumptive contacts tested | Total number of presumptive contacts |
| Proportion of TB-positive contacts that were initiated on treatment | Number of TB-positive contacts initiated on treatment | Total number of TB contacts that tested positive |
| Proportion of contacts below 5 years that were initiated on TPT | Number of contacts below 5 years initiated on TPT | Total number of contacts below 5 years that were not positive for TB |
| Proportion of HIV-positive contacts that were initiated on TPT | Number of HIV-positive contacts initiated on TPT | Total number of HIV-positive contacts |
| Proportion of TB-positive contacts initiated on TB treatment who were cured | Number of TB-positive contacts on treatment who were cured | Total number of TB-positive contacts initiated on TB treatment |
| Variable | Cases (n=231) n (%) | 95% CI | Contacts (n=1215) n (%) | 95% CI |
|---|---|---|---|---|
| Age (years) | ||||
| <5 | 3 (1.3) | 0.4–3.7 | 169 (13.9) | 12.1–16.0 |
| 5–9 | 9 (3.9) | 2.1–7.2 | 175 (14.4) | 12.5–16.5 |
| 10–14 | 1 (0.4) | 0.1–2.4 | 163 (13.4) | 11.6–15.4 |
| 15–19 | 0 (0.0) | 0.0–1.6 | 136 (11.2) | 9.5–13.1 |
| ≥20 | 218 (94.4) | 90.6–96.7 | 570 (47.0) | 44.1–49.7 |
| Sex | ||||
| Male | 143 (62.0) | 55.5–67.9 | 562 (46.3) | 43.5–49.1 |
| Female | 88 (38.0) | 32.1–44.5 | 653 (53.7) | 50.9–56.5 |
| HIV status | ||||
| Positive | – | – | 12 (1.0) | 0.6–1.7 |
| Negative | – | – | 820 (67.5) | 64.8–70.1 |
| Unknown | – | – | 383 (31.5) | 29.0–34.2 |
| Hospital reported to | ||||
| Soroti RRH | 51 (22.0) | 17.2–27.9 | 368 (30.3) | 27.8–32.9 |
| Mbale RRH | 71 (30.7) | 25.1–37.0 | 359 (29.5) | 27.0–32.2 |
| Masaka RRH | 59 (25.5) | 20.3–31.5 | 291 (24.0) | 21.6–26.4 |
| Naguru RRH | 50 (21.7) | 16.8–27.4 | 197 (16.2) | 14.2–18.4 |
| Relationship to TB case | ||||
| Family member | – | – | 1176 (96.8) | 95.6–97.6 |
| Institution | – | – | 39 (3.2) | 2.4–4.4 |