Lessons from the field | Open Access | Volume 9 (Suppl 13): Article 03 | Published: 19 May 2026

Views: 442
Menu, Tables and Figures
| Variable | Frequency | Percentage (95% Confidence Interval) |
|---|---|---|
| Number of pilgrims interviewed per year | ||
| 2022 | 1350 | 35.0 (33.5-36.5) |
| 2023 | 375 | 9.7 (8.8-10.7) |
| 2024 | 683 | 17.7 (16.5-18.9) |
| 2025 | 1448 | 37.6 (36.0-39.1) |
| Sex | ||
| Male | 1755 | 45.5 (43.9-47.1) |
| Female | 2101 | 54.5 (52.9-56.1) |
| Age (years) | ||
| 18-24 | 1000 | 25.9 (24.6-27.3) |
| 25-49 | 1890 | 49.0 (47.4-50.6) |
| 50+ | 966 | 25.1 (23.7-26.4) |
| Country of residence | ||
| Uganda | 3780 | 98.0 (97.4-98.3) |
| Kenya | 45 | 1.2 (0.8-1.5) |
| Democratic Republic of Congo | 5 | 0.1 (0.0-0.2) |
| Tanzania | 7 | 0.2 (0.0-0.3) |
| Burundi | 2 | 0.05 (0.0-0.02) |
| Rwanda | 6 | 0.2 (0.0-0.3) |
| South Sudan | 6 | 0.2 (0.0-0.3) |
| Outside East Africa | 5 | 0.1 (0.0-0.2) |
Table 1: Sociodemographic characteristics of the participants


Alex Mulyowa1, Bernard Lubwama2, Simon Antara3, Elizabeth Kiracho Ekirapa1, Suzanne Namusoke Kiwanuka1
1Department of Health Policy, Planning and Management, School of Public Health, Makerere University, Kampala, Uganda, 2Division of Integrated Epidemiology and Surveillance, Ministry of Health, Kampala, Uganda, 3African Field Epidemiology Network, Kampala, Uganda
&Corresponding author: Alex Mulyowa, Department of Health Policy, Planning and Management, School of Public Health, Makerere University, Kampala, Uganda, Email: alexandermulyowa@gmail.com ORCID: https://orcid.org/0000-0003-3627-7637
Received: 02 Oct 2025, Accepted: 16 May 2026, Published: 19 May 2026
Domain: Field Epidemiology
Keywords: syndromic, surveillance, mass gathering, preparedness, Outbreak, religious, Uganda
©Alex Mulyowa et al. Journal of Interventional Epidemiology and Public Health (ISSN: 2664-2824). This is an Open Access article distributed under the terms of the Creative Commons Attribution International 4.0 License (https://creativecommons.org/licenses/by/4.0/), which permits unrestricted use, distribution, and reproduction in any medium, provided the original work is properly cited.
Cite this article: Alex Mulyowa et al. Trend of syndromes following implementation of syndromic surveillance in mass gatherings: A four-year analysis of Uganda Martyrs’ Day pilgrims 2022-2025. Journal of Interventional Epidemiology and Public Health. 2026; 9(Suppl 13):03. https://doi.org/10.37432/jieph-d-25-00219
Introduction: Uganda Martyrs’ Day celebrations annually attract more than two million people. Mass gatherings are associated with numerous public health risks, yet there is limited evidence to inform preparedness and response efforts. We describe trends in signs and symptoms and draw lessons for preparedness and response during mass gatherings.
Methods: We analyzed syndromic surveillance data for 2022-2025 using daily reports of symptoms to identify temporal trends and compare year-on-year symptom progression. Analysis was performed using STATA version 16 and Microsoft Excel.
Results: A total of 3,856 pilgrims were screened. More than half were female (n=2101, 54.5%), and 49% (n=1890) were 25-49 years. Fifty-five per cent (n=2,115) reported at least one sign and symptom. The most reported signs and symptoms were headache (36.4%, n=770), cough (21.4%, n=452), flu (15.9%, n=336) and fever above 37.5oC (12.7%, n=268). Symptoms peaked between 1st and 2nd June and declined by 3rd June. A comparison of trends between 2023 and 2025 revealed that in 2023, fever and acute watery diarrhoea increased more rapidly by the last day of the gathering, while declines were registered across other symptoms.
Conclusion: Across 2022-2025, headache, fever, cough, and flu-like symptoms were the most consistently reported syndromes, while severe symptoms such as unexplained bleeding were less common. The findings underscore the need for preparedness to manage commonly presenting symptoms. Syndromic surveillance may support early identification of unusual symptom patterns, which could signal potential outbreaks and may reduce the risk of escalation and spillover to the community.
Public health risks associated with mass gatherings encompass a variety of areas, from health-related hazards to infectious diseases [1]. For the World Health Organization (WHO), the major health risks are centred around respiratory, foodborne, and waterborne diseases, injuries, as well as antimicrobial-resistant infections [2, 3]. Disease spread is particularly amplified through overcrowding, inadequate water and sanitation facilities, temporary food vending, and limited access to timely healthcare services. Individuals with non-communicable diseases face an added risk of either worsening of their existing conditions or issues in accessing health facilities during such events [4]. Often, mass gatherings result in a heavy strain on healthcare systems due to a number of factors, such as increased influx of people, compounded by an overwhelming demand for health services [5]. The frequency of illness and injury at mass gatherings is believed to be higher than would occur naturally in a population of comparable size [6].
Mass gatherings include political events, religious events, sports events with varying public health risks based on the duration, infrastructure and demographics of the participants [7]. Religious pilgrimages, known for their dense crowds, deserve special focus considering the risks they pose and the potential strain they impose on healthcare [8]. They encompass a broad spectrum of individuals spanning across age categories and sometimes attract vulnerable individuals, such as the elderly, those suffering from chronic conditions and cross-border pilgrims. Evidence from previous studies has shown that countries that host regular religious mass gatherings have developed varying levels of preparedness and response to ensure safety during these events [9, 10]. Syndromic surveillance is recommended to enhance early detection of emerging health threats and facilitate early response [11]. In Southern India for example, between 2015 and 2018, syndromic surveillance was used to capture information on 17 syndromes from 61,523 pilgrims [6, 12], while in Europe, the Syndromic Surveillance Survey incorporated epidemiologic data algorithms to monitor acute health-related events [13].
The WHO 2005 International Health Regulations for public health planning surveillance, and response offers guidance for countries to prepare for mass gatherings [14]. Using risk assessments, they are required to develop, strengthen, and maintain the capacity of their health care systems to detect, assess, notify, and report risk events to international public health authorities [15]. However, although rigorous risk-assessment exercises are necessary to inform mitigation strategies against potential public health threats [2], evidence also suggests that the existing capacity to receive and analyze information remains inadequate [16].
On 3rd June, Uganda attracts numerous pilgrims both locally and internationally, for the annual Uganda Martyrs’ Day celebrations. This is the largest religious gathering in the country, attendance typically ranging from roughly two to four million pilgrims from every year, from within Uganda and beyond. Pilgrims start congregating as early as 25th May and depart from the celebration grounds after 3rd June. Pilgrims trek long distances, from different parts of the country, over many days on a journey of faith, prayer and thanksgiving. However, this journey also often comes along with associated health challenges. This gathering also attracts a spectrum of vendors hoping to benefit from the captive market offered by the pilgrims. This influx of large crowds imposes a burden on the limited infrastructure, increases public health risks and culminates into a consistent surge in the demand for public health services. To address these challenges, syndromic surveillance has been conducted annually during the event, primarily to detect and respond to potential public health threats in real-time. Despite its implementation yearly, there remains a paucity of literature on trends of syndromic surveillance data collected during this event, and how it has informed public health preparedness and response measures. We assessed the trends of signs and symptoms among pilgrims attending the annual Uganda Martyrs’ Day celebrations in Namugongo, for the period 2022-2025 to draw lessons for preparedness and response.
Study site
The annual Uganda Martyrs’ Day celebrations are primarily held at two sites in Namugongo; The Catholic site and the Anglican site. The two sites are approximately 3.2km apart. The celebrations usually span 7-10 days, with the catholic site attracting the largest number of pilgrims and vendors, which creates a significant risk for infectious disease transmission. Both sites have multiple access points requiring well-coordinated preparedness measures such as crowd control, water, sanitation and hygiene facilities and on-site medical support. To ensure sufficient on-site medical support, medical tents are set up at each site. Often, about eight medical tents are available, with physicians and nurses working in 12-hour shifts on a 24-hour basis. Mobile laboratories are also available to provide diagnostic testing for diseases such as malaria and typhoid. No inpatient services are offered within the tents. Critically ill patients are stabilised and transported in on-site ambulances to the central coordination health facility for further medical care.
Surveillance system description
An event-based surveillance system is implemented during the Uganda Martyrs’ Day celebrations annually. Surveillance activities are conducted through active syndromic surveillance among pilgrims, screening at points of entry and clinical surveillance within the onsite medical tents. The component of screening for infectious diseases at the major entrances for both sites was introduced in 2025, as an additional preparedness measure. An isolation unit was established in 2025, whereas it had not been available in previous years. Surveillance for diseases is intensified before and during the event at both sites, and coordination with a designated central coordination health facility ensures that critical cases and emergencies are effectively managed. The central coordination health facility also serves as a reference point for surveillance teams, enabling real-time detection and response to health threats throughout the event.
Study design
This was a retrospective analysis of syndromic surveillance data collected over four consecutive years (2022-2025).
Study population
These were all individuals attending the Uganda Martyrs’ Day celebrations, aged 18 years and above. Health workers, security personnel, service providers and religious leaders with identifiable name tags were excluded.
Sampling and data collection
Participants were recruited using an intercept sampling approach at different locations within the event sites, including walkways, resting areas and near medical tents. Individuals who were available at the time of data collection were invited to participate in a brief interview. Verbal informed consent was obtained prior to data collection. Although surveillance officers attempted to vary locations from where participants were recruited to ensure sufficient coverage, no formal sampling frame was available and this could have introduced selection bias.
Across the four years, ten surveillance officers were deployed annually. Data were collected using KoboCollect, a mobile-enabled data collection platform. Data were captured on pilgrims’ sociodemographic characteristics, self-reported signs and symptoms, and whether treatment services had been sought or received. Between 2022 and 2024, no minimum daily interview target had been defined per surveillance officer, resulting in relatively small sample sizes compared to the total pilgrim population. To improve data representativeness so as to allow for meaningful conclusions to be drawn, a structured target was set in 2025, whereby each surveillance officer interviewed an average of 20 pilgrims per day over seven days. In addition to the interviews, physical observations and temperature screening were conducted at the major entrances and within the medical tents to identify individuals with signs or symptoms suggestive of priority infectious diseases, including viral hemorrhagic fevers. Suspected cases were isolated, referred, or managed accordingly.
Syndrome definitions
Signs and symptoms investigated were based on suspect case definitions as per the 2021 National Technical Guidelines for Integrated Disease Surveillance and Response. Signs and symptoms under investigation were: fever (temperature >37.5°C), cough, flu-like symptoms, headache, body pains, generalized body weakness, breathing difficulties, acute watery diarrhoea, fainting or sudden collapse, and unexplained bleeding. Any other signs and symptoms reported by the participants were also recorded by the surveillance officers. Flu-like symptoms were defined as self-reported runny nose or sneezing, rather than a lab-confirmed influenza infection. Fluctuating fevers were defined as self-reported or measured body temperature that varied over time but remained above normal during the period of observation. Acute watery diarrhoea was defined as self-reported passage of three or more loose or watery stools within 24 hours, with symptom duration of less than 14 days and no visible blood. Unexplained bleeding was defined as any new onset of bleeding not attributable to a known injury, trauma, or pre-existing medical condition, including bleeding from the nose, gums, mouth, gastrointestinal tract, or blood in vomitus, urine, or stool. This syndrome was included to support early detection of potential viral haemorrhagic fevers.
Data management and analysis
Data collected were uploaded daily and reviewed for completeness. Data cleaning was performed prior to analysis. In 2022, symptom data was aggregated for the entire event period. In 2023, the tool was revised to introduce daily disaggregation of the surveillance data. However, in 2024, an earlier version of the tool was used following the identification of data quality issues in the 2023 version, along with delays in approving and uploading revised Kobo forms. Building on the lessons learned, a further revision in 2025 reintroduced daily disaggregation to allow for more meaningful interpretation of the syndromic trends.
Statistical analysis was performed using STATA version 16 (StataCorp; Texas, USA). Univariate analyses were performed to describe the participants’ sociodemographic characteristics and reported signs and symptoms. Findings were summarized using frequencies and proportions, along with their corresponding 95% confidence intervals, and then presented in the form of tables. Graphs were used to visualize the temporal trends in signs and symptoms reported. Graphs were generated using Microsoft Excel.
Ethical consideration
Approval was granted by the Higher Degrees Research and Ethics Committee of Makerere University School of Public Health (IRB No: SPH-2024-591). Verbal informed consent was obtained from all participants. No identifying information on the participants is presented. Data were collected in compliance with the Helsinki Declaration.
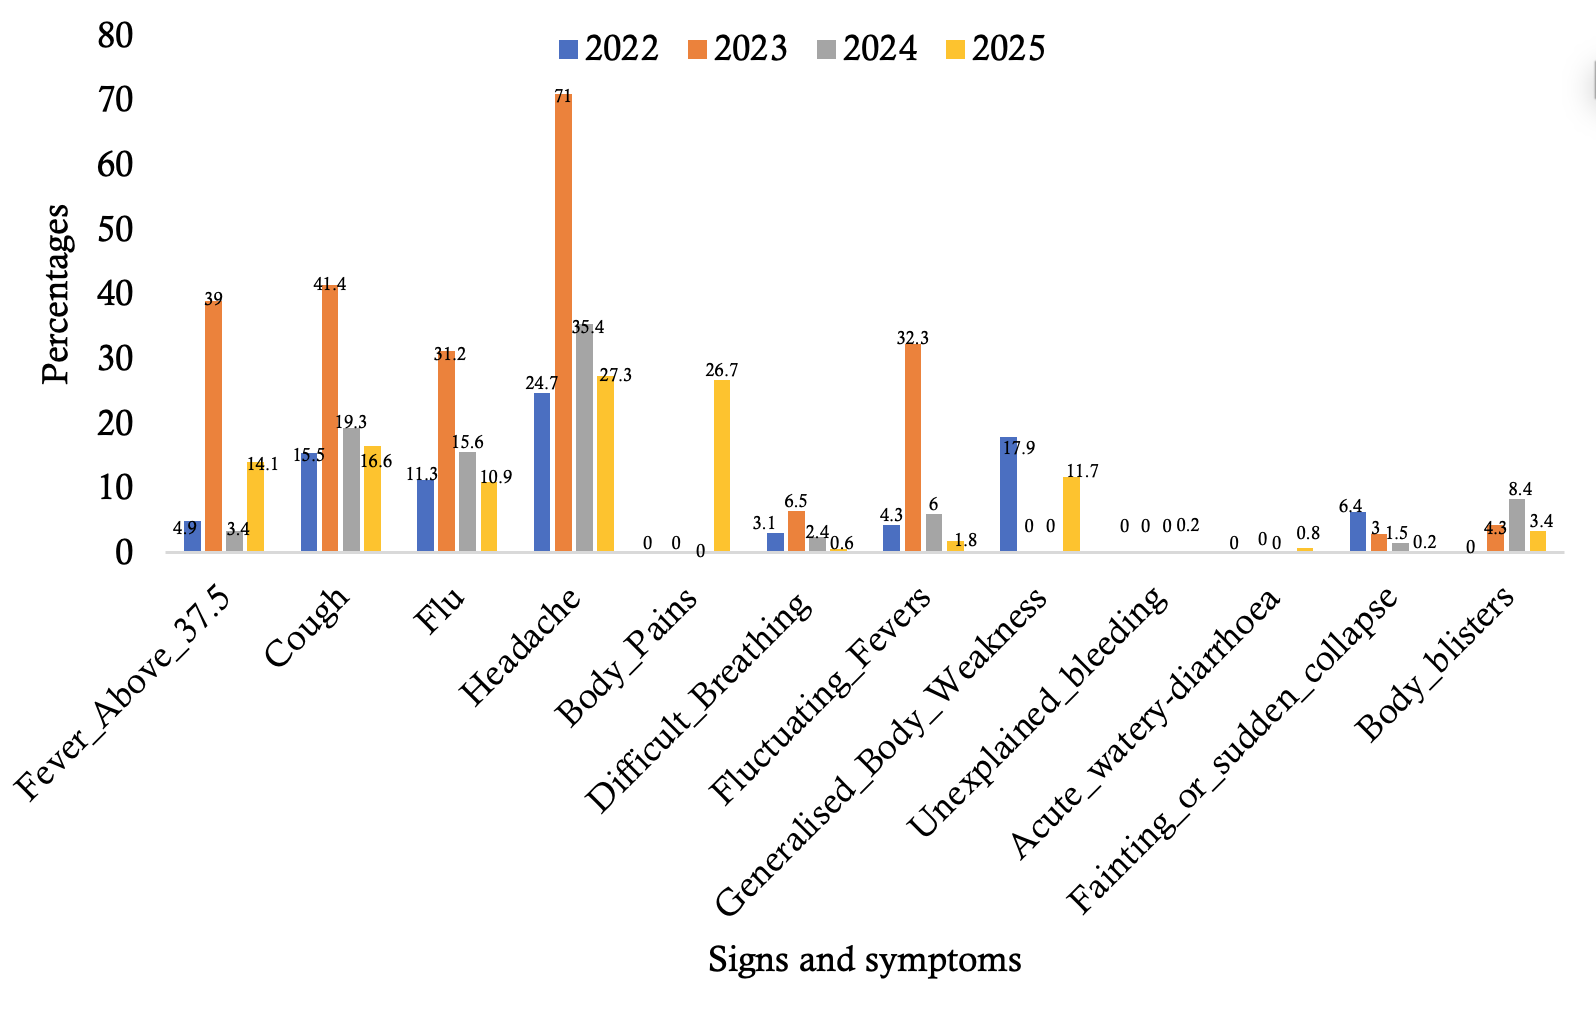
A total of 3,856 pilgrims were interviewed between 2022 and 2025. More than half were female (n=2101, 54.5%, 95% CI: 52.9-56.1), while about half were 25-49 years (n=1890, 49.0%, 95% CI: 47.4-50.6) (Table 1). Of the 3,856 pilgrims, 54.9% (95% CI: 53.2-56.4; n=2,115) reported experiencing at least one sign and symptom. Signs and symptoms across the 4 years were statistically different across male and female pilgrims (χ2 = 187.31, p<0.001). Across the years, headache, cough, flu-like symptoms and fever above 37.5°C were the most consistently reported symptoms among the pilgrims. Overall, 2023 was the year with the highest peaks recorded (Figure 1). About four-fifths (n=1737, 82.1%) of those who had experienced any signs and symptoms received treatment from the medical tents, while 8.3% (n=175) self-medicated.
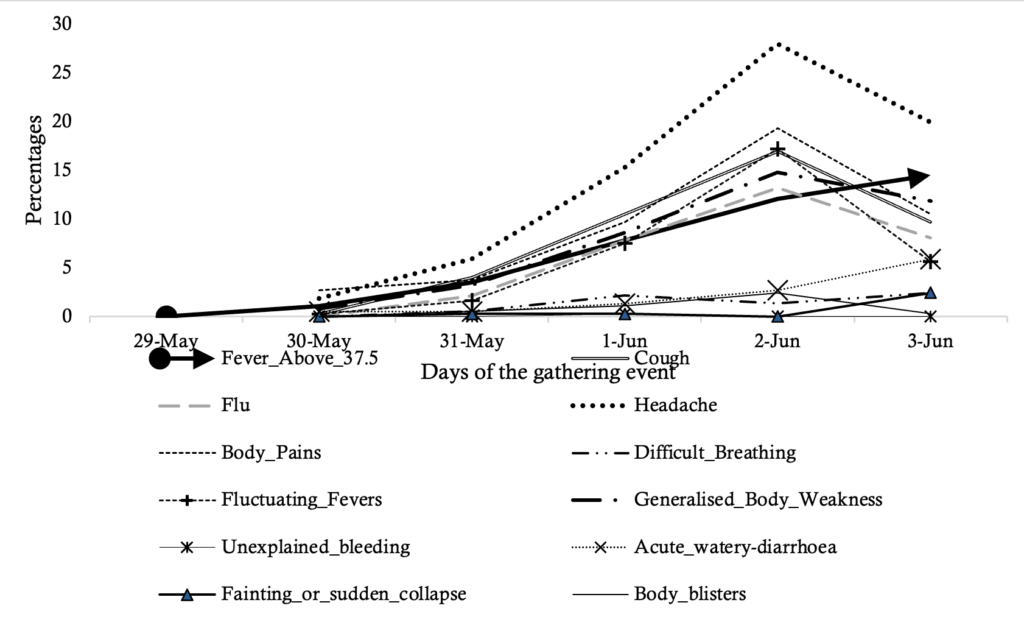
In 2023, most signs and symptoms were less than 10% between 29th June and 31st May, apart from headache, cough and flu. From 31st May to 2nd June, symptoms gradually increased, peaking on 2nd June when headache reached 28%, body pains 19.4%, cough 16.9%, and fever 12.1%, as generalised body weakness (14.8%) and fluctuating fevers (17.2%) also surged. Although a partial decline was observed on 3rd June, most symptoms remained at elevated levels. Important to note is that on 1st June, one case of bloody diarrhoea was recorded, while between 2nd and 3rd June, a 2.4% increase in fever above 37.5oC, and a 3.2% increase in acute watery diarrhoea were recorded as other symptoms were declining (Figure 2).
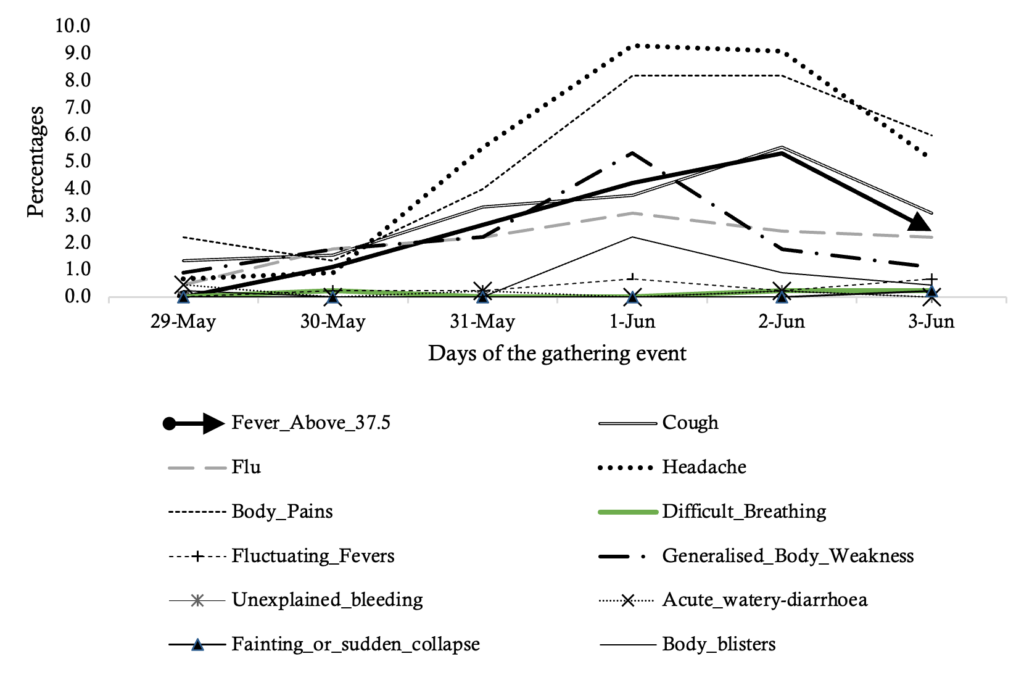
However, in 2025, although there were general registered increases in signs and symptoms, the increase was at much lower levels than in 2023, with an increase in the number of days at the event. By 1st – 2nd June 2025, symptoms had been plateauing at almost similar levels. Levels of acute watery diarrhoea were almost at zero (0) across the six days of surveillance, while reports of headache averaged at 9% and body pains at 8%. Fever increased from 4.2% to 5.3% while cough increased from 3.8% to 5.5% within the same period. On 3rd June, declines in reported signs and symptoms were registered in general (Figure 3).
The study found that common symptoms such as fever, headache, cough, flu and body pains were consistently reported across the four years, while severe symptoms such as unexplained bleeding were rare. Preparedness efforts should focus on addressing these predominant symptoms. Observable differences in symptom progression were noted between 2023 and 2025.
The predominance of respiratory illnesses in this study aligns with evidence generated from other mass gatherings globally, highlighting that respiratory tract infections are the most common, easily transmitted, and most likely to be spread widely [17, 18]. This is possibly due to overcrowding and/or close contact between pilgrims, or insufficient ventilation [19]. This finding underscores the importance of strengthening screening for infection and the provision of isolation infrastructure during mass gatherings. In response to these findings therefore, screening activities were strengthened at entry points, and isolation infrastructure was introduced in 2025 to allow rapid separation and management of suspected infectious cases.
Fever and body pains were also frequently reported. Although these symptoms can result from exhaustion as a result of travelling long distances, they can also indicate underlying infections such as malaria which is endemic in the area. Moreover, fevers especially above 37oC may indicate more severe underlying illnesses such as typhoid or worse still viral hemorrhagic fevers [20]. Indeed, our findings show that in 2023, while other symptoms were declining, fever and acute watery diarrhea increased by 3rd June – a sign of possible risk of infection which could spread to other areas if not managed. In mass gatherings, the risk of notifiable diseases increases the longer people gather in one place [3]. We posit therefore that fever detected during mass gatherings should always warrant further laboratory investigation, be managed and closely monitored [21, 22]. Altogether, our findings underscore the need for an epidemic preparedness plan that prioritizes surveillance and response to febrile illnesses in mass gathering settings, for strengthened outbreak detection.
Our analysis of symptoms as the days progressed shows symptom clustering, with a gradual rise in cases, peaking between 31st May and 2nd June, before declining towards the 3rd of June. This resonates with previous evidence, that symptom progression is typical of mass gatherings where prolonged contact, cumulative exposure and crowd density increase as attendance reaches its maximum [23, 24]. It is critical to highlight the recorded decline in symptoms across all conditions after 2nd June. However, for 2023, this decline was not noted for acute watery diarrhea and fever above 37.5oC indicating a window of greatest vulnerability when surveillance systems ought to be most vigilant to detect a potential outbreak. If undetected, this could result in a spillover of cases from the mass gathering to communities. Intuitively, post-event surveillance and monitoring could be done to detect, manage and respond to potential spillovers.
Finally, a comparison across two years (2023 and 2025) showed that 2023 exhibited a possible outbreak-like curve(s) as compared to 2025 whose symptomatic curves showed a flatter progression across days. For example, reported levels of acute watery diarrhea differed. While a marked increase could be observed in 2023 from 30th May to 3rd June, there were little-to-no reported cases in 2025 over a similar period. It is possible that in 2025, lessons had been learned from the previous two years and so, there were likely better preparedness and response measures put in place. For example, as compared to earlier years, handwashing stations were installed at different points such as eating places, medical tents and toilets, solid waste management practices were improved through provision of waste collection bins, and risk communication was conducted pre-and during the event. Therefore, the contrast between 2023 and 2025 reflects the effectiveness of preparedness interventions in mitigating public health risks, thus highlighting the importance of continuous investments in outbreak preparedness and response.
Our findings ought to be interpreted in light of some limitations and strengths. First, we were not able to track symptom progression across days for 2022 and 2024, given that the date variable had not been included in the respective datasets. However, we believe that the trend observed in 2023 and 2025 serves as a proxy for the symptomatic trends by days of progression in the missing years. Secondly, our analysis is based on data collected during the event, which limits our ability to track incubation periods based on reported signs and symptoms, or post-event disease spread. Thirdly, although we collected data on multiple symptoms, our data was aggregated at symptom level and therefore, we were not able to fully determine how many persons reported two or more symptoms, which would otherwise be important for surveillance case definitions. Additionally, given that we relied on self-reports, there could be a possibility of under-reporting or over-reporting of signs and symptoms. Finally, while pilgrims may have moved between sites, no formal tracking of cross-movement was conducted which may have limited the ability to fully account for repeated observations resulting in potential duplication. Nevertheless, a primary strength of our study is its large sample size, drawn from data collected over 4 years, which we believe improves the clarity of observed trends and patterns so as to make meaningful conclusions.
Across the four years of syndromic surveillance during the Uganda Martyrs’ Day celebrations, headache, fever, cough, flu were the most consistently reported symptoms among pilgrims, while severe symptoms were less common. The findings underscore the need for preparedness to handle commonly presenting symptoms. Preventive measures such as water, sanitation and proper food handling are a critical arm for preparedness during mass gatherings. Mass surveillance enables early identification of potential outbreaks and may reduce the risk of escalation and spillover to the community.
What is already known about the topic
What this study adds
We acknowledge the support of the Africa Field Epidemiology Network (AFENET). Special acknowledgement goes to all Field Epidemiology Training Program (FETP) residents of the 2022, 2023, 2024 and 2025 cohorts from Makerere University School of Public Health, who were the surveillance officers doing data collection in the respective years. We also thank all the pilgrims for their participation in the interviews.
| Variable | Frequency | Percentage (95% Confidence Interval) |
|---|---|---|
| Number of pilgrims interviewed per year | ||
| 2022 | 1350 | 35.0 (33.5-36.5) |
| 2023 | 375 | 9.7 (8.8-10.7) |
| 2024 | 683 | 17.7 (16.5-18.9) |
| 2025 | 1448 | 37.6 (36.0-39.1) |
| Sex | ||
| Male | 1755 | 45.5 (43.9-47.1) |
| Female | 2101 | 54.5 (52.9-56.1) |
| Age (years) | ||
| 18-24 | 1000 | 25.9 (24.6-27.3) |
| 25-49 | 1890 | 49.0 (47.4-50.6) |
| 50+ | 966 | 25.1 (23.7-26.4) |
| Country of residence | ||
| Uganda | 3780 | 98.0 (97.4-98.3) |
| Kenya | 45 | 1.2 (0.8-1.5) |
| Democratic Republic of Congo | 5 | 0.1 (0.0-0.2) |
| Tanzania | 7 | 0.2 (0.0-0.3) |
| Burundi | 2 | 0.05 (0.0-0.02) |
| Rwanda | 6 | 0.2 (0.0-0.3) |
| South Sudan | 6 | 0.2 (0.0-0.3) |
| Outside East Africa | 5 | 0.1 (0.0-0.2) |