Perspective | Open Access | Volume 9 (2): Article 55 | Published: 02 Apr 2026
Views: 33
Menu, Tables and Figures
| Table 1: Comparison Between Current PHEOC and PIU-Enabled Models | ||
|---|---|---|
| Dimension | Current PHEOC Model | PIU-Enabled Model |
| Operating Mode | Episodic activation during emergencies | Continuous analytical operation |
| Data Integration | Siloed (IDSR, eIDSR, DHIS2, labs) | Unified and interoperable dashboards |
| Core Outputs | Situation meetings and reports | Daily dashboards, weekly forecasts, monthly risk briefs |
| Exercises | Ad-hoc and donor-driven | Regular quarterly simulations with published After-Action Reviews |
| Accountability | Based on infrastructure counts | Based on response time, forecast accuracy, AAR closure |
| Financing | Donor or project based | Domestic non-emergency budget lines |
| Workforce | Temporary deployments | Permanent analytical staff with progression |
| Legal Framework | Variable; data-sharing informal or absent | Formal MOUs, data protection compliance, authority mandates |
Table 1: Comparison Between Current PHEOC and PIU-Enabled Models
Eric Nzirakaindi Ikoona1,&, Lucy Namulemo2, Ronald Kaluya3, Rebecca Ikoona4, Foday Sahr1
1National Public Health Agency, Freetown, Sierra Leone, 2Foothills Community-Based Interventions, Monticello, Kentucky, USA, 3Uganda Counselling and Support Services, Kampala, Uganda, 4Makerere University–Johns Hopkins Research Collaboration, Kampala, Uganda
&Corresponding author: Eric Nzirakaindi Ikoona, National Public Health Agency, Freetown, Sierra Leone, Email: ikoonae@yahoo.com, ORCID: https://orcid.org/0000-0003-3402-1961
Received: 02 Nov 2025, Accepted: 26 Mar 2026, Published: 02 Apr 2026
Domain: Health Security
Keywords: Preparedness, Public Health Emergency Operations Centre, Health Intelligence, Data Integration, Africa
©Eric Nzirakaindi Ikoona et al. Journal of Interventional Epidemiology and Public Health (ISSN: 2664-2824). This is an Open Access article distributed under the terms of the Creative Commons Attribution International 4.0 License (https://creativecommons.org/licenses/by/4.0/), which permits unrestricted use, distribution, and reproduction in any medium, provided the original work is properly cited.
Cite this article: Eric Nzirakaindi Ikoona et al., From rooms to intelligence: Reclaiming preparedness in Africa’s public health emergency operations centres. Journal of Interventional Epidemiology and Public Health. 2026; 9(1):55. https://doi.org/10.37432/jieph-d-25-00266
Most African Union Member States have established Public Health Emergency Operations Centre (PHEOC) facilities, yet only 29% meet World Health Organization (WHO) minimum functionality criteria—infrastructure exists, but intelligence does not. This gap matters because preparedness requires not only buildings and equipment but continuous analytic function: the capacity to translate surveillance signals into timely decisions every day, not only during declared emergencies.
This perspective proposes that African governments establish Preparedness Intelligence Units (PIUs)—dedicated four-person analytical teams working daily within PHEOCs. PIUs integrate data from electronic Integrated Disease Surveillance and Response (eIDSR) on District Health Information Software 2 (DHIS2), national laboratory networks, and climate systems to produce daily dashboards, weekly probabilistic forecasts, monthly risk briefs, and quarterly simulation reviews. Published country experiences and regional simulation findings suggest that performance gaps in detection, notification, and early-response timelines are measurable and addressable through standing analytic capacity, though a causal benefit of the PIU model has not yet been demonstrated, and prospective evaluation is required.
A minimum viable PIU can be established for an estimated United States Dollars (USD) 200,000–500,000 per year, depending on the country context—a planning estimate requiring validation in each setting. Success should be measured against three indicators: alert-to-response time (ART), forecast accuracy, and after-action review (AAR) closure rate. Governance prerequisites include inter-ministerial data-sharing agreements, role-based access controls, and clear retention and accountability rules.
We call on African governments to initiate PIU pilots at the national level and in 2–3 demonstration districts, supported by domestic budget lines and Africa Centres for Disease Control and Prevention (Africa CDC) and WHO technical assistance, with independent evaluation at 12 and 24 months. A PHEOC should not be a room waiting for a crisis; it should be a system producing intelligence continuously.
The paradox: Infrastructure without function
Nearly 80% of African Union Member States have established a designated Public Health Emergency Operations Centre (PHEOC) facility, yet only 29% meet World Health Organization (WHO) minimum functionality criteria [1,2]. These figures derive from WHO Joint External Evaluation missions, country self-assessments, and the WHO Strategic Plan assessment across 47 Member States conducted between 2016 and 2023 [2]. For context, the WHO framework defines full functionality as achieving ≥80% compliance across four core components: policies and legal authorisation, trained personnel with routine exercises, integrated information management, and interoperable communications infrastructure [2]. The gap between facility presence and functional compliance reflects not primarily a resource deficit but an operational one—a distinction the evidence below makes plain.
This hardware–software imbalance has measurable consequences. The WHO 7-1-7 target—detecting outbreaks within 7 days, notifying public health authorities within 1 day, and initiating defined early response actions within 7 days—provides a practical benchmark for timeliness and accountability [3]. Measuring these intervals routinely makes visible where systems lose time and why, particularly in translating surveillance signals into coordinated early action. The data reviewed below suggest that the bottleneck is not detection technology, but the standing analytic function needed to convert daily signals into decisions.
What regional evidence reveals
A 2022 regional functional simulation exercise involving 36 countries in the WHO African Region identified systemic gaps in legal frameworks, activation procedures, multisectoral coordination, and information sharing across national PHEOCs [4]. The findings are consistent with the WHO Strategic Plan assessment: half of established PHEOCs lack direct operational links to national surveillance systems [2]—a governance failure, not a technical one.
Africa’s surveillance architecture is extensive but fragmented. The Integrated Disease Surveillance and Response (IDSR) strategy, electronic Integrated Disease Surveillance and Response (eIDSR) on District Health Information Software 2 (DHIS2), national laboratory networks, and Civil Registration and Vital Statistics (CRVS) systems are deployed across the continent yet operate in institutional silos, limiting their combined value for routine risk assessment. Country experiences and multi-country analyses indicate what integration may enable, though none constitute controlled evidence of causal effect.
Multi-country applications of the 7-1-7 framework show that detection, notification, and early response timelines can be measured routinely and used to identify system bottlenecks [5]. In Liberia’s national implementation, median times across recorded public health events revealed that only 59% of events met the ≤7-day response target and 43% met all three 7-1-7 benchmarks, with response delays extending well beyond the target in a subset of events [6]. These figures illustrate where decision time is lost, not how much a given intervention would save. In Ethiopia, an analysis of cholera surveillance data integrated with climate variables identified lagged associations of up to three weeks between climate signals and cholera incidence, supporting the feasibility of multi-week early warning models to inform anticipatory action [7]. These country experiences are illustrative and not generalisable without further evidence; they nonetheless indicate the directional value of standing analytic capacity embedded in routine operations.
Taken together, this regional evidence points to a consistent structural gap: surveillance data exist, but the analytic layer to synthesise and act on them continuously does not. That is the gap the PIU is designed to fill.
The proposed solution: Continuous intelligence operations
Why a new unit is needed
Existing PHEOC structures typically include functional units for surveillance, operations, planning, and communications [2]. The WHO PHEOC framework also describes a Watch Mode of operations—continuous monitoring with structured risk outputs and scheduled decision meetings—as the standard posture between emergencies [2,8]. The Preparedness Intelligence Unit (PIU) is not an additional unit that replaces or duplicates these functions. Rather, it provides the synthesis layer that the Watch Mode requires but that most PHEOCs currently lack: a small, dedicated team that ingests signals from eIDSR on DHIS2, laboratory networks, climate feeds, and CRVS mortality data, and converts them into integrated forecasts and actionable risk products.
The limitation is not organisational architecture but operational mode: most PHEOCs activate their functional units episodically during declared emergencies and return to dormancy between crises [2,8]. The PIU addresses this directly. It differs from existing PHEOC units in three essential ways. First, its operational tempo: PIU staff work daily on preparedness analytics during non-emergency periods, producing routine intelligence products rather than waiting for activation. Second, its integration mandate: the PIU explicitly synthesises data across surveillance, laboratory, and environmental systems that typically exist in separate institutional silos, surfacing and resolving governance barriers during routine operations when deliberate problem-solving is feasible. Third, its forward-looking orientation: while traditional surveillance units primarily report what happened, PIUs produce probabilistic forecasts of what may occur over the coming weeks, enabling anticipatory rather than purely reactive action.
Team composition and reporting lines
Each PIU should comprise four core staff: an epidemiologist (PIU Lead), a data scientist, an operations planner, and a communications officer (full role profiles, standard operating procedures (SOPs), and watch-room interface protocols in Supplementary Material S1). The PIU Lead reports to the PHEOC Director during routine operations and provides structured risk assessments and operational recommendations through a weekly decision meeting chaired by the Director. During emergency activation, the Incident Manager retains full response decision authority; the PIU’s role shifts to providing analytic products and forecast updates to inform command decisions, without assuming operational control. Routine operational interfaces include district surveillance officers, rapid response team (RRT) leads, and national laboratory focal persons to ensure bidirectional data flow between field detection, laboratory confirmation, and central analysis.
Routine outputs and minimum viable operating package
Between emergencies, the PIU should produce four structured outputs: a daily integrated dashboard drawing on eIDSR on DHIS2, laboratory results, and climate signals; a weekly short-horizon probabilistic forecast (14- and 30-day); a monthly integrated risk brief; and quarterly simulations with After-Action Reviews (AARs) [2,4,8]. Technical specifications—including dashboard architecture, DHIS2 Application Programming Interface (API) integration patterns, data quality protocols, and forecast model workflows—are provided in Supplementary Material S2 (Technical Specifications). Table 1 summarises the operational contrast between the current PHEOC model and a PIU-enabled model. Note: the implementation roadmap is provided as Supplementary Material S5 (24-Month Implementation Roadmap).
To make pilot implementation concrete and comparable, we recommend a minimum viable operating package: (1) one integrated daily dashboard combining eIDSR on DHIS2, laboratory confirmation status, and climate indicators; (2) a weekly decision meeting chaired by the PHEOC Director recording risk level, priority actions, and activation triggers; and (3) an action tracker assigning each recommendation to a named owner with a deadline and verification date. Pilots should begin with two to three priority hazards (such as cholera or acute watery diarrhoea (AWD), measles, meningitis, or mpox) and expand only after data quality and response workflows have stabilised across the initial hazard portfolio. Supplementary Box S1 provides a completed illustrative weekly risk brief using synthetic data, demonstrating how these outputs translate signals into decisions.
Illustrative Scenario: How a PIU may change response timelines
The following scenario is hypothetical, intended to illustrate the mechanism rather than to claim a measured effect. Consider a district-level eIDSR alert for an unusual cluster of acute watery diarrhoea (AWD). Under the current episodic PHEOC model, such an alert may take several days to reach national attention, depending on reporting cycles, data validation delays, and the availability of coordination staff during non-emergency periods. Laboratory confirmation can add further delay. Published 7-1-7 field applications indicate that completion of defined early response actions frequently extends beyond the 7-day target—reflecting cumulative delays across reporting, verification, coordination, and confirmation steps [5,6]. Escalation from the first local signal to national-level coordination can exceed one week in a subset of events [5,6].
Under a PIU-enabled continuous intelligence model, the same eIDSR alert would appear on the PIU’s unified daily dashboard within 24 hours of entry. The PIU would triangulate the signal with laboratory confirmation status and contextual data already integrated into routine monitoring (for example, recent rainfall or water system disruptions identified through climate feeds). Within two to four days, the PIU could issue a preliminary risk assessment, recommend supply pre-positioning, and trigger a coordinated field investigation—potentially compressing the decision timeline compared with the episodic status quo. Climate–cholera evidence from Ethiopia illustrates how lagged associations between environmental signals and disease incidence can support multi-week early warning [7], lending plausibility to this anticipatory mechanism.
For fast-growing enteric outbreaks, even a modest compression of decision time can be operationally significant—the difference between a contained cluster and wider community spread. The scenario is not a quantified impact claim; it illustrates the mechanism by which routine integration, daily analytic review, and clear decision triggers may convert signals into earlier action. This logic is consistent with published 7-1-7 field applications and climate-linked surveillance evidence [5–7], but must be tested prospectively through structured PIU pilots.
Why this mechanism is plausible
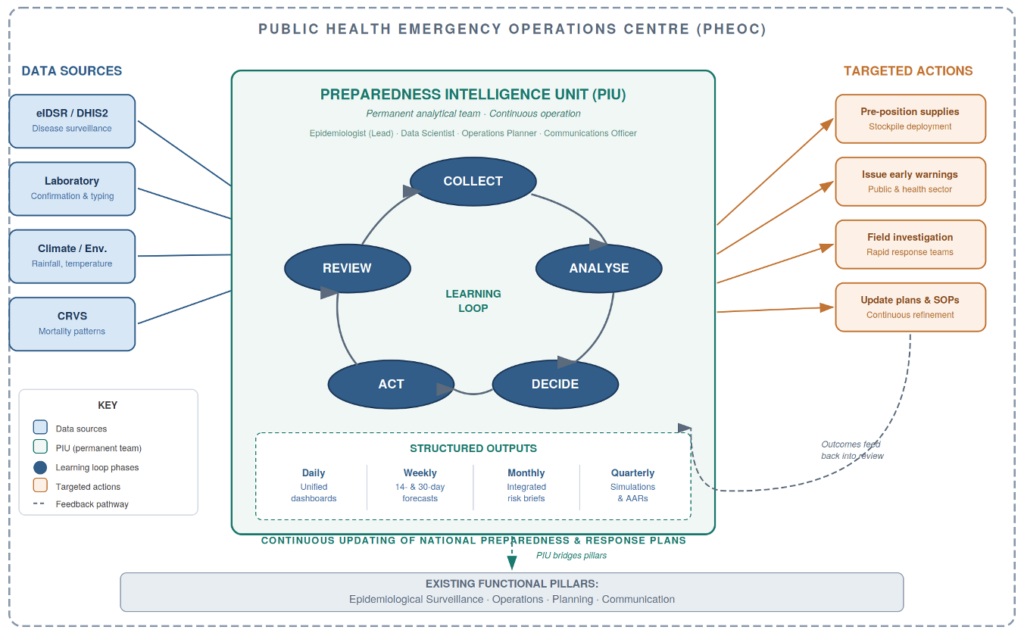
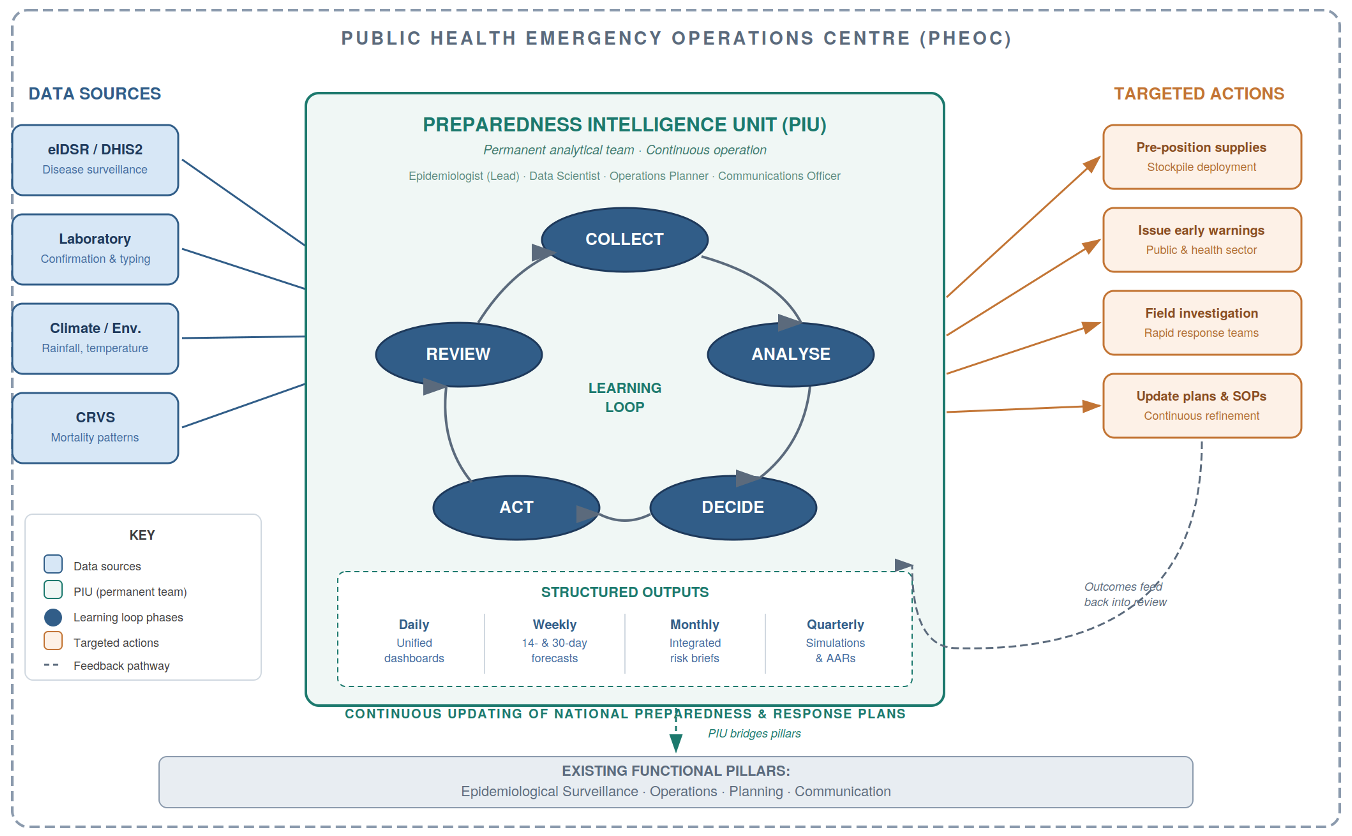
The case for PIUs rests on four interconnected mechanisms rather than on demonstrated causal impact. First, continuous daily operations sustain institutional readiness in ways that episodic activation cannot: high-reliability organisation theory and deliberate-practice research indicate that sustained, routine practice is what makes teams reliably responsive under crisis conditions [9,10]. Second, integrated governance addresses the interoperability barriers that cause most surveillance-to-action delays—specifically, the absence of legal frameworks, shared data standards, and cross-institutional workflows that currently prevent surveillance, laboratory, and environmental data from being used jointly in real time [2,10]. Third, probabilistic forecasting provides decision lead-time for anticipatory action, allowing supply pre-positioning and field team mobilisation before thresholds are crossed rather than after [7]. Fourth, quarterly simulation exercises with structured AARs institutionalise organisational learning: identified failures are documented, assigned, tracked, and verified, creating a measurable improvement loop [4,8]. Figure 1 illustrates how these four mechanisms operate together as a continuous learning cycle within the PHEOC.
These mechanisms are individually grounded in evidence from operations research and public health systems science. Their combined application to the PHEOC context is the testable proposal this perspective advances. The PIU model is presented as a reasoned, implementable, and evaluable intervention—not as a proven one.
Governance foundations
The operational logic of the PIU depends on data moving routinely across institutional boundaries, and this requires explicit legal authorisation. Without it, surveillance, laboratory, and climate data remain in silos regardless of technical capability. We therefore regard governance as a prerequisite, not an afterthought.
We recommend four governance foundations. First, inter-ministerial memoranda of understanding (MOUs) establishing lawful data sharing between the Ministry of Health, national laboratory authorities, national meteorological services, and civil registration agencies, signed before PIU operations begin (templates in Supplementary Material S3). Second, role-based access controls aligned with PIU functions, ensuring that personally identifiable information (PII) is accessible only to authorised epidemiologists for defined public health purposes, while aggregated data are available to data scientists, operations planners, and communications staff at appropriate levels [2]. Third, data retention and deletion rules specifying that operational identifiable data are purged once contact tracing is complete, with anonymised trend data retained for learning purposes. Fourth, a Data Governance Committee—chaired by the Director General of Health or designee, with quarterly meetings—to resolve integration disputes, approve new data streams, and verify compliance.
Countries that lack explicit national legislation authorising cross-institutional health data sharing for non-emergency preparedness purposes may require statutory amendments or ministerial regulations before the MOU alone can provide adequate legal authority. Supplementary Material S3 provides model legislative language and MOU templates adaptable to national legal frameworks. Integrated dashboards should display aggregated indicators by default; line-level data should be accessible only through role-restricted views subject to audit logging. These provisions protect individual privacy while enabling the routine cross-silo analysis on which the PIU depends.
Implementation pathway and costs
With governance frameworks in place, countries can sequence implementation realistically. A structured 24-month roadmap proceeds in three phases (detailed in Supplementary Material S5): Months 1–6 for governance frameworks, recruitment, and baseline measurement; Months 6–12 for a demonstration pilot in 2–3 well-resourced districts with intensive technical support; and Months 13–24 for national scale-up with independent performance evaluation at Month 24. Countries with established DHIS2 infrastructure and existing government salary structures are better positioned to begin and tend toward the lower bound of cost estimates.
PIU operating costs are estimated at USD 200,000–500,000 per year, depending on staffing configuration and technology architecture. This is a planning estimate based on comparable low- and middle-income country surveillance functions [12] and operational experience; it is not a formal economic analysis and should be validated through pre-implementation costing exercises in each setting. Major cost drivers are: (1) personnel composition and civil service salary scales (typically 50–60% of total costs); (2) choice between open-source and licensed analytic platforms (15–20%); (3) hosting, cybersecurity, and data protection infrastructure (within the data systems share); (4) connectivity redundancy in low-bandwidth settings (10–15%); and (5) scope and frequency of simulation exercises (10–15%). Detailed budget templates by country income level and financing transition strategies are provided in Supplementary Material S4. Africa has a growing analytical workforce through Field Epidemiology Training Programmes (FETPs) and the Africa CDC Public Health Emergency Management (PHEM) Fellowship, which are natural recruitment pipelines for PIU staffing.
Metrics for evaluation
Measuring PIU performance requires operationally defined indicators that PHEOC teams can collect routinely from existing systems. We recommend three indicators, each aligned with the 7-1-7 framework [3] and each defined precisely to enable consistent measurement across pilot sites.
Alert-to-response time (ART) is defined as the elapsed time from the eIDSR alert timestamp in DHIS2 to the first documented response action—RRT dispatch, public health advisory, supply activation, or field investigation start—as recorded in the incident log. ART should be reported as median with interquartile range (IQR), disaggregated by disease and district, and compared against a country-set operational target (a benchmark of ≤48 hours for priority diseases is suggested, pending baseline measurement to confirm feasibility). Forecast accuracy is assessed using Brier scores for probabilistic forecasts of defined threshold events at 14-day and 30-day horizons. The Brier score measures the mean squared difference between predicted probabilities and observed binary outcomes; lower scores indicate better calibration (scores below 0.25 are generally considered useful; scores above 0.50 indicate poor skill). This metric requires a defined forecast event (for example, cases exceeding a district threshold within the horizon), a recorded predicted probability, and a verified observed outcome. Full calculation methods, reporting templates (weekly risk brief, monthly dashboard report, and quarterly AAR brief), and a 24-month evaluation framework with design options are provided in Supplementary Material S6. AAR closure rate is the proportion of issues identified in exercises or activations that reach documented resolution with verification evidence within 90 days. A target of ≥70% closure by 90 days is recommended, with quarterly reporting and independent verification of completion evidence. Together, these three indicators provide a performance profile covering timeliness, analytic accuracy, and organisational learning—the three dimensions on which PIU effectiveness can be most directly assessed.
Implementation realities: Risks and constraints
The PIU model is technically and operationally feasible in many African settings, but implementation will face real and heterogeneous constraints that honest appraisal requires acknowledging.
Workforce retention is a primary risk: epidemiologists and data scientists with the skills required for a PIU are in demand from international organisations and the private sector, and civil service salary scales often cannot compete. Mitigation requires ministerial-level commitment to competitive remuneration and clear career pathways, not only initial recruitment. Connectivity and electricity in peripheral districts remain unreliable in many settings, constraining real-time DHIS2 integration and dashboard access; phased implementation beginning with well-resourced districts is a practical response, though it may delay national coverage. Data quality across surveillance platforms is variable: incomplete reporting, inconsistent case definitions, and poor laboratory linkage will undermine forecast accuracy and dashboard utility unless addressed through sustained quality improvement cycles from the outset. Donor dependence for recurrent costs presents a structural sustainability risk: the PIU’s value rests on continuous operation, and any financing gap disrupts the learning cycle. Ministerial-level commitment to domestic budget lines—established during the pilot phase, not deferred to scale-up—is therefore a prerequisite, not an optional aspiration. Legal and political barriers to inter-ministerial data sharing are common: in many countries, surveillance, laboratory, and meteorological data are held by agencies with competing institutional interests, and without high-level endorsement and clear legal frameworks, the governance prerequisites described above will not be met. Finally, contextual heterogeneity across Africa’s 55 Member States is substantial: PHEOC maturity, DHIS2 coverage, laboratory integration, workforce availability, and political economy vary enormously. The PIU model as described here is a template requiring adaptation; fragile, post-conflict, and highly decentralised settings face additional barriers not fully addressed in this perspective. Risk mitigation strategies by implementation phase are detailed in Supplementary Material S5.
A call for country leadership with regional support
Africa faces converging health security threats: cholera incidence driven by climate change and rapid urbanisation, mpox transitioning toward endemic circulation, and climate-driven expansion of vector habitats across the continent [8]. The necessary PHEOC infrastructure exists. A trained analytical workforce is growing through FETPs and the Africa CDC PHEM Fellowship. Surveillance technology is deployed. What remains is political commitment to operationalise preparedness systems continuously rather than episodically—treating intelligence as a standing function rather than an emergency addition.
We call on African governments to take ownership of PIU establishment as a strategic national priority. Countries with established PHEOCs and functional DHIS2 platforms should initiate pilot implementation in 2–3 demonstration districts, allocating domestic budget lines for PIU operations and establishing the legal frameworks for cross-institutional data integration before pilot launch. We call on Africa CDC and WHO to support countries by developing standardised technical guidelines, coordinating cross-country learning platforms, providing technical assistance for dashboard development and forecast modelling, and facilitating rigorous third-party evaluation across multiple pilot sites over 24 months. Development partners should support the transition to domestic financing rather than institutionalising donor dependence for recurrent costs.
The 7-1-7 framework provides the benchmark [3]. Success must be measured by operational outcomes: hours saved between alert and intervention, outbreaks detected and contained before amplification, and institutional capacity for evidence-informed decisions strengthened through systematic learning cycles [4,8,9]. A PHEOC should not be a facility waiting for a crisis. It should be a system producing forecasts daily, learning from exercises quarterly, and informing national preparedness policy continuously. The question is not whether to build intelligence capacity but how quickly governments commit to moving from rooms to intelligence. Detailed implementation guidance to support that commitment is provided in six supplementary materials: S1 (staffing, role profiles, and SOPs), S2 (technical specifications for dashboards, data integration, and forecasting), S3 (governance and legal frameworks, including MOU templates and model legislative language), S4 (budget templates, cost drivers, and financing transition pathways), S5 (24-month implementation roadmap with phase gates), and S6 (performance monitoring, metrics definitions, reporting templates, and evaluation framework).
Limitations
This perspective draws on published secondary evidence, regional simulation programme data, and operational experience; no primary data were collected. The PIU model has not been prospectively evaluated: the benefits described rest on mechanistic reasoning, feasibility evidence, and analogous systems evidence, not on controlled experiments or pre-post field studies. The evidence base is drawn from a limited set of published country experiences, principally Liberia and Ethiopia, which are not representative of all African contexts. Africa’s 55 Member States span wide variation in PHEOC maturity, DHIS2 coverage and data quality, laboratory integration, analytical workforce availability, and political economy; the model will require contextual adaptation in every setting, and fragile, post-conflict, and highly decentralised environments face barriers not fully addressed here. The cost estimate (USD 200,000–500,000 per year) is a planning figure based on comparable low- and middle-income country surveillance functions and operational experience; it is not a formal health economic analysis, and its range does not capture all cost drivers or country-specific variables. It should be validated through pre-implementation costing in each pilot setting. We call for structured prospective evaluation across diverse settings as the essential next step, with pre-pilot baseline measurement, standardised implementation monitoring, and independent evaluation at 12 and 24 months.
What is already known about the topic
What this perspective adds
The authors thank staff of national Public Health Emergency Operations Centres, field epidemiology networks, and regional partners of Africa CDC for sharing operational experiences that informed this perspective and implementation guidance. No external funding was received for this work; there was no funder role in conceptualisation, drafting, or the decision to submit.
List of Abbreviations
AAR: After-Action Review
Africa CDC: Africa Centres for Disease Control and Prevention
API: Application Programming Interface
ART: Alert-to-Response Time
AWD: Acute Watery Diarrhoea
CRVS: Civil Registration and Vital Statistics
DHIS2: District Health Information Software 2
eIDSR: Electronic Integrated Disease Surveillance and Response
FETP: Field Epidemiology Training Programme
IDSR: Integrated Disease Surveillance and Response
IQR: Interquartile Range
MOU: Memorandum of Understanding
PHEM: Public Health Emergency Management
PHEOC: Public Health Emergency Operations Centre
PIU: Preparedness Intelligence Unit
PII: Personally Identifiable Information
RRT: Rapid Response Team
SOP: Standard Operating Procedure
USD: United States Dollars
WHO: World Health Organization
7-1-7: Detect within 7 days, notify within 1 day, initiate early response within 7 days
The first author led the conceptualisation and drafting. The remaining authors contributed operational inputs and critical revisions. All authors reviewed and approved the final manuscript.
Supplementary Files
Supplementary Material S1: Staffing Operations (1 downloads)
Supplementary Material S2: Technical Specifications (2 downloads)
Supplementary Material S3: Governance Legal Frameworks (1 downloads)
Supplementary Material S4: Budget Financing (1 downloads)
Supplementary Material S5: Implementation Roadmap (1 downloads)
Supplementary Material S6: Performance Monitoring (1 downloads)
Supplementary Material BoxS1: Weekly PIU Risk Brief (1 downloads)
| Table 1: Comparison Between Current PHEOC and PIU-Enabled Models | ||
|---|---|---|
| Dimension | Current PHEOC Model | PIU-Enabled Model |
| Operating Mode | Episodic activation during emergencies | Continuous analytical operation |
| Data Integration | Siloed (IDSR, eIDSR, DHIS2, labs) | Unified and interoperable dashboards |
| Core Outputs | Situation meetings and reports | Daily dashboards, weekly forecasts, monthly risk briefs |
| Exercises | Ad-hoc and donor-driven | Regular quarterly simulations with published After-Action Reviews |
| Accountability | Based on infrastructure counts | Based on response time, forecast accuracy, AAR closure |
| Financing | Donor or project based | Domestic non-emergency budget lines |
| Workforce | Temporary deployments | Permanent analytical staff with progression |
| Legal Framework | Variable; data-sharing informal or absent | Formal MOUs, data protection compliance, authority mandates |