Research | Open Access | Volume 9 (1): Article 37 | Published: 04 Mar 2026
Views: 46
Menu, Tables and Figures
| Category | Cases | % |
|---|---|---|
| Sex | ||
| Female | 2,550,575 | 56 |
| Male | 1,999,618 | 44 |
| Age Group | ||
| <5 years | 1,452,027 | 32 |
| ≥5 years | 3,098,166 | 68 |
| Etiology | ||
| Allergic | 2,162,186 | 48 |
| Infectious | 2,077,750 | 46 |
| Other forms | 310,257 | 7 |
| Total | 4,550,193 | 100 |
Table 1: Distribution of conjunctivitis cases by sex, age group, and etiology, Uganda, 2020–2023
| Region | Allergic Incidence per 1,000 | Infectious (Bacterial) Incidence per 1,000 | Other forms Incidence per 1,000 | |||
|---|---|---|---|---|---|---|
| Female | Male | Female | Male | Female | Male | |
| Acholi | 13 | 9 | 18 | 14 | 2 | 1 |
| Ankole | 12 | 8 | 11 | 9 | 1 | 1 |
| Bugisu | 14 | 10 | 13 | 10 | 2 | 1 |
| Bukedi | 9 | 6 | 14 | 13 | 1 | 1 |
| Bunyoro | 6 | 10 | 11 | 8 | 1 | 1 |
| Busoga | 7 | 4 | 8 | 7 | 1 | 1 |
| Kampala | 22 | 19 | 10 | 10 | 4 | 4 |
| Karamoja | 11 | 8 | 28 | 22 | 1 | 1 |
| Kigezi | 19 | 12 | 18 | 14 | 2 | 1 |
| Lango | 10 | 14 | 11 | 9 | 1 | 1 |
| North Buganda | 7 | 5 | 8 | 7 | 1 | 1 |
| South Buganda | 6 | 5 | 7 | 7 | 1 | 1 |
| Teso | 8 | 5 | 11 | 8 | 2 | 1 |
| Tooro | 9 | 6 | 10 | 7 | 1 | 1 |
| West Nile | 17 | 14 | 19 | 16 | 2 | 2 |
Incidence per 1,000 population calculated using projected gender-specific regional population denominators. Etiological classification based on routine clinical diagnosis in DHIS2; bacterial conjunctivitis is categorized as infectious. Values are mean annual rates for 2020–2023.
Table 2: Mean Annual Incidence of Conjunctivitis by Region, Aetiology, and Gender (per 1,000 population), Uganda, 2020–2023
| Region | Allergic | Infectious | Other Forms | |||
|---|---|---|---|---|---|---|
| <5 yrs | ≥5 yrs | <5 yrs | ≥5 yrs | <5 yrs | ≥5 yrs | |
| Acholi | 59 | 30 | 151 | 63 | 10 | 4 |
| Bugisu | 66 | 33 | 80 | 48 | 9 | 4 |
| Ankole | 39 | 30 | 55 | 33 | 4 | 3 |
| Bukedi | 43 | 19 | 74 | 37 | 7 | 4 |
| Bunyoro | 23 | 29 | 60 | 28 | 6 | 2 |
| Busoga | 29 | 16 | 41 | 24 | 6 | 3 |
| Kampala | 76 | 55 | 45 | 43 | 17 | 12 |
| Karamoja | 65 | 24 | 380 | 92 | 11 | 3 |
| Kigezi | 61 | 46 | 136 | 62 | 8 | 4 |
| Lango | 150 | 22 | 66 | 29 | 5 | 2 |
| North Buganda | 24 | 17 | 33 | 28 | 6 | 3 |
| South Buganda | 23 | 16 | 28 | 28 | 4 | 2 |
| Teso | 32 | 18 | 59 | 31 | 9 | 4 |
| Tooro | 37 | 21 | 54 | 25 | 7 | 3 |
| West Nile | 73 | 40 | 131 | 78 | 11 | 6 |
Incidence calculated per 1,000 population. Age-specific population denominators were estimated assuming children <5 years constitute 15% and individuals ≥5 years constitute 85% of the regional population.
Table 3: Incidence of Conjunctivitis by Region, Aetiology, and Age group (per 1,000 population), Uganda, 2020–2023


Gertrude Abbo1,&, Richard Migisha1, Benon Kwesiga1, Patricia Eyu1, Hilda Tendo Nansikombi1, Lilian Bulage1, Alex Riolexus Ario1
1Uganda National Institute of Public Health, Uganda Public Health fellowship program, Kampala, Uganda
&Corresponding author: Gertrude Abbo, Uganda National Institute of Public Health, Uganda Public Health fellowship program, Kampala, Uganda Email: abbog@uniph.go.ug ORCID: https://orcid.org/0009-0007-9072-5783
Received: 17 Nov 2025, Accepted: 01 Mar 2026, Published: 04 Mar 2026
Domain: Infectious Disease Epidemiology
Keywords: Conjunctivitis, Incidence, spatial trends, temporal patterns
©Gertrude Abbo et al. Journal of Interventional Epidemiology and Public Health (ISSN: 2664-2824). This is an Open Access article distributed under the terms of the Creative Commons Attribution International 4.0 License (https://creativecommons.org/licenses/by/4.0/), which permits unrestricted use, distribution, and reproduction in any medium, provided the original work is properly cited.
Cite this article: Gertrude Abbo et al. Spatial and temporal trends of conjunctivitis in Uganda, 2020–2023: A nationwide surveillance analysis. Journal of Interventional Epidemiology and Public Health. 2026; 9(1):37. https://doi.org/10.37432/jieph-d-25-00285
Introduction: Conjunctivitis is a common ocular condition with multiple infectious and non-infectious causes and remains an important public health concern in low-resource settings. However, national data on temporal and spatial trends of conjunctivitis in Uganda are limited. This study described the epidemiology, temporal trends, and spatial distribution of conjunctivitis in Uganda from 2020 to 2023 to inform prevention and control strategies.
Methods: We conducted a descriptive cross-sectional analysis of routine conjunctivitis surveillance data reported through the District Health Information Software version 2 (DHIS2) from January 2020 to December 2023. Cases were classified as allergic, infectious, or other forms based on clinical diagnosis. Incidence rates were calculated per 1,000 population using projected population denominators disaggregated by sex, region, and year. Age-specific incidence was estimated using national demographic proportions (<5 years: 15%; ≥5 years: 85%). Temporal trends were assessed using monthly and quarterly incidence, with significance tested using the Mann–Kendall trend test. Spatial distribution was analyzed at the district level using QGIS.
Results: A total of 4,550,193 conjunctivitis cases were reported nationally; females accounted for 2,548,108 (56%), and children under five years contributed 1,456,062 (32%). Allergic conjunctivitis comprised the highest proportion of cases, 2,184,092 (48%). Mean annual incidence was highest for infectious conjunctivitis, particularly in Karamoja, West Nile, Kigezi, and Acholi. Children under five experienced markedly higher incidence across all etiologies, especially reaching 380 per 1,000 population in Karamoja. Allergic conjunctivitis showed a significant increasing temporal trend (p = 0.004), while infectious conjunctivitis remained stable with recurrent outbreak peaks. Spatial analysis revealed expanding allergic conjunctivitis burden in central and western Uganda, and persistent infectious conjunctivitis hotspots in northern and northeastern regions.
Conclusion: Conjunctivitis remains a substantial public health burden in Uganda, with distinct patterns by aetiology, age group, sex, and geography. The rising trend of allergic conjunctivitis and persistent infectious conjunctivitis hotspots among young children highlights the need for strengthened surveillance, targeted WASH interventions, environmental health strategies, and early outbreak detection, particularly in high-risk and densely populated settings.
Conjunctivitis is a common eye condition affecting individuals across all age groups and socioeconomic strata worldwide, with a global prevalence of approximately 2% among the general population [1]. It may be caused by a range of viral or bacterial pathogens, as well as non-infectious triggers such as allergens or irritants [2]. Although more frequently observed in children, conjunctivitis can occur at any age. Allergic conjunctivitis, in particular, is prevalent among children and is often triggered by exposure to allergens such as pollen, dust, or pet dander, leading to symptoms including eye redness, itching, and tearing [3]. The incubation period varies by aetiology: viral conjunctivitis typically presents within 12 hours to 7 days following exposure, bacterial conjunctivitis within 1 to 3 days, and allergic conjunctivitis within minutes to a few hours after contact with allergens [4]. Bacterial conjunctivitis is common worldwide. The incidence of bacterial conjunctivitis is estimated at 5 to 6 million cases per year for clinically diagnosed conjunctivitis; however, it is likely underreported due to self-medication and mild symptoms [5].
In Sub-Saharan Africa, conjunctivitis affects an estimated 30 million people annually [6]. If left untreated, it can lead to serious complications such as keratitis and corneal ulceration, potentially resulting in visual impairment or blindness [7]. Despite its widespread occurrence, there is limited research on the prevalence and risk factors of bacterial conjunctivitis in the region [6]. Certain areas in Africa have been identified as hotspots with particularly high prevalence rates [8].
In Uganda, an outbreak of bacterial conjunctivitis was reported among prisoners in 2017 in Gulu District by the Ministry of Health [6]. Outbreaks of conjunctivitis have previously been reported in Uganda, particularly within institutional settings such as schools and prisons. On March 7, 2024, the Ministry of Health issued a public health alert following reports of widespread conjunctivitis affecting multiple schools and correctional facilities in Kampala District [9]. By March 13, over 950 cases had been confirmed, including outbreaks in at least eight prisons across the country. These events underscore the vulnerability of congregate settings to rapid transmission of infectious conjunctivitis [10]. Notably, a recent outbreak among prisoners in Luzira Prisons from February to April 2024 was attributed to Enterovirus Type C [11]. These recurring outbreaks highlight the need for enhanced surveillance, early detection, and targeted prevention strategies in high-density institutional environments. However, the trends and distribution of conjunctivitis in Uganda have not been well documented. Before 2020, no data were reported on conjunctivitis, and there were limited published studies in our setting on this. We established the spatial and temporal trends of conjunctivitis, Uganda, 2020–2023, to inform control and prevention interventions.
Study setting
We utilized conjunctivitis surveillance data generated from all health care facilities in Uganda. Uganda is divided into 15 geographical health regions (North Central, Tooro, South Central, Acholi, Lango, Karamoja, Kigezi, Teso, Bugisu, Bukedi, Busoga, Bunyoro, Kampala City, Ankole, and West Nile), which are further subdivided into 146 districts. Uganda has 155 hospitals, of which two are National Referral Hospitals (NRHs), 14 are Regional Referral Hospitals (RRHs), and 139 are General Hospitals (GHs). Beginning in 2020, conjunctivitis was reported to the Ministry of Health in Uganda as a count of the number of cases per month from each of the health facilities in the 15 administrative health regions of the country. Primary Health Care Facilities, particularly Health Center (HC) II (parish level) and HC IIIs (sub-county level), can diagnose common forms of conjunctivitis based on clinical signs and symptoms, such as redness, discharge, and eye irritation. Treatment typically includes topical antibiotics like tetracycline or chloramphenicol ointments, as recommended by the Ministry of Health’s eye care guidelines [12]. On the other hand, higher-level facilities such as the HC IV (county level), general hospitals, and regional referral hospitals may have better-equipped outpatient eye clinics and access to ophthalmic clinical officers or ophthalmologists. They can manage more severe or complicated cases and may perform additional diagnostic tests if necessary.
Study design and data source
We conducted a descriptive cross-sectional analysis of conjunctivitis surveillance data reported through the electronic District Health Information Software version 2 (DHIS2) during 2020–2023. Data were extracted from DHIS2 from January 2020 to December 2023. Conjunctivitis data are routinely generated at registered health facilities (all public health facilities plus most private health facilities). Each health facility uses a standardized form to record the number of conjunctivitis cases. The conjunctivitis cases are disaggregated as allergic, bacterial, and other forms of conjunctivitis.
We defined allergic conjunctivitis as clinically diagnosed conjunctival inflammation characterized by itching, redness, and tearing, in the absence of purulent discharge, and commonly associated with exposure to environmental allergens such as dust, pollen, or smoke.
Infectious conjunctivitis was defined as clinically diagnosed conjunctivitis presenting with purulent or mucopurulent discharge, eyelid matting, conjunctival hyperemia, and other features suggestive of bacterial infection; because laboratory confirmation is not routinely available at lower-level health facilities, classification was based on clinical diagnosis, and cases recorded as bacterial conjunctivitis in DHIS2 were considered infectious conjunctivitis for analysis.
Other forms of conjunctivitis cases were considered as cases that did not meet the clinical criteria for allergic or infectious conjunctivitis, including irritant-related, traumatic, or unspecified conjunctivitis, as classified by the reporting clinician.
The monthly data are aggregated at the district level and then forwarded to the national database. The data are then utilised by authorised Ministry of Health officials and other stakeholders for analysis to obtain meaningful information.
Study procedures, eligibility criteria, and sample size estimations
The study included all conjunctivitis cases reported through routine DHIS surveillance from all health facilities in Uganda during 2020-2023. Sample size was determined by all cases reported during the study period; no prior sample size estimation was required.
Study variables, data abstraction, and analysis
We abstracted data using pivot tables in DHIS2 on conjunctivitis from January 2020 to December 2023. The data from DHIS2 were downloaded, merged, and summarised in Microsoft Excel sheets. We calculated the overall incidence of conjunctivitis by sex, age group, year, and district. Incidence was calculated by dividing the total number of conjunctivitis cases by the total populations at risk in the respective subpopulation categories per 1,000 population.
We abstracted data on reporting rates to assess the completeness and consistency of surveillance during the data collection period. We assessed reporting completeness and included all available records; missing monthly reports were treated as zero or excluded depending on reporting consistency. We drew line graphs to demonstrate the incidence per 10,000 population over time.
To assess the potential seasonal pattern in the incidence of conjunctivitis in Uganda, we analyzed and plotted quarterly incidence trends over the study period. We used QGIS software to generate maps illustrating the spatial distribution of conjunctivitis cases over the four years. Data was imported into the R software for analysis to determine the significance of the trends using the Mann-Kendall test for trends.
Age-disaggregated population estimates at the regional level were not available for the study period. Therefore, to compute age-specific incidence rates, we estimated age-group population denominators using national demographic proportions. Children aged under five years were assumed to constitute 15% of the total regional population, while individuals aged five years and above were assumed to comprise 85% [13], in line with Uganda’s population age structure reported in national demographic profiles. Mean regional population estimates for 2020–2023 were calculated using projected annual population figures, and these proportions were applied to derive age-specific population denominators. Incidence rates were then calculated by dividing age-specific case counts by the estimated age-specific population and expressed per 1,000 population.
Distribution of conjunctivitis cases by sex, age group and aetiology
Overall, the country reported a total of 4,550,193 cases of conjunctivitis. Females accounted for a slightly higher proportion of the cases (56%), while children under five years contributed 32% of all the cases. Concerning aetiology, allergic conjunctivitis was the most commonly reported form, comprising nearly half of all the cases (48%), followed by bacterial conjunctivitis at 46%. The other forms of conjunctivitis were less frequent, accounting for 7% of the case burden (Table 1)
Mean annual incidence of conjunctivitis by region, etiology, and gender (per 1,000 population), Uganda, 2020–2023
Across all regions, infectious conjunctivitis had the highest incidence compared with allergic conjunctivitis and other forms (Table 2a). The highest infectious conjunctivitis incidence was observed in Karamoja (28 per 1,000 among females and 22 per 1,000 among males), followed by West Nile (19 and 16 per 1,000), Kigezi (18 and 14 per 1,000), and Acholi (18 and 14 per 1,000) (Table 2).
For allergic conjunctivitis, incidence was generally higher among females than males in most regions, with the highest female incidence in Kampala (22 per 1,000), followed by Kigezi (19 per 1,000) and West Nile (17 per 1,000) (Table 2a). Male incidence was also highest in Kampala (19 per 1,000) and West Nile (14 per 1,000). Lango and Bunyoro were exceptions, where male incidence exceeded female incidence.
Other forms of conjunctivitis contributed minimally to overall incidence, with most regions reporting approximately 1 per 1,000 population, except Kampala (4 per 1,000) and West Nile, Bugisu, Kigezi, and Teso (2 per 1,000) (Table 2).
Incidence of conjunctivitis by region, aetiology, and age group (per 1,000 population), Uganda, 2020–2023
Children under five years consistently experienced a higher incidence than individuals aged ≥5 years across all aetiologies (Table 3). This disparity was most pronounced for infectious conjunctivitis, particularly in Karamoja (380 vs. 92 per 1,000), and was also high in Acholi (151 per 1,000), West Nile (131 per 1,000), and Kigezi (136 per 1,000) among under-fives (Table 3).
For allergic conjunctivitis, the highest incidence among children under five occurred in Lango (150 per 1,000), followed by Kampala (76 per 1,000), West Nile (73 per 1,000), and Bugisu (66 per 1,000). Among persons aged ≥5 years, incidence was highest in Kampala (55 per 1,000) and Kigezi (46 per 1,000) (Table 3).
Other forms of conjunctivitis had the lowest incidence across all regions and age groups, remaining below 10 per 1,000 in most regions, with slightly higher incidence among under-fives in Kampala (17 per 1,000), West Nile (11 per 1,000), and Karamoja (11 per 1,000) (Table 3).
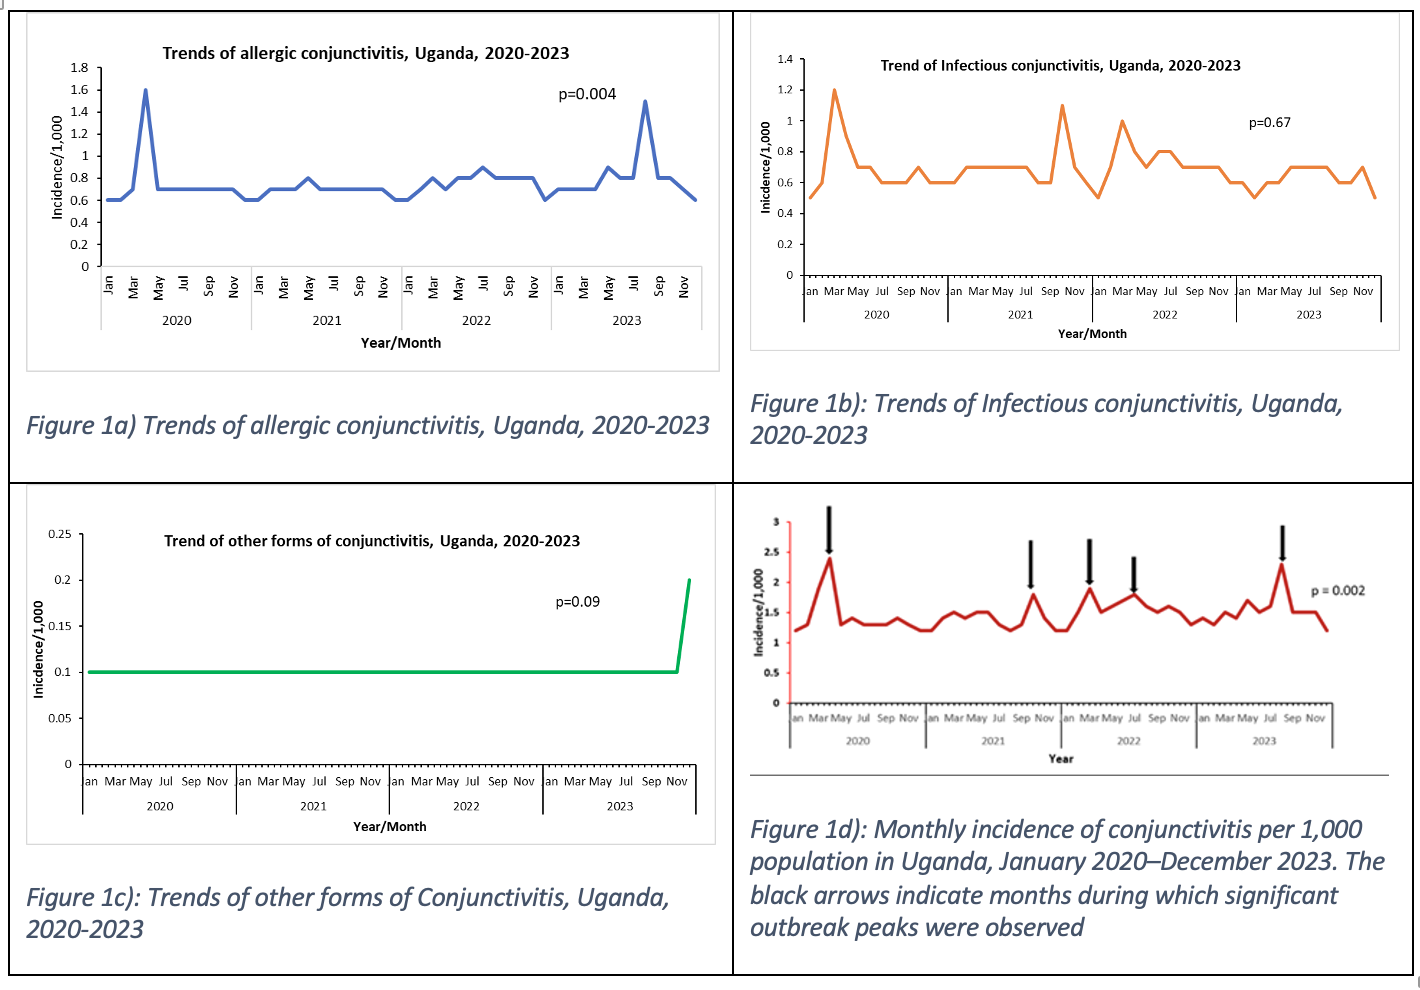
Temporal trends in conjunctivitis incidence by aetiology, Uganda, 2020–2023
Monthly incidence trends showed that allergic conjunctivitis increased significantly over time (p = 0.004), with peaks around March 2020 and July 2023 (Figure 1a). Infectious conjunctivitis showed no significant long-term trend and remained relatively stable with periodic fluctuations (p = 0.67) (Figure 1b).
Other forms of conjunctivitis remained low and stable, with no significant trend (p = 0.09) (Figure 1c). Overall, conjunctivitis incidence showed a significant upward trend (p = 0.002), with outbreak peaks in March 2020, June–July 2021, November 2021, July 2022, and August 2023 (Figure 1d).
Spatial distribution of conjunctivitis by aetiology, Uganda, 2020–2023
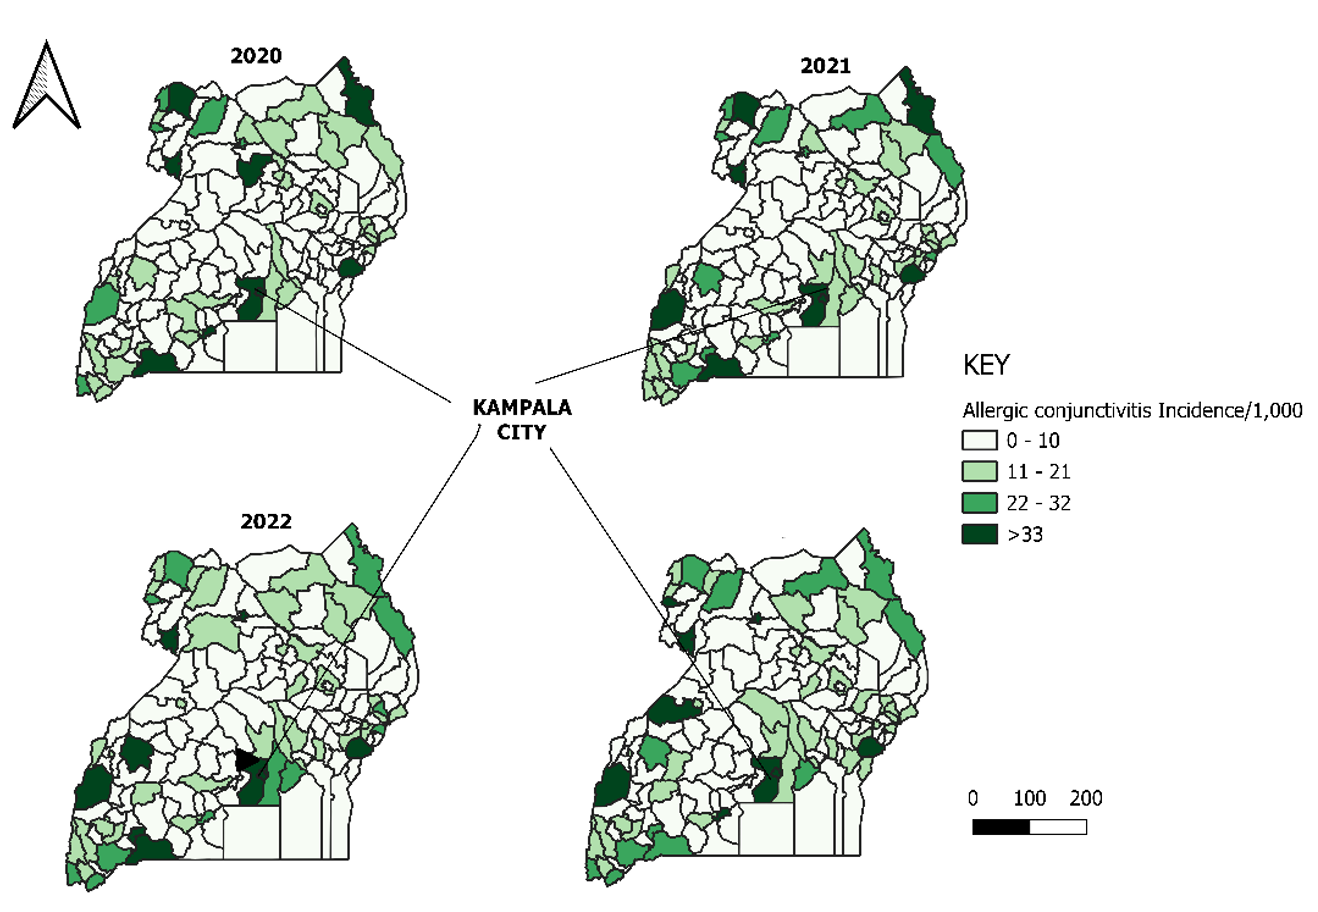
Allergic conjunctivitis incidence was highest in central and western Uganda, particularly around Kampala and neighbouring districts, with geographic expansion observed in 2022–2023 (Figure 2).
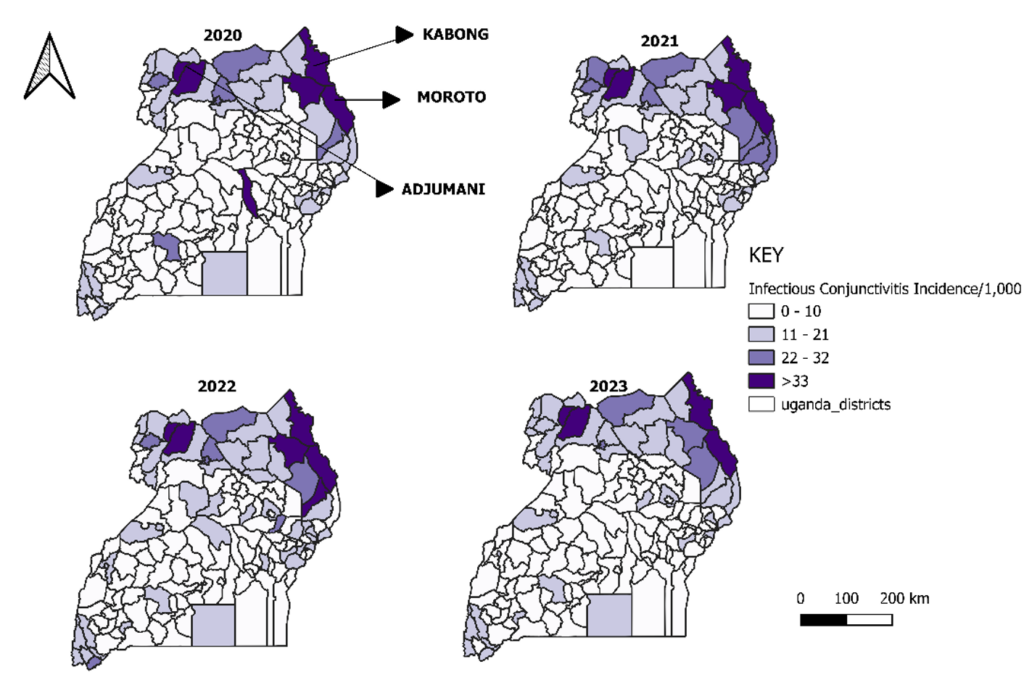
In contrast, infectious conjunctivitis showed persistent high-incidence clusters in northern and northeastern Uganda, especially in Karamoja (Moroto and Kaabong) and West Nile (Adjumani), with stable hotspot patterns across all four years (Figure 3).
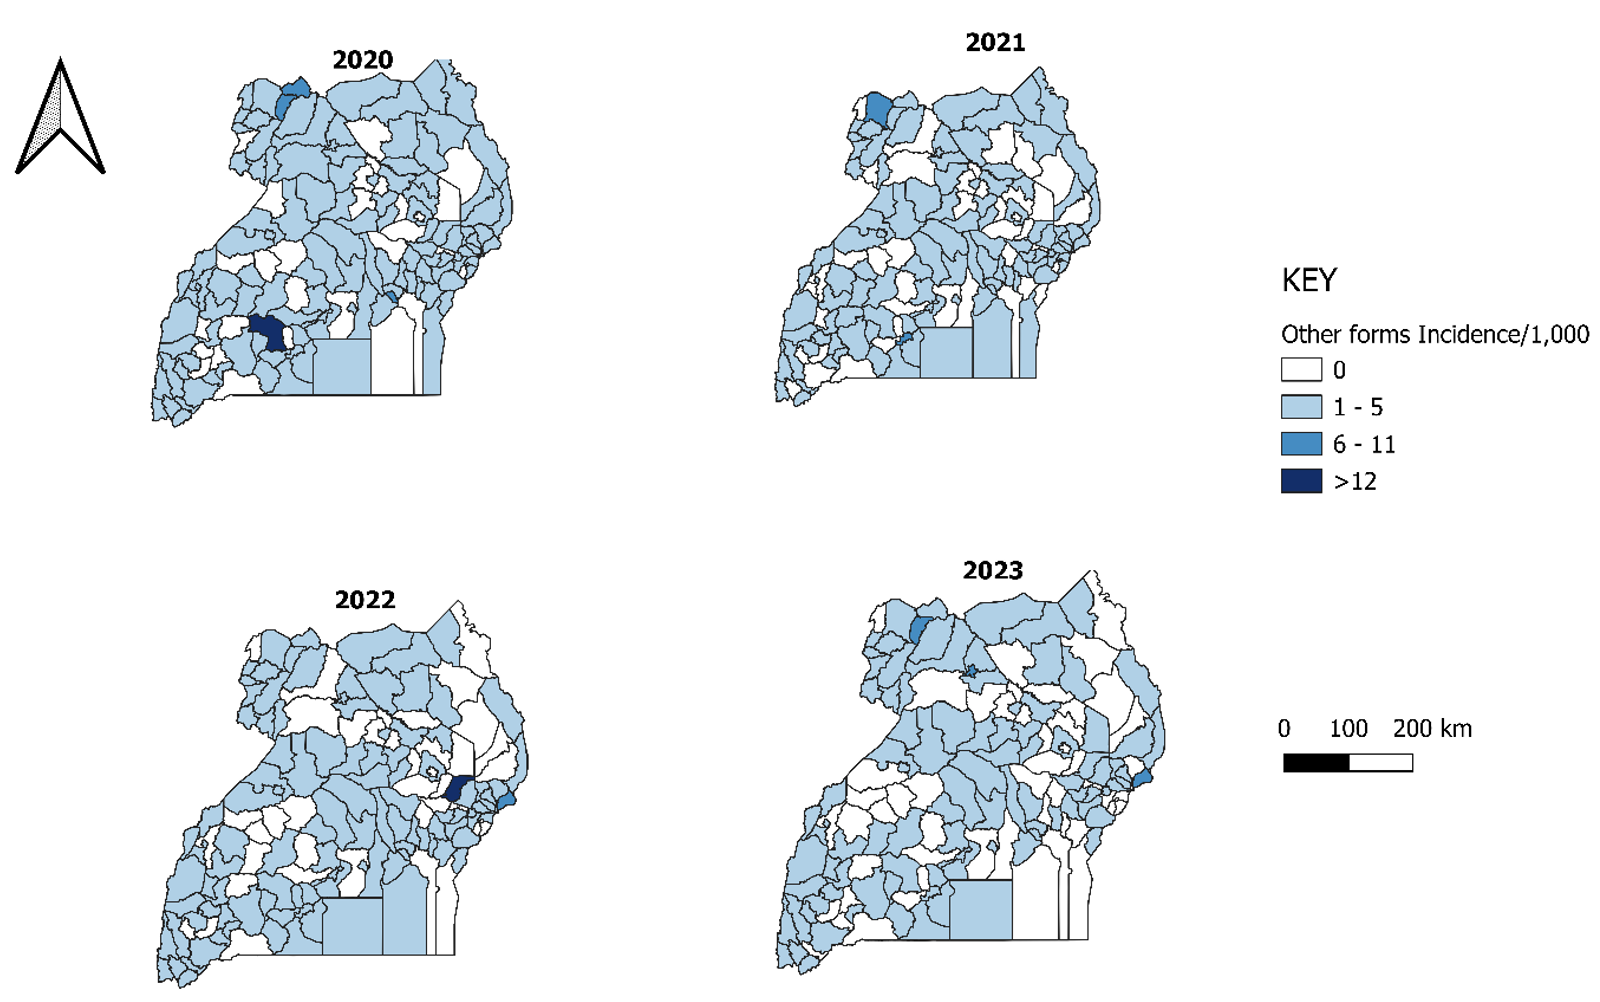
Other forms of conjunctivitis remained low across most districts, with most reporting 1–5 per 1,000 population and no persistent hotspots, indicating minimal spatial clustering (Figure 4).
This study provides a comprehensive national analysis of conjunctivitis trends in Uganda using routine health facility surveillance data from 2020 to 2023, to the best of our knowledge, and demonstrates substantial variation by aetiology, age group, sex, geography, and time. Overall, allergic and infectious conjunctivitis accounted for the majority of reported cases, with allergic conjunctivitis showing a significant increasing temporal trend, while infectious conjunctivitis remained persistently high in specific geographic hotspots, particularly in northern and northeastern Uganda. Females experienced a slightly higher incidence than males in most regions, and children under five years bore a disproportionate burden across all etiological categories, especially for infectious conjunctivitis.
Previous studies have shown that conjunctivitis follows a seasonal pattern in various regions, including the United States, where case peaks commonly occur in April and May [14]. Similarly, our study demonstrated clear seasonal variation, with consistent peaks in March, April, and October each year, most notably in allergic conjunctivitis. These seasonal surges increased significantly over time, suggesting a predictable, recurring pattern. To reduce ocular morbidity associated with seasonal peaks in conjunctivitis, targeted interventions such as pre-seasonal health education campaigns, enhanced surveillance, timely distribution of preventive supplies, and training of frontline workers could be implemented ahead of high-incidence periods [15].
Children under five consistently showed the highest incidence of conjunctivitis, aligning with previous findings that point to greater susceptibility in this age group due to underdeveloped immunity, increased exposure to environmental allergens, and hygiene-related behavior [16]. However, despite the elevated incidence, no significant trends were observed over time. Similarly, while females had a slightly higher incidence than males, temporal trends for both sexes were not statistically significant. This is consistent with existing literature, which generally finds no clear gender-based differences in allergic conjunctivitis prevalence [9]. Collectively, these findings suggest that while demographic variations in conjunctivitis incidence exist, the overall burden has remained relatively stable over the years.
Notably, the analysis revealed significant shifts in the distribution of conjunctivitis by aetiology. Allergic conjunctivitis demonstrated a statistically significant upward trend, which may indicate a true increase in burden or improvements in clinical recognition and reporting [17] This rise could be driven by greater exposure to environmental allergens, such as dust, pollen, and air pollutants particularly in rapidly urbanizing settings [18] Supporting this pattern, a study based on Burkina Faso’s surveillance data from 2013 to 2016 found that allergic conjunctivitis accounted for 37% of reported outbreaks, compared to 22% for bacterial and 41% for acute hemorrhagic forms, highlighting a growing predominance of allergic cases [19].
Spatially, allergic conjunctivitis was more prominent in central and western districts, particularly in urban and peri-urban areas, whereas infectious conjunctivitis clustered consistently in Karamoja and parts of West Nile, indicating stable high-transmission zones. These contrasting patterns suggest distinct underlying drivers, with allergic conjunctivitis likely influenced by environmental and lifestyle factors associated with urbanization, while infectious conjunctivitis remains endemic in settings with limited hygiene infrastructure and overcrowding [20]. High incidence of infectious conjunctivitis was observed in districts such as Adjumani, Kaabong, and Moroto, which are characterized by high population mobility, pastoralist livelihoods, and refugee settlements. Similar geographically stable hotspots have been reported in other low-resource and humanitarian settings where inadequate WASH services facilitate sustained transmission. Similar patterns have been reported in other studies, where conjunctivitis upsurges occurred in camps and conflict-affected areas with large pastoral and refugee populations [20,21,22]. These findings underscore the importance of targeted surveillance and control measures in high-risk, densely populated areas.
These findings highlight the need for strengthened and targeted conjunctivitis surveillance, particularly during high-risk seasonal periods and in pastoralist and refugee-hosting regions. Integrating conjunctivitis into existing disease surveillance systems and school health programs could enhance early detection and prevention in overcrowded settings. Expanded laboratory-based surveillance and further research on environmental risk factors are needed to understand seasonal drivers and inform effective prevention strategies.
Study limitations
Our study relied on routine DHIS2 health facility data, which may be affected by reporting inconsistencies and diagnostic misclassification, particularly at lower-level facilities with limited capacity. In addition, the DHIS2 surveillance system does not distinguish viral conjunctivitis as a separate etiological category, and laboratory confirmation is rarely available in routine care. Consequently, cases labeled as “bacterial conjunctivitis” are based on clinical diagnosis rather than microbiological verification. We therefore analyzed cases as ‘infectious conjunctivitis’ to better reflect their clinical classification. Despite these limitations, the use of a comprehensive national dataset over four years provides important evidence on conjunctivitis trends and geographic hotspots to guide public health planning and resource allocation.
Conjunctivitis remains a significant public health burden in Uganda, with clear variation by etiology, age group, sex, geography, and time. Allergic conjunctivitis is increasing, particularly in urban and peri-urban areas, while infectious conjunctivitis persists in stable hotspots in northern and northeastern regions, disproportionately affecting children under five years. These findings underscore the need for strengthened surveillance, targeted WASH and environmental health interventions, and improved early outbreak detection in high-risk settings. Future enhancements to national surveillance systems should refine conjunctivitis reporting categories to distinguish infectious from laboratory-confirmed bacterial conjunctivitis, thereby enhancing the accuracy and robustness of national conjunctivitis data for public health decision-making.
What is already known about the topic
What this study adds
GA: Participated in the conception, design, analysis, and interpretation of the study and wrote the draft manuscript; RM reviewed the report, reviewed the drafts of the manuscript for intellectual content, and made multiple edits to the draft manuscript; RM, LB, HTN, PE, KM, RK, DK and ARA reviewed the manuscript to ensure intellectual content and scientific integrity. All authors read and approved the final manuscript.
| Category | Cases | % |
|---|---|---|
| Sex | ||
| Female | 2,550,575 | 56 |
| Male | 1,999,618 | 44 |
| Age Group | ||
| <5 years | 1,452,027 | 32 |
| ≥5 years | 3,098,166 | 68 |
| Etiology | ||
| Allergic | 2,162,186 | 48 |
| Infectious | 2,077,750 | 46 |
| Other forms | 310,257 | 7 |
| Total | 4,550,193 | 100 |
| Region | Allergic Incidence per 1,000 | Infectious (Bacterial) Incidence per 1,000 | Other forms Incidence per 1,000 | |||
|---|---|---|---|---|---|---|
| Female | Male | Female | Male | Female | Male | |
| Acholi | 13 | 9 | 18 | 14 | 2 | 1 |
| Ankole | 12 | 8 | 11 | 9 | 1 | 1 |
| Bugisu | 14 | 10 | 13 | 10 | 2 | 1 |
| Bukedi | 9 | 6 | 14 | 13 | 1 | 1 |
| Bunyoro | 6 | 10 | 11 | 8 | 1 | 1 |
| Busoga | 7 | 4 | 8 | 7 | 1 | 1 |
| Kampala | 22 | 19 | 10 | 10 | 4 | 4 |
| Karamoja | 11 | 8 | 28 | 22 | 1 | 1 |
| Kigezi | 19 | 12 | 18 | 14 | 2 | 1 |
| Lango | 10 | 14 | 11 | 9 | 1 | 1 |
| North Buganda | 7 | 5 | 8 | 7 | 1 | 1 |
| South Buganda | 6 | 5 | 7 | 7 | 1 | 1 |
| Teso | 8 | 5 | 11 | 8 | 2 | 1 |
| Tooro | 9 | 6 | 10 | 7 | 1 | 1 |
| West Nile | 17 | 14 | 19 | 16 | 2 | 2 |
| Region | Allergic | Infectious | Other Forms | |||
|---|---|---|---|---|---|---|
| <5 yrs | ≥5 yrs | <5 yrs | ≥5 yrs | <5 yrs | ≥5 yrs | |
| Acholi | 59 | 30 | 151 | 63 | 10 | 4 |
| Bugisu | 66 | 33 | 80 | 48 | 9 | 4 |
| Ankole | 39 | 30 | 55 | 33 | 4 | 3 |
| Bukedi | 43 | 19 | 74 | 37 | 7 | 4 |
| Bunyoro | 23 | 29 | 60 | 28 | 6 | 2 |
| Busoga | 29 | 16 | 41 | 24 | 6 | 3 |
| Kampala | 76 | 55 | 45 | 43 | 17 | 12 |
| Karamoja | 65 | 24 | 380 | 92 | 11 | 3 |
| Kigezi | 61 | 46 | 136 | 62 | 8 | 4 |
| Lango | 150 | 22 | 66 | 29 | 5 | 2 |
| North Buganda | 24 | 17 | 33 | 28 | 6 | 3 |
| South Buganda | 23 | 16 | 28 | 28 | 4 | 2 |
| Teso | 32 | 18 | 59 | 31 | 9 | 4 |
| Tooro | 37 | 21 | 54 | 25 | 7 | 3 |
| West Nile | 73 | 40 | 131 | 78 | 11 | 6 |