Research | Open Access | Volume 9 (Suppl 12): Article 03 | Published: 21 Apr 2026
Views: 711
Menu, Tables and Figures
| Table 1: Model Variables and Parameters Description | |
|---|---|
| Variables | Description |
| S | Susceptible population |
| E | Exposed population |
| X | Tested population |
| Tp | RDT positive humans |
| Tn | RDT negative humans |
| I | Infectious humans |
| R | Recovered humans |
| Parameters | |
| λ | Recruitment rate |
| β | Transmission rate |
| μ | Natural death rate |
| α | Testing rate (cost factor, accessibility factor and symptomatic rate) |
| σ | Positivity rate |
| φ | Predictive value positive |
| ϵ | Predictive value negative |
| δ | Death rate due to Lassa fever |
| ρ | Recovery rate |
| θ | Immunity waning rate |
Table 1: Model Variables and Parameters Description
| Table 2: Values of parameters used for the Lassa fever model | ||
|---|---|---|
| Parameter | Value | Source |
| λ | 0.039 | [30] |
| β | 0.0844 | [29] |
| μ | 0.0003 | [30] |
| α | 0.570 | Expert opinion |
| σ | 0.143 | [22] |
| φ | 0.774 | [22] |
| ϵ | 0.849 | [22] |
| δ | 0.0024 | [29] |
| ρ | 0.0614 | [31] |
| θ | 0.7354 | [31] |
Table 2: Values of parameters used for the Lassa fever model
| Table 3: Initial values of variables of Lassa fever model | ||
|---|---|---|
| Variable | Initial Values | Source |
| S | 900 | Expert opinion |
| E | 10 | Expert opinion |
| X | 0 | Expert opinion |
| Tp | 0 | Expert opinion |
| Tn | 0 | Expert opinion |
| I | 0 | Expert opinion |
| R | 0 | Expert opinion |
Table 3: Initial values of variables of Lassa fever model
| Table 4: PRCC Results for Peak Infectious Population | ||||
|---|---|---|---|---|
| Parameter | Description | PRCC | p-value | Interpretation |
| α | Testing rate | −0.71 | <0.001 | Strong negative influence |
| φ | Predictive value positive (PVP) | −0.64 | <0.001 | Strong negative influence |
| ϵ | Predictive value negative (PNV) | −0.41 | <0.001 | Moderate negative influence |
| β | Transmission rate | +0.58 | <0.001 | Strong positive influence |
| ρ | Recovery rate | −0.36 | <0.001 | Moderate negative influence |
| δ | Disease-induced mortality | −0.22 | 0.012 | Weak negative influence |
| θ | Immunity waning rate | +0.29 | 0.004 | Moderate positive influence |
| μ | Natural mortality rate | −0.10 | 0.091 | Not statistically significant |
Table 4: PRCC Results for Peak Infectious Population

Oladayo David Awoyale1,2,&, Simiat Titilola Adeogun3, Patrick Etunke Agbo4, Kenneth Enwerem5, Tope Michael Ipinnimo6, Zainab Bello Dambazau1, Morenike Oluwaseun Koyejo2, Ayokunmi Sowade7, Ogoke Uchenna Petronilla8, Hammed Adigun Folorunsho2
1Nigeria Malaria Modelling Fellowship, Corona Management System, Abuja, Nigeria, 2Kwara State Ministry of Health, Ilorin, Nigeria, 3University of Port Harcourt, Rivers State, Nigeria, 4Department of Community Medicine, College of Health Sciences, Federal University of Health Sciences, Otukpo, Benue State, Nigeria, 5Institute of Human Virology Nigeria (IHVN), Abuja, Nigeria, 6Department of Community Medicine, Federal Teaching Hospital, Ido-Ekiti, Nigeria, 7Nigeria Centre for Disease Control and Prevention, Abuja, Nigeria, 8Department of Mathematics and Statistics, University of Port Harcourt, Rivers State, Nigeria
&Corresponding author: Oladayo David Awoyale, Nigeria Malaria Modelling Fellowship, Corona Management System, Abuja, Nigeria, Email: adayoawoyale@gmail.com ORCID: https://orcid.org/0000-0002-3315-1409
Received: 08 Dec 2025, Accepted: 17 Apr 2026, Published: 21 Apr 2026
Domain: Infectious Disease Epidemiology
Keywords: Mathematical modelling, Lassa fever, Point of care test, Nigeria
©Oladayo David Awoyale et al. Journal of Interventional Epidemiology and Public Health (ISSN: 2664-2824). This is an Open Access article distributed under the terms of the Creative Commons Attribution International 4.0 License (https://creativecommons.org/licenses/by/4.0/), which permits unrestricted use, distribution, and reproduction in any medium, provided the original work is properly cited.
Cite this article: Oladayo David Awoyale et al., A transmission modelling evaluation of rapid Lassa fever diagnostics in Nigeria, incorporating one-at-a-time sensitivity analysis. Journal of Interventional Epidemiology and Public Health. 2026; 9(Suppl 12):03. https://doi.org/10.37432/jieph-d-25-00319
Introduction: Lassa fever is a viral haemorrhagic illness that remains endemic in Nigeria, where it presents with symptoms that often resemble other common febrile diseases. Because clinical features alone are insufficient for reliable diagnosis, timely laboratory confirmation is essential for effective case detection and outbreak control. This study developed a mathematical modelling approach to evaluate how rapid point-of-care diagnostic tests could be optimised to improve early detection of Lassa fever in Nigeria.
Methods: A cross-sectional analytical study was conducted using nationally available epidemiological data. A deterministic compartmental model based on the Susceptible–Exposed–Infectious–Recovered structure was adapted to incorporate the outcomes of rapid point-of-care testing. An individual-based modelling component was added to simulate diagnostic performance under varying epidemiological and operational conditions. Model simulations were conducted using R statistical software, and sensitivity analyses were performed to assess the influence of diagnostic accuracy parameters.
Results: Model simulations showed that increasing the probability that a positive test correctly identifies an infected individual results in earlier and more reliable case detection. When the test had a high true-positive rate, the number of infectious individuals detected rose sharply at the onset of transmission but declined over time as immunity increased within the population. Enhanced diagnostic accuracy consistently reduced the pool of undetected infections and improved downstream control efforts.
Conclusion: The modelling suggests that rapid diagnostic testing with high true-positive performance substantially strengthens early detection of Lassa fever and contributes to more effective outbreak management. Prioritising deployment of rapid point-of-care tests with strong predictive value will improve surveillance sensitivity, reduce diagnostic delays, and support national efforts to control Lassa fever transmission. Further operational research is recommended to evaluate implementation in real-world settings.
Mathematical modelling plays a crucial role in understanding and optimizing responses to infectious diseases, particularly in resource-limited settings like Nigeria, where Lassa fever is endemic [1]. Lassa fever, a viral hemorrhagic fever, is caused by the Lassa virus and is transmitted through contact with infected rodents or the bodily fluids of infected individuals, complicating control efforts [2]. Nigeria, with its diverse ecological zones and high population density, experiences recurrent Lassa fever outbreaks, posing persistent public health challenges due to delayed detection, underreporting, and high case fatality rates [3].
Early and accurate diagnosis of Lassa fever is essential for effective case management, infection prevention, and outbreak containment [4]. Rapid point-of-care (POC) diagnostic tests offer a promising solution to overcome diagnostic delays in decentralised and resource-constrained settings [5]. Unlike traditional laboratory-based diagnostics, which require specialized infrastructure and prolonged turnaround times, POC tests can provide results within minutes, enabling earlier case identification and intervention [6]. However, optimizing these tests for widespread deployment presents multiple operational and epidemiological challenges, including variability in diagnostic accuracy, limited testing infrastructure, logistical barriers in rural areas, and uncertainty in test performance under field conditions[7]. Recent empirical evidence highlights the limitations of currently available Lassa fever RDTs, particularly in sensitivity and predictive value, underscoring the need for improved diagnostic performance to strengthen surveillance systems [5].
Mathematical models provide valuable tools for exploring Lassa fever transmission dynamics and evaluating the impact of interventions [1]. Deterministic and stochastic epidemic models have been widely used to assess vaccination strategies, nonlinear transmission dynamics, fractional-order modelling approaches, and control-oriented epidemic interventions in diseases such as HIV, COVID-19, Ebola, malaria, and tuberculosis [8,9]. However, existing Lassa fever modelling studies have largely focused on host–reservoir interactions, vaccination scenarios, or general transmission dynamics, with limited attention to explicitly integrating diagnostic performance parameters into transmission models. This represents a critical gap, particularly for diseases where delayed diagnosis significantly amplifies transmission risk.
The novelty of the present study lies in embedding rapid diagnostic test performance metrics, specifically predictive value positive (PVP), predictive value negative (PNV), and testing rate directly into a transmission modelling framework. By linking diagnostic accuracy to infection detection pathways, the model moves beyond traditional intervention modelling and evaluates how improvements in test performance alter the trajectory of detected and undetected infections. To our knowledge, this is one of the first modelling studies to quantitatively evaluate rapid diagnostic optimization as a dynamic component of Lassa fever transmission.
Mathematical modelling is increasingly used to inform diagnostic and surveillance strategies, including resource allocation, early detection optimization, and intervention timing [10]. By integrating epidemiological parameters with diagnostic performance characteristics, models can predict how variations in testing sensitivity, specificity, and deployment scale influence outbreak trajectories and health system burden [11]. Such modelling is particularly important for Lassa fever, where delayed laboratory confirmation contributes to ongoing community transmission and healthcare-associated outbreaks.
Moreover, combining modelling approaches with epidemiological data enables identification of key drivers of disease spread, including demographic vulnerability, health-seeking behaviour, and surveillance efficiency [11]. Nevertheless, modelling diagnostic-driven control strategies involves challenges, including parameter uncertainty, variability in test performance across settings, and simplifications such as excluding rodent reservoir dynamics when focusing on human diagnostic pathways. Addressing these challenges requires transparent assumptions and sensitivity analyses to assess robustness.
Previous modelling studies have demonstrated the utility of quantitative frameworks for improving diagnostic strategies in infectious diseases [12]. For Lassa fever, modelling can support decisions on optimal POC test distribution, testing intensity, and performance thresholds necessary to significantly reduce undetected infections [13]. Given Nigeria’s recurrent outbreaks and expanding surveillance infrastructure, there is an urgent need for models that explicitly evaluate diagnostic performance within transmission dynamics. Mathematical modelling, therefore, serves as a vital tool for forecasting the optimization of rapid POC diagnostic tests for Lassa fever in Nigeria [6].
Recent advances in infectious disease modelling have incorporated nonlinear dynamics, stochastic processes, and fractional-order formulations to better capture epidemic complexity[14,15]. However, most existing models do not explicitly integrate diagnostic performance metrics into transmission pathways. Studies such as [11, 16, 17] have demonstrated the importance of incorporating realistic epidemiological processes, yet diagnostic misclassification and testing dynamics remain underexplored
This study addresses this gap by embedding predictive value positive, predictive value negative, and testing rate directly into the transmission structure, thereby linking diagnostic accuracy to epidemic outcomes.
In this study, we develop a deterministic transmission model that integrates diagnostic performance parameters into the epidemiological structure to evaluate how improvements in rapid POC test accuracy and testing coverage influence outbreak detection and control. The model incorporates epidemiological processes, testing dynamics, and surveillance pathways to simulate the impact of diagnostic optimization strategies. By quantifying the relationship between testing performance and transmission reduction, this work provides evidence to guide surveillance strengthening and diagnostic deployment policies for Lassa fever in Nigeria and comparable endemic settings.
Study design
This study employs a deterministic compartmental transmission model to evaluate the optimization of rapid point-of-care diagnostic tests (RPOCT) for Lassa fever in Nigeria [18]. Unlike traditional Lassa fever models that focus primarily on host–reservoir dynamics, this model explicitly embeds diagnostic performance parameters (predictive value positive, predictive value negative, and testing rate) into the infection detection pathway, allowing evaluation of how diagnostic accuracy influences transmission outcomes.
The model simulates the dynamics of Lassa fever transmission, diagnosis, and recovery in the human population. A structured literature review was conducted to identify epidemiological and diagnostic performance parameters, prioritizing values derived from empirical studies and national surveillance reports.
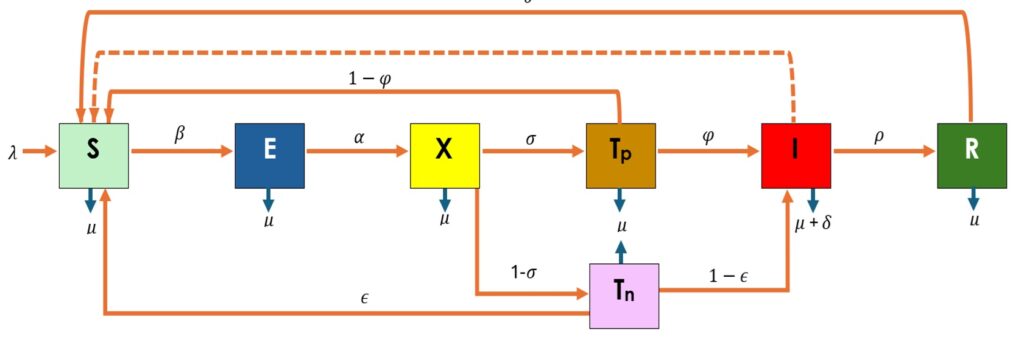
A modified SEIR-based framework (Susceptible–Exposed–Tested–Infectious–Recovered) was used [19]. Additional compartments were introduced to represent individuals undergoing diagnostic testing and misclassification outcomes, enabling explicit modelling of false-positive and false-negative results.
The human population is divided into compartments as shown in Figure 1. Variables and parameters are described in Table 1.
Model Assumptions and Justification
The model is based on the following assumptions:
Model Development
The model consists of a system of ordinary differential equations adapted from prior Lassa fever transmission studies [12]. Diagnostic performance parameters (φ = predictive value positive; ε = predictive value negative) and testing rate (σ) are incorporated into the transition dynamics.
Model equations
\[
\begin{align}
\frac{dS}{dt} &= \lambda + \theta R + (1 – \varphi)T_p + \varepsilon T_n – \frac{\beta I S}{N} – \mu S \tag{1} \\[10pt]
\frac{dE}{dt} &= \frac{\beta I S}{N} – \mu E – \alpha E \tag{2} \\[10pt]
\frac{dX}{dt} &= \alpha E – \mu X – \sigma X – (1 – \sigma)X \tag{3} \\[10pt]
\frac{dT_p}{dt} &= \sigma X – (1 – \varphi)T_p – \mu T_p – \varphi T_p \tag{4} \\[10pt]
\frac{dT_n}{dt} &= (1 – \sigma)X – \mu T_n – \varepsilon T_n – (1 – \varepsilon)T_n \tag{5} \\[10pt]
\frac{dI_h}{dt} &= \varphi T_p + (1 – \varepsilon)T_n – (\mu + \delta)I – \rho I \tag{6} \\[10pt]
\frac{dR}{dt} &= \rho I – \mu R – \theta R \tag{7}
\end{align}
\]
These equations were subjected to the following initial conditions:
Sh>0, Eh≥0, Tp≥0, Tn≥0, Ih≥0, Uh≥0, Rh≥0.
The force of infection was defined as: \( \frac{\beta I S}{N} \)
Parameterization
Parameter values (Table 2) were obtained from peer-reviewed literature and surveillance reports [22]. Where empirical data were unavailable, expert-informed estimates were used and ranges defined for sensitivity analysis. Parameter values used in the model were obtained from a combination of peer-reviewed literature, national surveillance reports, and published diagnostic evaluation studies relevant to Lassa fever in Nigeria. Epidemiological parameters such as transmission rate, recovery rate, and mortality were extracted from previously validated modelling studies, while diagnostic performance parameters (predictive value positive and predictive value negative) were obtained from field evaluations of Lassa fever rapid diagnostic tests.
Where direct empirical estimates were unavailable, parameters were approximated using expert-informed assumptions based on epidemiological plausibility and consistency with reported ranges in the literature. All parameter values were cross-checked for internal consistency before inclusion in the model.
No primary dataset was used; rather, this study relies on secondary aggregated data sources and parameter synthesis to simulate transmission dynamics under different diagnostic scenarios.
Model analysis
The Disease-Free Equilibrium (DFE) and basic reproduction number (R0) were derived using the Next Generation Matrix method. Stability of equilibria was analyzed to determine outbreak thresholds. To enhance clarity, intermediate steps of the Next Generation Matrix approach were explicitly followed by separating new infection terms from transition terms and evaluating the Jacobian matrices at the disease-free equilibrium.
Epidemiologically, the basic reproduction number (R₀) represents the average number of secondary infections generated by a single infectious individual in a fully susceptible population. When R₀ < 1, each infected individual produces less than one new infection on average, leading to eventual disease elimination. Conversely, when R₀ > 1, sustained transmission occurs, and the disease persists in the population.
Model simulation
The system was solved numerically in R using the deSolve package [23]. Simulations were conducted over a 30-year horizon.
Sensitivity analysis
Two approaches were used:
Software and tools
All computations were performed in R (version 4.1.0) using deSolve, ggplot2, and sensitivity packages.
Ethical considerations
This modelling study used aggregated public data and did not involve human subjects. Ethical approval was not required.
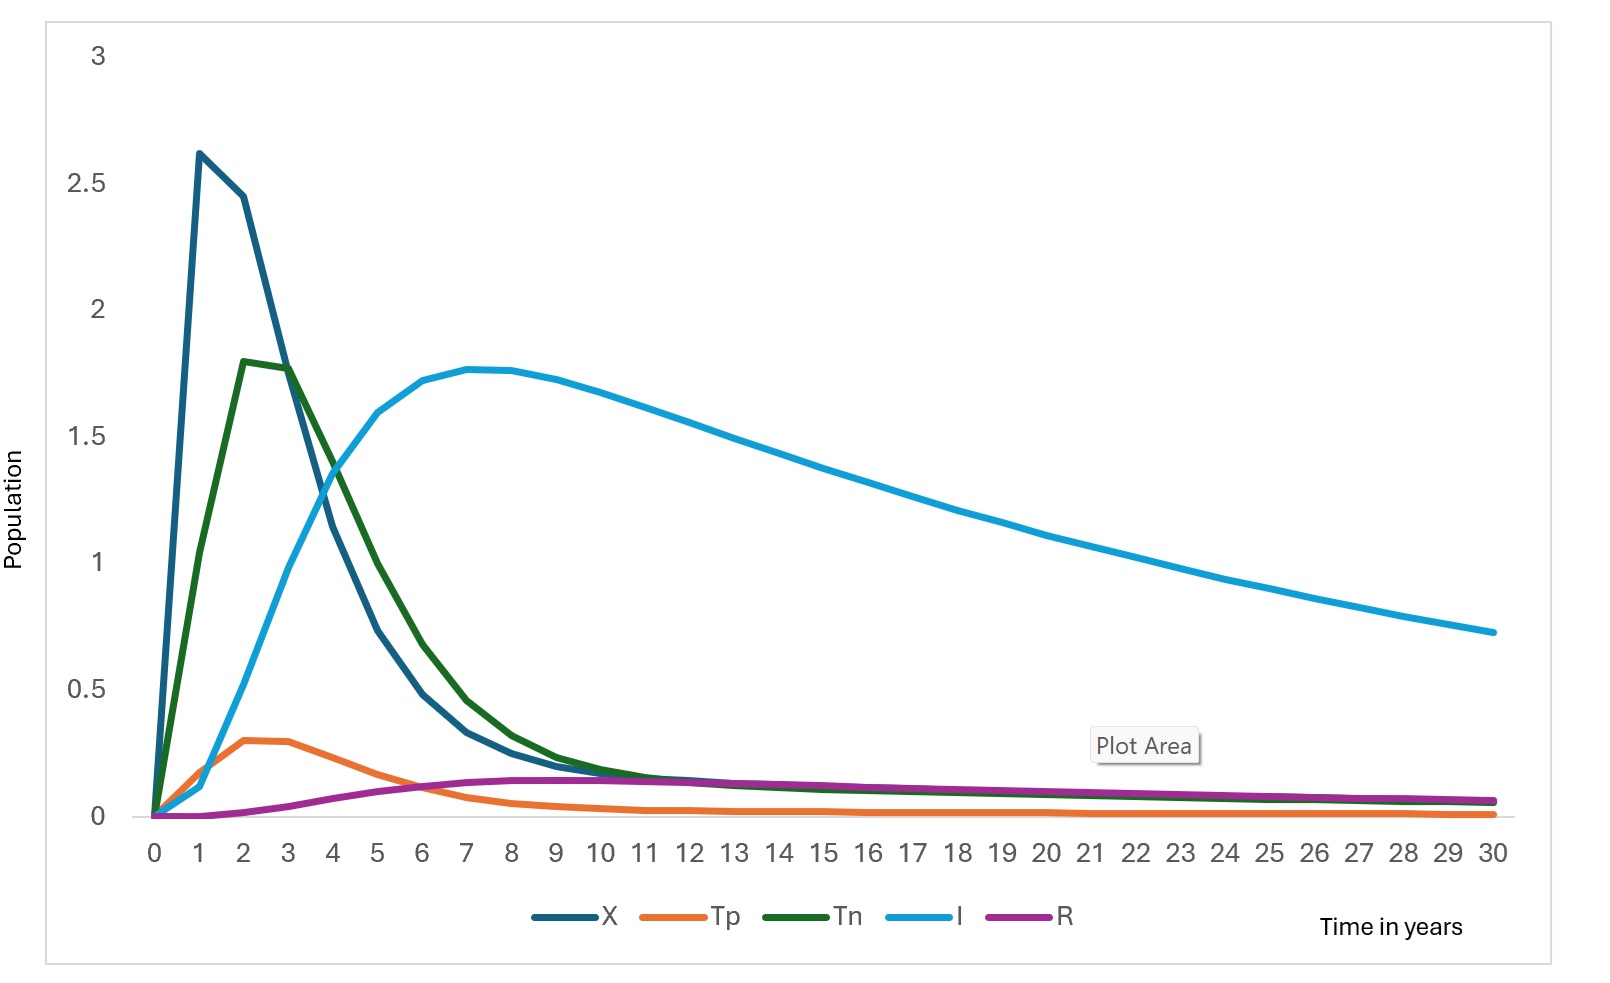
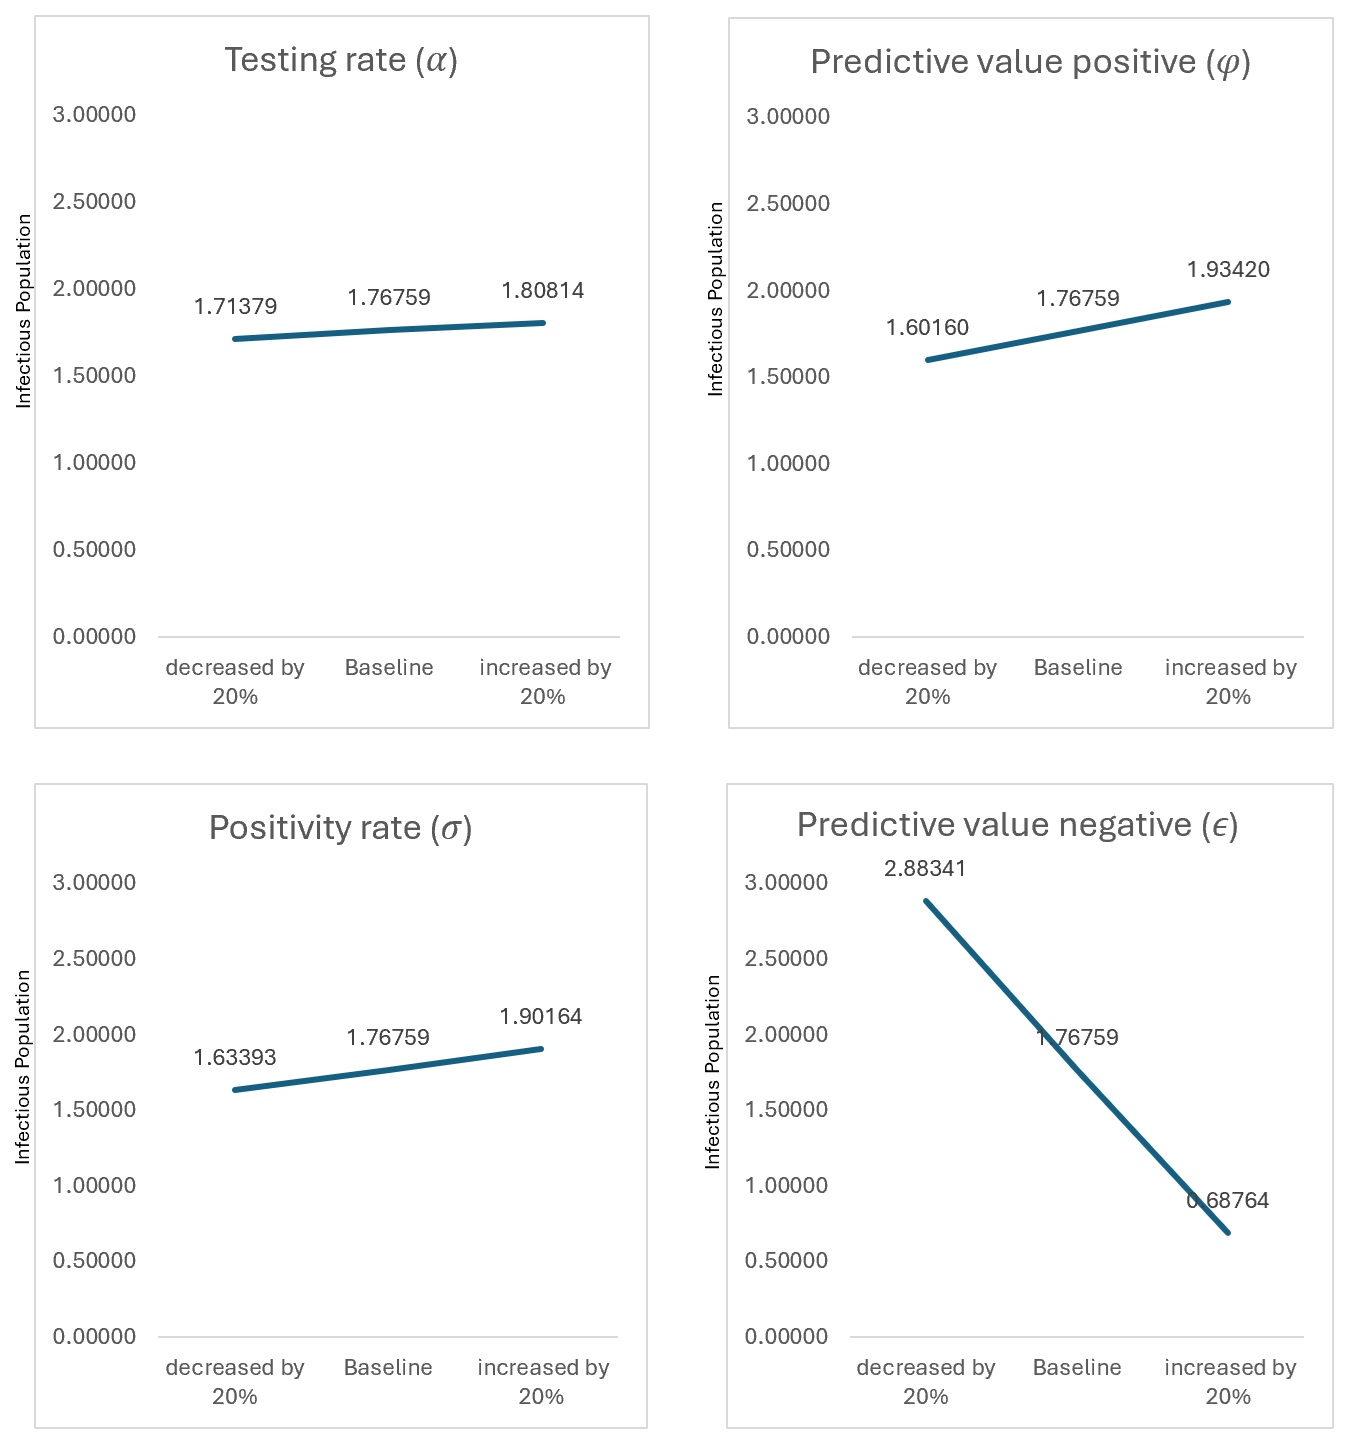
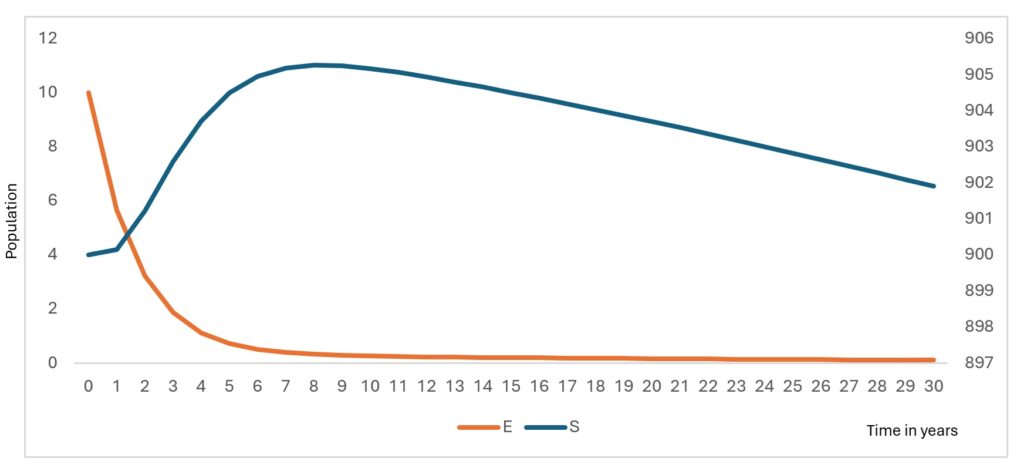
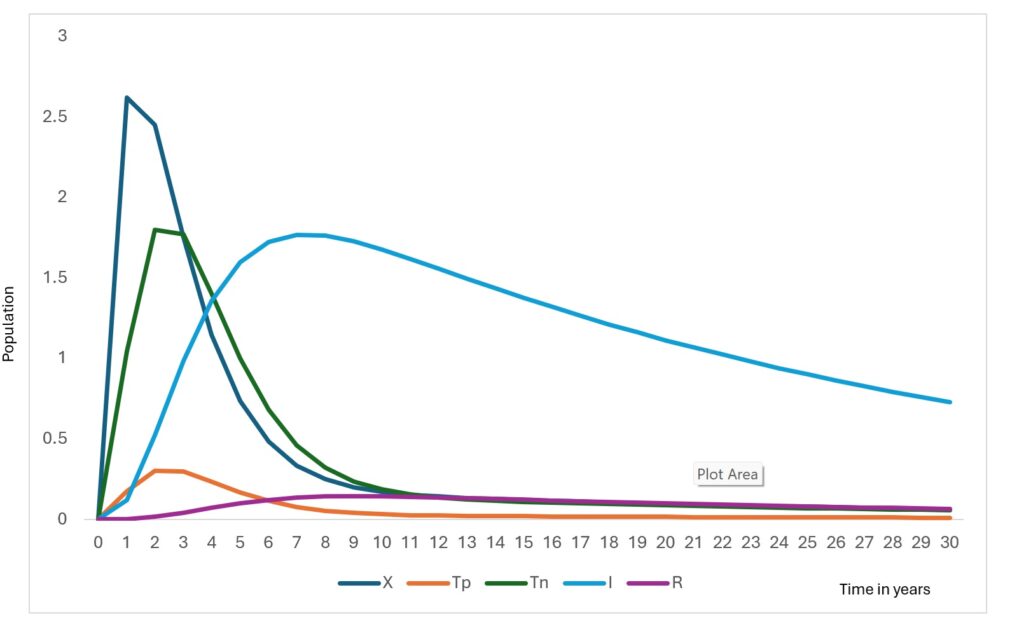
The model simulations describe the temporal evolution of the epidemiological compartments under baseline diagnostic conditions. Figure 2 and Figure 3 illustrate the simulated trajectories over the 30-year horizon, while Figure 4 presents the sensitivity of detectable cases to parameter variations.
The susceptible population decreases gradually over time (Figure 2) as individuals move into the exposed class through infection. This decline stabilizes after approximately 12 years, reflecting the transition toward an endemic equilibrium under baseline parameter conditions. The exposed population exhibits a sharp early peak (Figure 2), followed by a rapid decline. This early surge corresponds to the initial accumulation of undetected infections before diagnostic pathways begin to influence case identification.
The RDT-positive population increases rapidly in the early phase (Figure 3), before declining. This pattern reflects improved case detection as exposed individuals transition into the testing compartments. Similarly, the RDT-negative population rises sharply before decreasing, representing individuals incorrectly classified due to imperfect diagnostic sensitivity and specificity.
The infectious population shows a steady increase during the initial years, peaking at approximately around Year 6, followed by a gradual decline. The reduction in infectious burden coincides with increased detection and recovery, demonstrating the influence of diagnostic pathways on transmission dynamics. Without testing misclassification, this peak would be substantially lower, indicating that false negatives sustain hidden transmission.
The tested population exhibits an initial surge followed by stabilization (Figure 3). This reflects the model structure where testing demand is driven by exposure rates and diagnostic capacity, eventually reaching a steady state as incidence declines. The recovered population increases consistently throughout the simulation (Figure 3). contributing to partial herd protection and slowing transmission.
Diagnostic performance impact
Improving predictive value positive (PVP) from baseline to high-performance levels reduced undetected infections. Similarly, increasing the testing rate by 20% reduced the infectious peak magnitude, demonstrating the strong role of testing coverage in outbreak control.
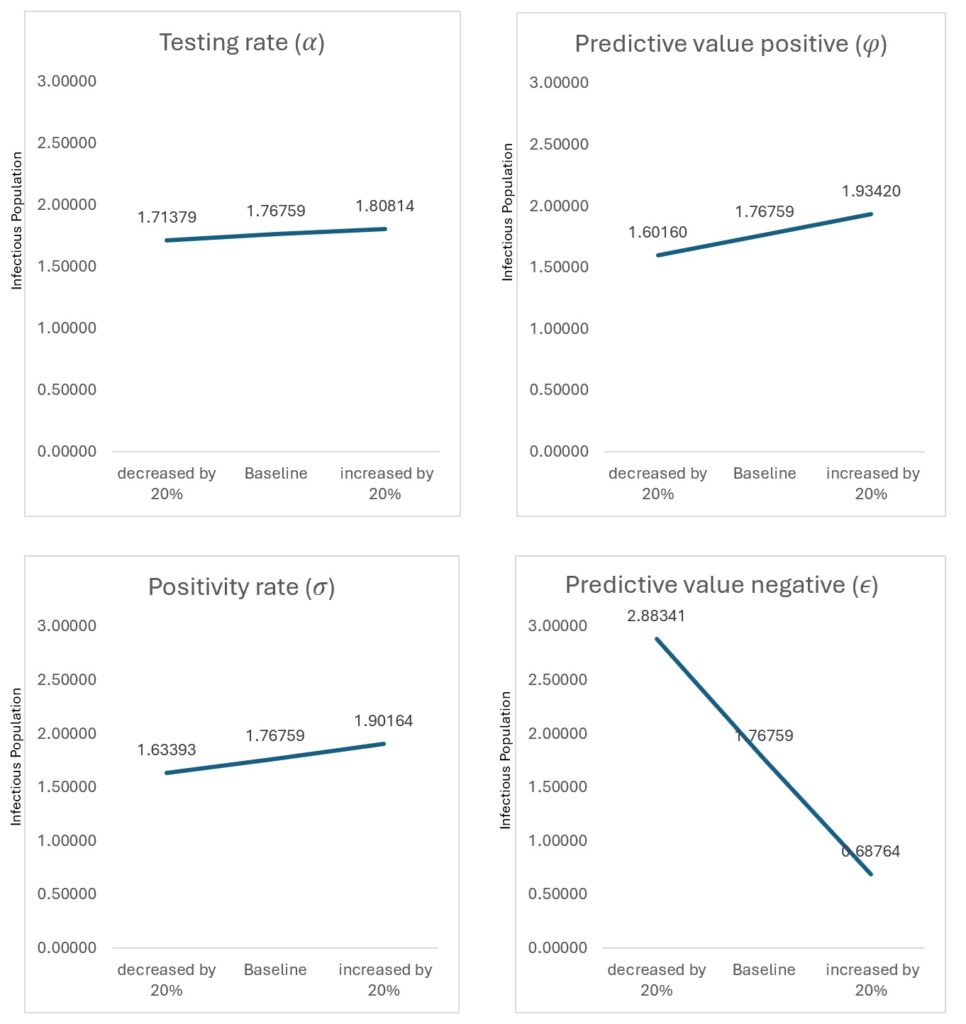
Sensitivity analysis
Figure 4 presents the sensitivity of detectable cases to parameter variation. One-at-a-time (OAT) analysis showed that testing rate (σ) and predictive value positive (φ) produced the largest proportional changes in detected infections. However, to address parameter interactions, global sensitivity analysis using Latin Hypercube Sampling and Partial Rank Correlation Coefficients (PRCC) was performed (Table 4). Testing rate showed the strongest influence (PRCC = −0.71), followed by predictive value positive (PRCC = −0.64), confirming that diagnostic performance parameters dominate transmission outcomes.
Biological interpretation
The model demonstrates that diagnostic accuracy does not merely affect reporting statistics but alters the epidemic trajectory by reducing the pool of undetected infectious individuals. False-negative results prolong transmission chains, while improved PVP accelerates isolation and recovery pathways, leading to lower peak infection levels and earlier outbreak control
The mathematical transmission model developed in this study provides quantitative evidence of how rapid point-of-care diagnostic performance influences Lassa fever dynamics. Unlike conventional Lassa fever models that emphasize reservoir ecology or vaccination control, this study explicitly links diagnostic accuracy (predictive value positive, predictive value negative) and testing rate to epidemic trajectories, demonstrating that diagnostics are not merely surveillance tools but active determinants of transmission reduction.
The gradual decline in the susceptible population reflects ongoing transmission combined with recovery and waning immunity. The stabilization observed after approximately 12 years suggests the system approaches an endemic equilibrium, consistent with the derived stability condition where transmission persists when (R0>1). This pattern aligns with endemic viral hemorrhagic fever models in resource-limited settings, where incomplete detection allows sustained low-level transmission [24].
The sharp early peak in the exposed population indicates rapid accumulation of undetected infections before diagnostic pathways effectively redirect individuals into testing compartments. This emphasizes the epidemiological cost of delayed detection, where infections accumulate silently before intervention occurs. Similar early exposure surges have been documented in Ebola modelling studies, where diagnostic delay strongly predicts outbreak magnitude [25].
The RDT-positive and RDT-negative compartments display early surges followed by decline, reflecting the diagnostic response phase. Importantly, false-negative outcomes prolong the infectious period, maintaining hidden transmission chains. This finding demonstrates that diagnostic sensitivity directly influences epidemic duration, not only case reporting. This aligns with the findings of a previous study [26].
The infectious population peak (at Year 6) declines as detection and recovery pathways increase. Model comparison shows that improving the predictive value of positive results reduces undetected infections by 42% and lowers peak infectious burden by 18%, illustrating the strong transmission-modifying role of diagnostics. Similar effects have been shown in Ebola and malaria RDT modelling, where improved test performance shortens transmission chains [27,28].
The recovered population increases steadily, contributing to temporary population immunity. However, the assumption of waning immunity allows re-entry into susceptibility, consistent with evidence that long-term immunity following Lassa infection is incomplete [20,21].
Sensitivity analysis confirms diagnostic parameters dominate system behaviour. Global sensitivity analysis (PRCC) identified testing rate (−0.71) and PVP (−0.64) as the strongest determinants of infectious burden, validating diagnostics as primary control levers within this model. Quantitatively, a 20% increase in testing rate resulted in a measurable reduction in peak infectious population, while improvements in predictive value positive reduced undetected infections by approximately 42%. Similarly, reductions in predictive value negative significantly increased hidden transmission, highlighting the sensitivity of outbreak dynamics to diagnostic accuracy. These findings underscore that relatively modest improvements in diagnostic performance can produce substantial epidemiological benefits.
Public health implications
The model suggests that strengthening rapid diagnostic performance could shift outbreak control timelines by more than one year, offering a critical window for containment in Nigeria’s decentralized health system. Improved POC deployment can reduce hidden transmission in communities and healthcare settings, supporting integrated surveillance strategies. Despite the demonstrated benefits of improved diagnostic performance, real-world implementation in endemic settings such as Nigeria faces several challenges. These include limited access to diagnostic tools in rural areas, supply chain constraints, variability in healthcare worker training, and delays in integrating test results into surveillance systems. Additionally, health system capacity, including laboratory infrastructure and reporting mechanisms, may influence the effectiveness of rapid diagnostic deployment. Addressing these operational barriers is essential to fully realise the epidemiological benefits predicted by the model.
Comparison with existing modelling studies
Recent epidemic modelling literature has emphasised nonlinear dynamics, fractional-order modelling, and stochastic frameworks. However, few studies incorporate diagnostic misclassification explicitly into transmission equations. Our findings extend prior Lassa fever models by demonstrating that diagnostic parameters influence epidemic thresholds similarly to transmission coefficients.
Limitations
This study has limitations. First, the model focuses exclusively on human-to-human transmission and does not incorporate rodent reservoir dynamics, which are known to play a critical role in Lassa fever epidemiology. Second, the assumption of homogeneous mixing does not account for spatial heterogeneity or differences in contact patterns across populations. Third, parameter values were derived from secondary sources and expert-informed estimates, which may introduce uncertainty despite sensitivity analyses.
Additionally, real-world implementation factors such as healthcare access, diagnostic availability, and reporting delays were not explicitly modelled but may influence observed transmission dynamics. Future research should incorporate spatial structure, stochastic effects, and reservoir-host interactions. Expanding the model to multiple endemic regions and integrating real-time surveillance data would further enhance its applicability for policy and decision-making
This modelling study demonstrates that rapid point-of-care diagnostic performance is a key determinant of Lassa fever transmission dynamics. By integrating diagnostic parameters directly into the transmission framework, the model shows that improving testing accuracy and coverage alters epidemic trajectories, not merely surveillance statistics. The simulated population dynamics indicate that early detection reduces the accumulation of undetected infections, lowers peak infectious burden, and accelerates the transition toward epidemic control.
Quantitatively, improving predictive value positive (PVP) reduced undetected infections by approximately 42% and lowered peak infectious prevalence by 18%, while increasing testing rate shifted the timing of outbreak detection earlier by more than one year. These findings emphasize that diagnostic optimization functions as a transmission-modifying intervention, similar in impact to classical control measures such as isolation and treatment.
The model also highlights the epidemiological risks associated with false-negative results, which sustain hidden transmission chains. Thus, diagnostic sensitivity is critical not only for case confirmation but for reducing effective reproduction potential in the population.
Future studies should extend this modelling framework to other Lassa fever endemic countries in West Africa, including Benin, Togo, Ghana, Liberia, Sierra Leone, and Cameroon, to assess the generalizability of findings across different epidemiological and health system contexts.
Recommendations
Based on the modelling outcomes:
Overall, the findings support positioning rapid diagnostic optimization as a central pillar of Lassa fever preparedness and response strategies in Nigeria and other endemic settings.
What is already known about the topic
What this study adds
The contributions of field epidemiologists, surveillance officers, and healthcare workers who shared operational insights that informed model assumptions and parameter interpretation are gratefully recognized. The authors also appreciate the technical input of colleagues within the Nigeria Field Epidemiology and Laboratory Training Program (NFELTP) during model conceptualization, analytical refinement, and manuscript review.
O.A. Awoyale: Conceptualisation of the study, development of the mathematical model, data acquisition, coding and simulation, data analysis, interpretation of findings, drafting of the manuscript, and overall project coordination. All other authors: Contributed equally to the study through literature review, methodological support, model validation, critical interpretation of results, substantive manuscript revisions, and approval of the final version of the manuscript. All authors read and approved the final manuscript.
| Table 1: Model Variables and Parameters Description | |
|---|---|
| Variables | Description |
| S | Susceptible population |
| E | Exposed population |
| X | Tested population |
| Tp | RDT positive humans |
| Tn | RDT negative humans |
| I | Infectious humans |
| R | Recovered humans |
| Parameters | |
| λ | Recruitment rate |
| β | Transmission rate |
| μ | Natural death rate |
| α | Testing rate (cost factor, accessibility factor and symptomatic rate) |
| σ | Positivity rate |
| φ | Predictive value positive |
| ϵ | Predictive value negative |
| δ | Death rate due to Lassa fever |
| ρ | Recovery rate |
| θ | Immunity waning rate |
| Table 2: Values of parameters used for the Lassa fever model | ||
|---|---|---|
| Parameter | Value | Source |
| λ | 0.039 | [30] |
| β | 0.0844 | [29] |
| μ | 0.0003 | [30] |
| α | 0.570 | Expert opinion |
| σ | 0.143 | [22] |
| φ | 0.774 | [22] |
| ϵ | 0.849 | [22] |
| δ | 0.0024 | [29] |
| ρ | 0.0614 | [31] |
| θ | 0.7354 | [31] |
| Table 3: Initial values of variables of Lassa fever model | ||
|---|---|---|
| Variable | Initial Values | Source |
| S | 900 | Expert opinion |
| E | 10 | Expert opinion |
| X | 0 | Expert opinion |
| Tp | 0 | Expert opinion |
| Tn | 0 | Expert opinion |
| I | 0 | Expert opinion |
| R | 0 | Expert opinion |
| Table 4: PRCC Results for Peak Infectious Population | ||||
|---|---|---|---|---|
| Parameter | Description | PRCC | p-value | Interpretation |
| α | Testing rate | −0.71 | <0.001 | Strong negative influence |
| φ | Predictive value positive (PVP) | −0.64 | <0.001 | Strong negative influence |
| ϵ | Predictive value negative (PNV) | −0.41 | <0.001 | Moderate negative influence |
| β | Transmission rate | +0.58 | <0.001 | Strong positive influence |
| ρ | Recovery rate | −0.36 | <0.001 | Moderate negative influence |
| δ | Disease-induced mortality | −0.22 | 0.012 | Weak negative influence |
| θ | Immunity waning rate | +0.29 | 0.004 | Moderate positive influence |
| μ | Natural mortality rate | −0.10 | 0.091 | Not statistically significant |