Research | Open Access | Volume 9 (2): Article 66 | Published: 24 Apr 2026

Views: 1,541
Menu, Tables and Figures
| Characteristic (N=63,599) | Frequency | (%) |
|---|---|---|
| Gender | ||
| Female | 33,288 | 52.3 |
| Male | 30,311 | 47.7 |
| Age group (in years) | ||
| <5 | 27,688 | 43.5 |
| 5-9 | 17,502 | 27.5 |
| 10-14 | 18,409 | 28.9 |
Table 1: Characteristics of children aged 0-14 years by gender and age group, Uganda, 2015-2023


Daniel Wenani1,&, Richard Migisha1, Lilian Bulage1, Hilda Tendo Nansikombi1, Emmanuel Mfitundinda1, Benon Kwesiga1, Alex Riolexus Ario1
1Uganda Public Health Fellowship Program, Uganda National Institute of Public Health, Kampala, Uganda
&Corresponding author: Daniel Wenani, Uganda Public Health Fellowship Program, Uganda National Institute of Public Health, Kampala, Uganda, Email: dwenani@uniph.go.ug, ORCID: https://orcid.org/0009-0007-7570-4888
Received: 02 Jan 2026, Accepted: 21 Apr 2026, Published: 24 Apr 2026
Domain: HIV Epidemiology
Keywords: Children, HIV infections, epidemiology, prevention, transmission, incidence, Uganda
©Daniel Wenani et al. Journal of Interventional Epidemiology and Public Health (ISSN: 2664-2824). This is an Open Access article distributed under the terms of the Creative Commons Attribution International 4.0 License (https://creativecommons.org/licenses/by/4.0/), which permits unrestricted use, distribution, and reproduction in any medium, provided the original work is properly cited.
Cite this article: Daniel Wenani et al., Temporal trends and spatial distribution o f pediatric HIV incidence in Uganda, 2015–2023. Journal of Interventional Epidemiology and Public Health. 2026; 9(2):66. https://doi.org/10.37432/jieph-d-26-00004
Introduction: Uganda is working toward eliminating HIV transmission by 2030. Yet in 2023, HIV infections among children accounted for 11% of all new HIV infections. We assessed trends and spatial distribution of diagnosed HIV incidence among children aged 0-14 years in Uganda from 2015 to 2023, to guide strategies toward achieving the 2030 goal of zero transmission.
Methods: We analyzed routinely reported HIV surveillance data extracted from the electronic District Health Information Software version 2 (DHIS2), from 2015 to 2023. Diagnosed HIV incidence was computed as the number of newly diagnosed HIV-positive children divided by the corresponding population of children aged 0-14 years, expressed per 100,000, and stratified by region, sex, and age group. The significance of temporal trends was assessed using the Mann-Kendall test, and the magnitude of the trend using Sen’s slope test. To depict the spatial distribution of diagnosed HIV incidence from 2015 to 2023, we generated region- and district-level choropleth maps using Quantum Geographic Information System (QGIS) version 3.34.
Results: During 2015–2023, 63,599 children aged 0-14 years were newly diagnosed with HIV, translating to an annual mean of 7,128 cases. The mean national annual incidence was 35 per 100,000 children, and diagnosed HIV incidence declined by 4.7 per 100,000 over the study period (95%CI: -7.9, -1.4; p=0.01). Kampala region consistently recorded the highest mean annual incidence (75 per 100,000), whereas Karamoja had the lowest (13 per 100,000). Kalangala District maintained a persistently high mean annual incidence (84 per 100,000) throughout the period. In contrast, diagnosed HIV incidence increased in Fort Portal (p=0.008) and Mbarara (p=0.03) in western Uganda, Lira (p=0.04) in northern Uganda, and Jinja (p=0.03) in eastern Uganda during 2015–2023.
Conclusion: From 2015 to 2023, diagnosed pediatric HIV incidence declined, although the trend was non-linear, and geographical disparities persisted. Urban areas like Kampala and the fishing district of Kalangala persistently had high or increasing incidence. Some rural districts, including Kassanda and Luwero, and several cities showed an increasing incidence. Targeted interventions in high-burden districts and cities are needed to accelerate further reductions and support attainment of the 2030 goal of zero HIV transmission.
In 2023, approximately 1.4 million children were living with HIV globally [1]. HIV incidence is an important indicator of progress in the fight against HIV, with global trends showing a declining trend over the past decade among both adults and children, with new pediatric HIV infections declining from 300,000 in 2010 to 120,000 in 2023 [1–3]. The global target is to achieve zero HIV transmission by 2030 [3]. However, the persistently high HIV incidence among children remains a key challenge to reaching the goal of ending HIV/AIDS by 2030 [4]. As of 2023, children aged 0-14 years accounted for approximately 9% of new HIV infections, 3% of people living with HIV, and 12% of AIDS-related deaths globally [5]. Sub-Saharan Africa continued to bear the highest burden of pediatric HIV, accounting for 87% of the global burden [1]. In children, HIV transmission primarily occurs during mother-to-child transmission (MTCT) perinatally or during breastfeeding. Therefore, HIV incidence among children may predict MTCT trends.
In 2017, Uganda adopted the global Joint United Nations Programme on HIV/AIDS target of zero new HIV infections by 2030 [6]. New HIV infections among children in Uganda decreased from 20,000 in 2010 to 5,900 in 2022 [7,8]. However, in 2023, children aged 0–14 years still accounted for 4,700 (11%) of all new HIV infections in the country [2,7].
Uganda has implemented several strategies to prevent new HIV infections among children, including the earlier Option B+ program – where all HIV-positive pregnant and breastfeeding women are initiated on lifelong antiretroviral therapy (ART), regardless of CD4 count and the “Start Free, Stay Free, AIDS Free” campaign [8]. The Option B+ program, expanded from 2011 to 2015, contributed significantly to reducing HIV incidence among children [9–10]. The “Start Free, Stay Free, AIDS Free” campaign, launched in 2015, introduced interventions for eliminating pediatric HIV. These included early infant diagnosis, universal ART initiation for all pregnant and breastfeeding women, and scaled-up access to HIV services for children and adolescents [8]. While these interventions were expected to reduce MTCT and have enabled the campaign to make some progress in reducing the number of children newly diagnosed with HIV, with a 24% decline from 2015 to 2020, their impact on reducing HIV incidence in children has been limited [8].
Despite the HIV prevention strategies, HIV incidence among children has remained high between 2017 and 2023 [11]. Moreover, these strategies have primarily focused on infants and children <2 years of age [13]. In addition, some HIV infections may be diagnosed later, after two years of age, indicating delayed diagnosis of infections. Analysis of the trends in HIV incidence among children is crucial in informing progress towards the global target of zero HIV transmission by 2030. We examined trends and distribution of diagnosed HIV incidence among children aged 0-14 years in Uganda, 2015-2023.
Study setting
Uganda is located in the East African region with an estimated population of 44 million in 2023. The country has 15 non-administrative regions, which include: Acholi, Ankole, Bugisu, Bukedi, Bunyoro, Busoga, Kampala, Karamoja, Kigezi, Lango, North Central, South Central, Teso, Tooro, and West Nile. There are 146 districts and cities countrywide. Uganda’s health system is organized in a tiered referral structure comprising community-level services, Health Centre II, III, and IV facilities, general hospitals, regional referral hospitals, and national referral hospitals. HIV service delivery is integrated across this system and includes HIV testing services, prevention of mother-to-child transmission, ART, and linkage to care through facility-based and community-linked platforms [14].
Study design and data source
We conducted secondary analysis of routinely collected HIV surveillance data from the District Health Information Software version 2 (DHIS2). DHIS2 is a national electronic Health Management Information System (HMIS) database. HMIS is an integrated reporting system that includes data on attendance from the outpatient department (OPD), OPD diagnoses, HIV service data, and laboratory data, among others. It also includes aggregated data on the number who newly tested HIV positive, disaggregated by age, sex, region, and district. For this study, we utilised monthly aggregated data on newly diagnosed HIV-positive children in the 0-14-year age group.
Study variables and data abstraction
From DHIS2, we extracted and exported data regarding the number of children aged 0-14 years who newly tested HIV positive to Microsoft ExcelTM and STATA 16. While the DHIS2 database does not specify the test type used for individual cases, it is assumed that diagnoses were conducted according to these national standards. We abstracted data from the health unit monthly report, HMIS 105, 2015-2023. For each year, the data were stratified by national, regional, district levels, sex (female, male), and age group (<5 years, 5–9 years, and 10–14 years).
Data analysis
Diagnosed HIV incidence was calculated as the number of newly diagnosed HIV-positive children divided by the annual population of children aged 0-14 years, per 100,000, at the national level and for each region, sex, and age group from 2015 to 2023. Annual population at risk for each stratum were obtained from the Uganda Bureau of Statistics (UBOS) [15]. We used the 2– national census population as a baseline and applied the UBOS annual growth rate of 3.1% to estimate population sizes for each subsequent year from 2015 to 2023. A detailed supplementary file (Supplementary File 1) with year-by-year extrapolated population estimates by UBOS used as the denominator in calculation of incidence rates has been provided. To assess reporting quality, we calculated the reporting rate as the percentage of complete monthly reports divided by the expected number of reports for each year from 2015 to 2023. No imputation was performed for missing monthly reports; analyses were based on the available DHIS2 data as reported, and annual reporting rates were used to contextualise the findings.
We used line graphs to illustrate the trends in overall (national), sex-specific, age group, and regional diagnosed HIV incidence rates. The significance of each trend was assessed using the Mann-Kendall (MK) test in STATA 16™, with a significance level set at p<0.05. The magnitude of the overall trend was estimated using Sen’s slope computed using R. To visualise the spatial distribution of diagnosed HIV incidence among children from 2015 to 2023, choropleth maps were generated for each region and district using Quantum Geographic Information Software (QGIS) version 3.34.
Ethical considerations
We used retrospective surveillance data and did not directly engage any participant in this study. The Uganda Public Health Fellowship Program is part of the National Rapid Response Team and has been granted permission to access and analyze surveillance data in the DHIS2 and other data, such as survey and field investigation data, to inform decision-making in the control and prevention of outbreaks and public health programming. Additionally, the Ministry of Health (MoH) has also granted the Program permission to disseminate the information through scientific publications. We stored the abstracted dataset in a password-protected computer and only shared it with the investigation team. The US Cereers for Disease Control and Prevention (CDC) provided the non-research determination (NRD) for non-human subjects. In agreement with the International Guidelines for Ethical Review of Epidemiological Studies by the Council for International Organisations of Medical Sciences (1991) and the Office of the Associate Director for Science, US CDC/Uganda, it was determined that this activity was not human subject research and that its primary intent was to improve public health practice or disease control. This activity was reviewed by the US CDC and was conducted consistent with applicable federal law and CDC policy. §§See, e.g., 45 C.F.R. part 46, 21 C.F.R. part 56; 42 U.S.C. § 241(d); 5 U.S.C. § 552a; 44 U.S.C. § 3501 et seq. The study was performed in accordance with the Declaration of Helsinki.
Trends of diagnosed HIV incidence among children aged 0-14 years, Uganda, 2015–2023
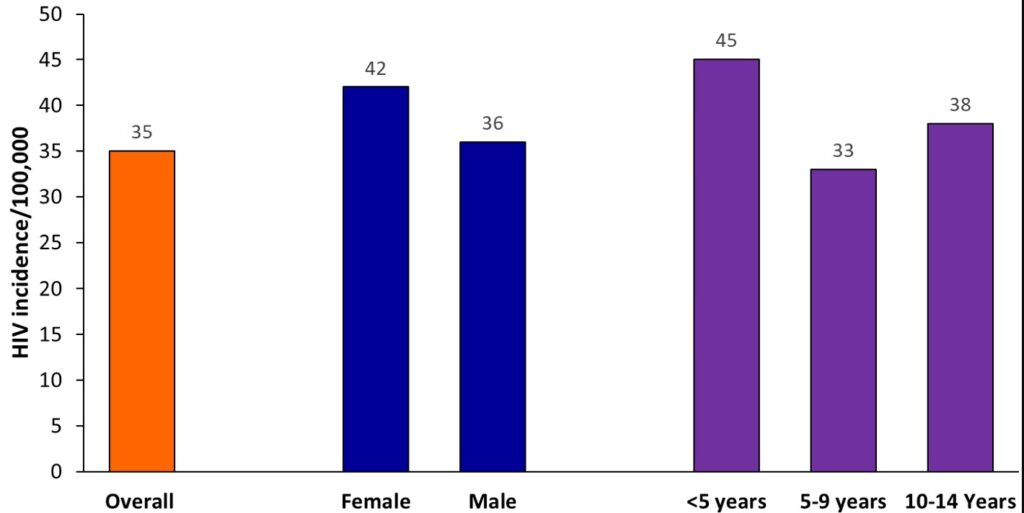
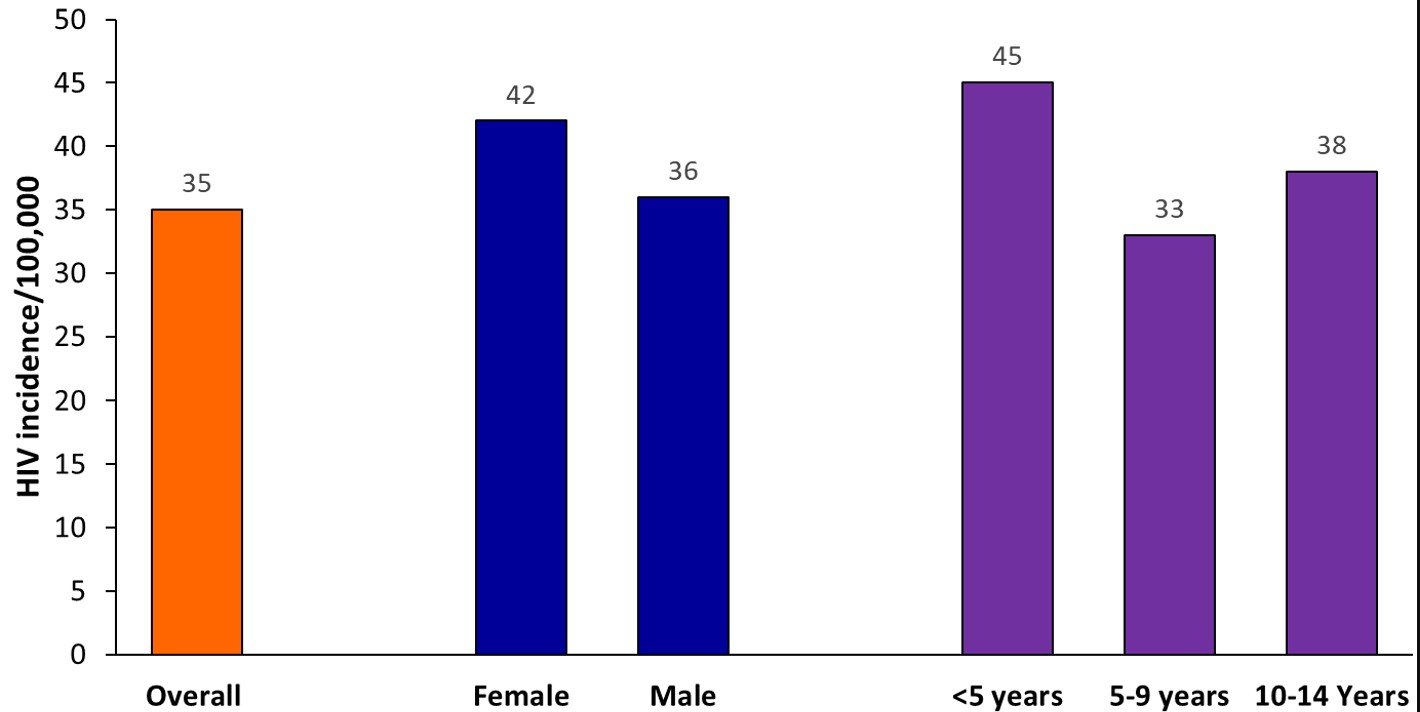
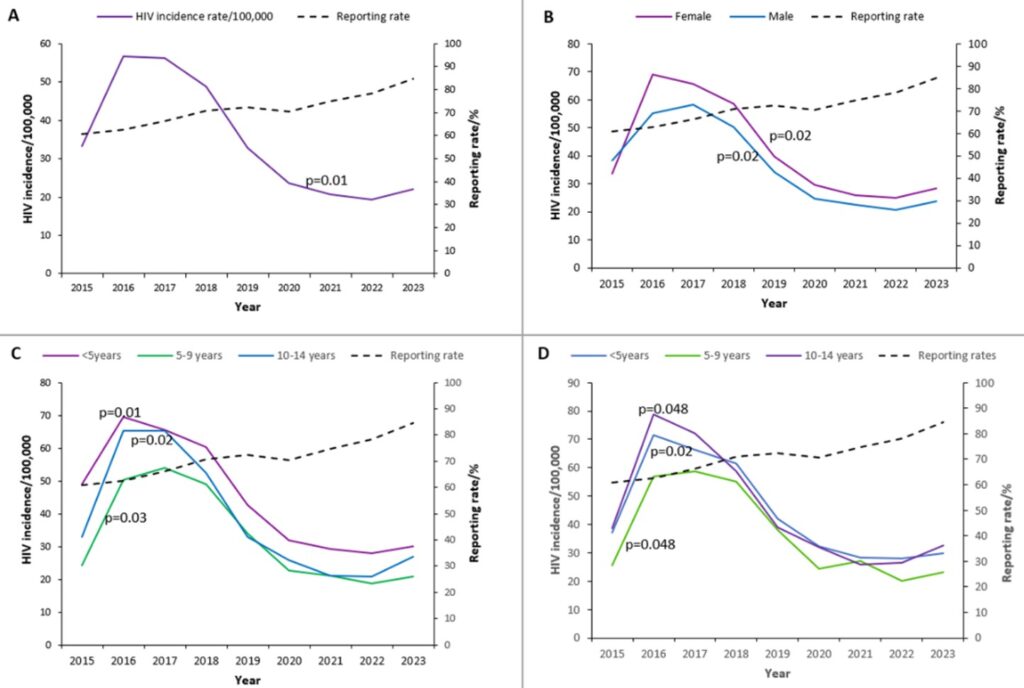
Between 2015 and 2023, a total of 63,599 children aged 0-14 years were newly diagnosed with HIV, with an average of 7,128 new diagnoses per year over the study period. Among the children with new HIV infections, 52.3% (33,288/63,599) were females, 43.5% (27,688/63,599) were below 5 years, and 27.5% (17,502/63,599) were 5-9 years, and 28.9% (18,409/63,599) were 10-14 years (Table 1). The mean diagnosed HIV incidence was 35 per 100,000 children. Females (average diagnosed HIV incidence=42 per 100,000 children) had higher diagnosed HIV incidence, and <5-year-old (average diagnosed HIV incidence=45 per 100,000 children) had the highest diagnosed HIV incidence throughout the study period (Figure 1).
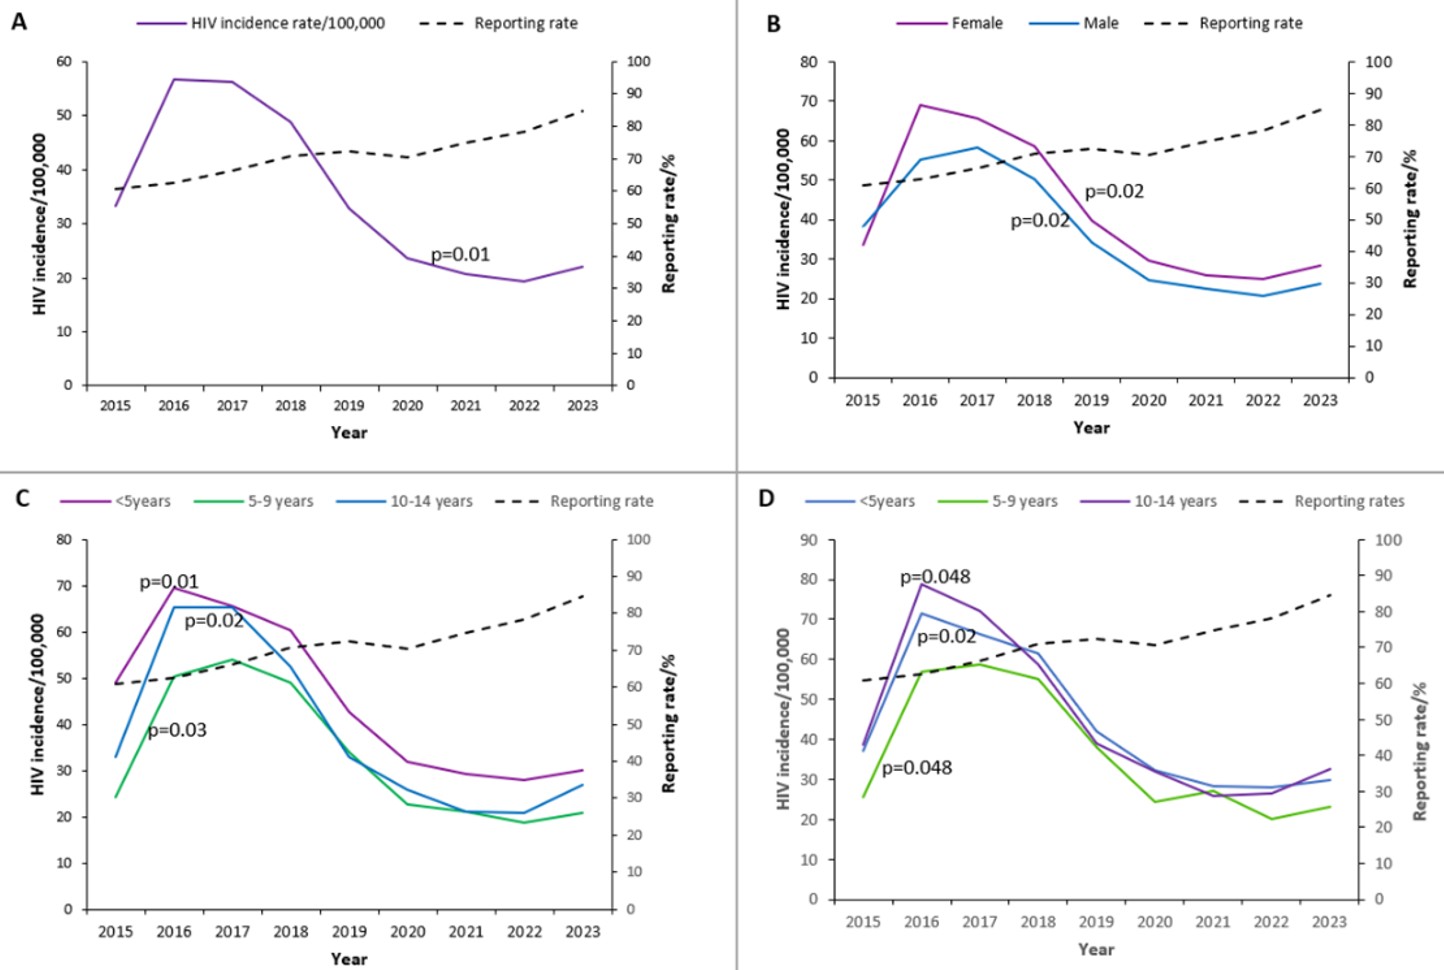
Overall, diagnosed HIV incidence increased from 33 per 100,000 in 2015 to a peak of 57 per 100,000 in 2016 (73% increase) and remained high in 2017 (56 per 100,000), before declining to 22 per 100,000 in 2023 (55% reduction) (Figure 2A). Incidence declined from 2020 to 2022, followed by a slight increase in 2023. Across 2015–2023, diagnosed HIV incidence among children aged 0–14 years showed a significant downward trend with an annual decline of 4.7 per 100,000 (95%CI: -7.9, -1.4; p=0.01). Over the same period, reporting rates improved from 61% in 2015 to 85% in 2023.
Across 2015–2023, diagnosed HIV incidence among female children aged 0–14 years remained consistently higher than among male children in the same age group. Among females, incidence rose from 34 per 100,000 in 2015 to a peak of 69 per 100,000 in 2016, then declined to 28 per 100,000 in 2023 (p=0.02). Among males, incidence increased from 38 per 100,000 in 2015 to a peak of 58 per 100,000 in 2017 and subsequently decreased to 24 per 100,000 in 2023 (p=0.02) (Figure 2B).
Children <5 years old consistently had the highest diagnosed HIV incidence between 2015 and 2023 compared with those aged 5-9 years and 10-14 years. Incidence declined over time in all age groups: <5 years (p=0.01), 5-9 years (p=0.02), and 10-14 years (p=0.03) (Figure 2C). Among females, those aged 10-14 years had the highest incidence relative to other age groups throughout the study period (Figure 2D).
Spatial distribution of diagnosed HIV incidence among children aged 0-14years, Uganda, 2015–2023
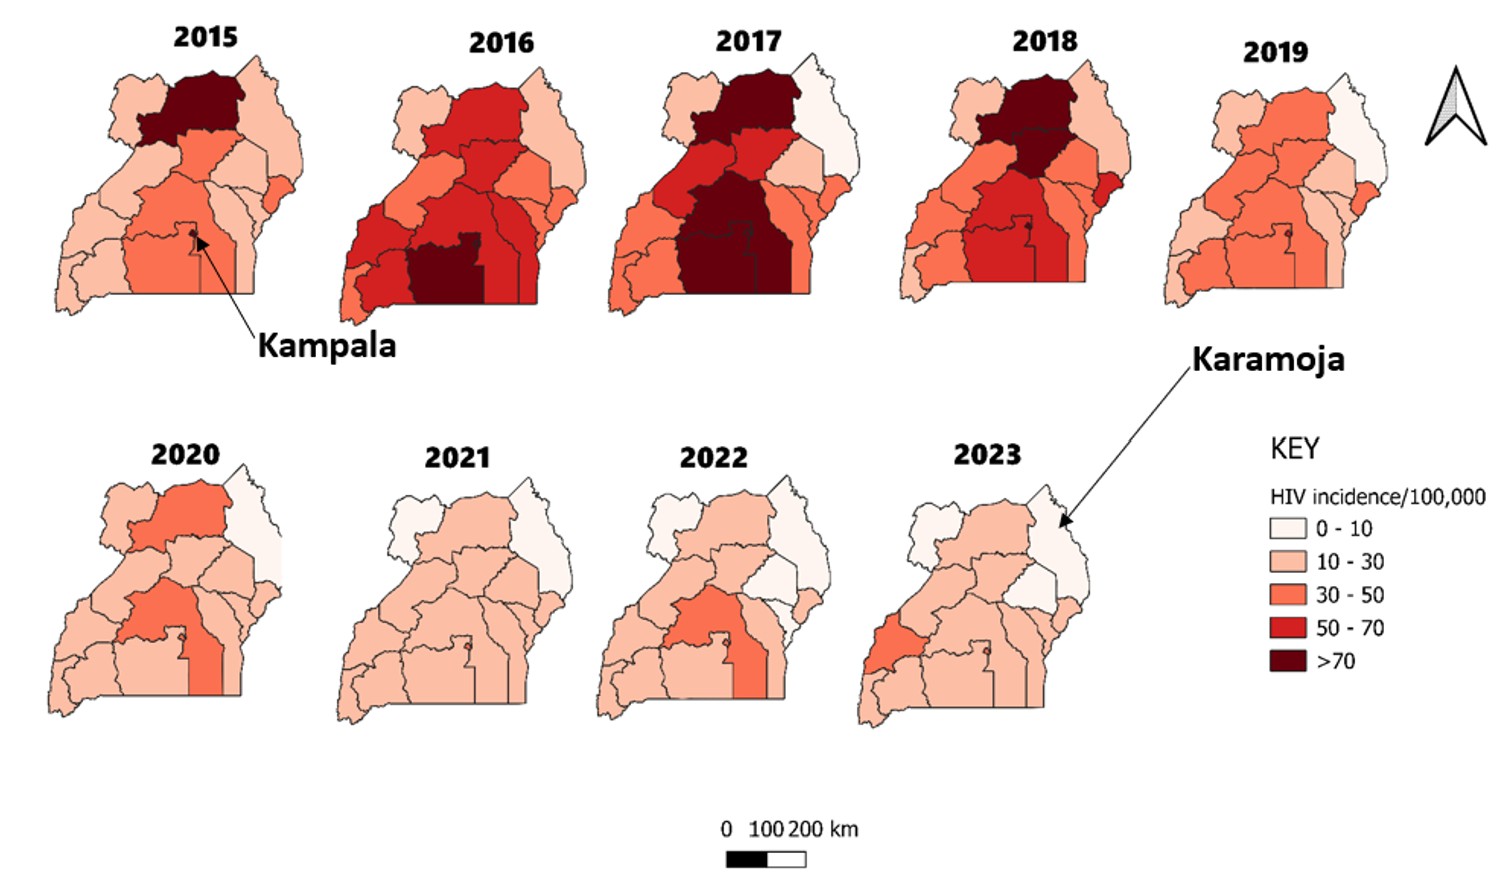
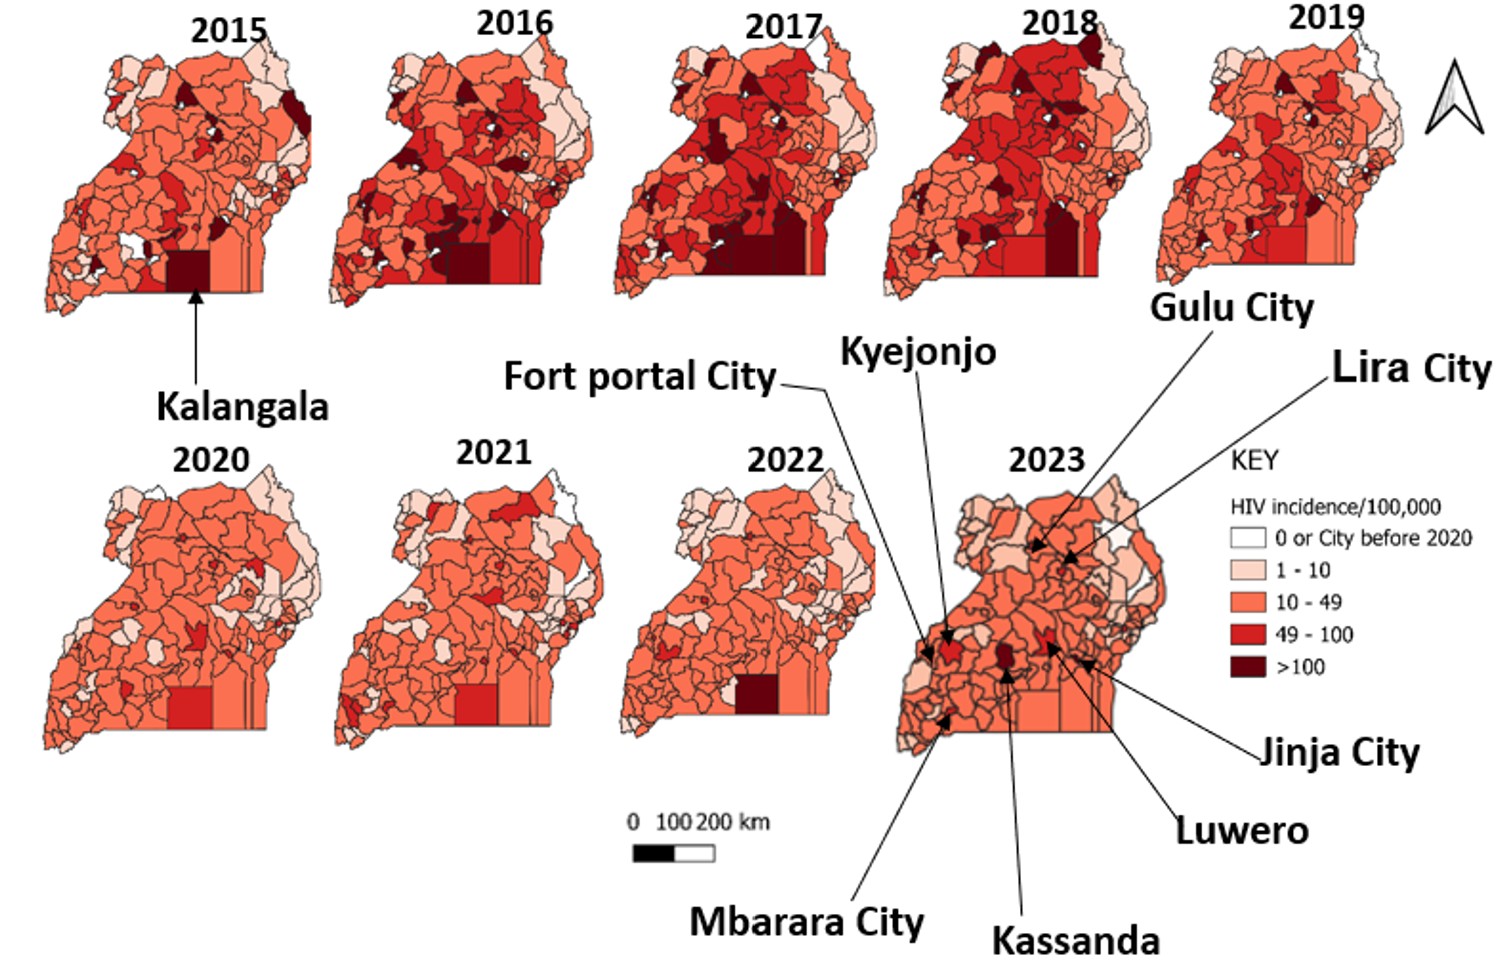
Kampala region had the persistently highest diagnosed HIV incidence throughout the study period, and the Karamoja region had the lowest (Figure 3). From 2016 to 2018, there was the highest diagnosed HIV incidence among children aged 0-14 years. After 2018, the HIV incidence declined to reach its lowest in 2021.
Kalangala District persistently had a high diagnosed HIV incidence among children throughout the study period (Figure 4). Districts of Kassanda, Luwero, and Kyenjonjo, and cities of Jinja, Gulu, Lira, Mbarara and Fort Portal had increasing diagnosed HIV incidence from 2021 to 2023.
We found that diagnosed pediatric HIV incidence in Uganda declined significantly from 2015 to 2023, although progress increased in earlier years and plateaued in the later years. Incidence was highest among females, particularly those aged 10-14 years, and among children younger than five years. While overall incidence declined nationally, there were regional and sub-regional disparities. Kampala Region and Kalangala persistently had high or increasing incidence, while Karamoja persistently had low incidence. Some rural districts, including Kassanda and Luwero, and several cities showed an increasing incidence.
The overall decline likely reflects the cumulative impact of Uganda’s adoption of the Universal Test and Treat policy after 2016, alongside other combination HIV prevention strategies such as voluntary medical male circumcision and behavior change communication campaigns [15–19]. However, from 2020 to 2023, the trend plateaued, suggesting a possible stagnation in the effectiveness or reach of these interventions. Achieving the goal of zero new pediatric HIV infections by 2030 remains uncertain unless efforts are revitalized—particularly through the strengthening of elimination of mother-to-child transmission (eMTCT) programs and targeting adolescent girls, who remain disproportionately vulnerable [20]. The sharp fluctuations between 2015 and 2016, and thereafter, may reflect improved reporting, expanded testing, or backlog clearance rather than true epidemiological shifts. The 2016 rollout of the Test and Treat policy likely contributed to increased case detection, suggesting some changes may be data artifacts rather than actual incidence spikes.
Female children consistently had higher diagnosed HIV incidence than male children throughout the study period. Additionally, female children, aged 10-14 years, were the most affected and consistently had higher diagnosed HIV incidences throughout the study period. However, we could not determine the route or timing of acquisition, such as mother-to-child transmission versus horizontal acquisition, nor could we distinguish incident infections from delayed diagnosis because DHIS2 did not provide such data. Therefore, these findings should be interpreted as sex- and age-specific differences in diagnosis rates rather than differences in infection risk. Nonetheless, the observed pattern is consistent with the literature showing higher HIV burden among adolescent girls, potentially reflecting a combination of sociocultural and biological complex factors such as gender norms and unequal power in relationships, stigma and discrimination, transactional and age-disparate relationships, early marriage or sexual violence, and limited access to education and economic resources [21–23]. Strengthening existing interventions including accessible HIV testing, optimized antiretroviral treatment, comprehensive care, and efforts to address social and gender-based barriers remains critical to reducing new infections among young girls and achieving the 2030 targets [24].
Children <5 years old had higher diagnosed HIV incidence than the other age groups throughout the entire study period. This agrees that mother-to-child transmission of HIV infections continues to account for the majority of infections under this age group [1,24,25]. While Uganda has implemented universal HIV testing and other prevention strategies, challenges remain in optimizing service delivery for children and adolescents. Strengthening differentiated service delivery (DSD) mode such as expanding community-based ART delivery, standardizing eligibility criteria, and aligning policies with WHO recommendation, can enhance access and retention in care for pediatric populations [26]. These efforts are crucial to achieving the goal of zero new HIV infections among children by 2030.
While children aged <5 years had a higher diagnosed HIV incidence than those aged 5-14 years, over half of the new HIV diagnoses occurred among children >5 years. This may represent delayed diagnosis of HIV infection beyond the Early Infant Diagnosis stage of below 2 years and may have been recorded as prevalent cases and not incident cases. Additionally, DHIS2 data did not include testing coverage or age at first positive test, this explanation could not be directly assessed. Among children aged 10–14 years, the observed diagnoses should be interpreted cautiously. These cases may reflect delayed diagnosis of vertically acquired infection, previously undiagnosed prevalent infection, or a subset of infections acquired during later childhood or early adolescence. In early adolescence, possible contributors to horizontally acquired infection may include early sexual debut, sexual coercion or exploitation, age-disparate relationships, and other gender-related barriers that increase vulnerability, particularly among girls [27,28]. However, these pathways could not be directly assessed in our aggregated DHIS2 data
Although the national pediatric diagnosed HIV incidence declined over the study period, this decline was not uniform across Uganda. At the regional level, Kampala, an urban area, remained a persistently high-burden region, while Karamoja, a nomadic pastoralist region, remained the lowest burden region. At the sub-regional level, several cities and districts, including Fort Portal, Mbarara, Lira, Jinja, Kalangala, Kassanda, Luwero, and Kyenjojo, showed persistent high burden or recent increases, suggesting that national gains were accompanied by localized areas of lagging progress. Interventions and strategies to prevent HIV infections among children should be targeted at cities of Gulu, Jinja, Mbarara, Fort Portal and Lira, experiencing an increase in recent diagnosed HIV incidence, where urbanization, high population mobility, and informal settlements contribute to heightened transmission risks. Additionally, efforts should focus on districts with rising pediatric diagnosed HIV incidence, such as Kalangala, Kassanda, Kyenjojo, and Luwero, where there are specific contextual factors. Kalangala is an island district in Lake Victoria with scattered hard-to-reach communities, fishing communities and limited access to pediatric HIV services likely contributed to the rise in infections [29]. Kassanda, Luwero and Kyenjonjo are rural districts with underserved populations and limited health infrastructure. To achieve zero HIV transmission in children by 2030, it is essential to strengthen localized HIV prevention programs in these high-burden areas, particularly early infant diagnosis and the complete elimination of the mother-to-child transmission program.
Study limitations
We used secondary data aggregated in an electronic HMIS, and therefore, we could not analyse other variables such as the mean and place of residence. Second, descriptive analyses based on routinely reported surveillance data are susceptible to reporting bias due to delayed reporting, duplicate reporting, under-reporting, or missing data on newly identified HIV cases from health facilities, which can lead to underestimation or overestimation of HIV incidence. However, we included reporting rates to provide a context for surveillance data quality over time.
Third, in this study, diagnosed HIV incidence was defined as the annual number of newly diagnosed HIV-positive children aged 0–14 years per 100,000 children at risk. However, it is important to note that this may not represent true HIV incidence in the epidemiological sense, which refers to the actual number of new infections occurring in a population over a given period. Instead, our study measures diagnosed cases, meaning some infections may have occurred earlier but were only detected at the time of testing. This operational definition provides a practical estimate of HIV trends in the absence of case-based surveillance or recency testing for children under 15 years in Uganda. While this may differ from the epidemiological definition of HIV incidence based on transmission dynamics, it provides a useful proxy for assessing trends in HIV diagnoses in the absence of case-based surveillance systems or recency testing for children under 15 years in Uganda [30,31].
The WHO document on estimating HIV incidence using case surveillance acknowledges that routine case surveillance data can be adapted for incidence estimation with clear definitions and context-specific adjustments. While incidence assays are the gold standard for measuring the recency of HIV infections, these are not currently available for children under 15 years in Uganda. The approach used in this study reflects the pragmatic use of available data to analyze trends and inform policy. In addition, because this operational measure is based on diagnosed cases captured through routine surveillance, observed temporal changes may reflect not only underlying transmission dynamics but also changes in HIV testing coverage, timing of diagnosis, case detection, and reporting completeness over time.
The DHIS2 data used in this analysis were aggregated and did not contain individual-level information on timing or mode of HIV acquisition; therefore, we could not distinguish vertically acquired infection, including mother-to-child transmission, from horizontally acquired infection among children diagnosed during the study period. Denominator estimates were derived from official UBOS population projections based on the 2014 census using a uniform annual growth rate of 3.1%. However, this approach may not fully capture age-specific, sex-specific, or subnational variation in the pediatric population at risk over the study period. Despite these limitations, the study provides valuable national and subnational evidence from routine surveillance data over a nine-year period and highlights important temporal and geographic patterns relevant for pediatric HIV programming in Uganda.
During 2015–2023, diagnosed pediatric HIV incidence in Uganda declined overall, although the trend was non-linear and remained uneven across population groups and geographical areas. The diagnosed incidence remained disproportionately high among females aged 10-14 years and children under 5 years of age. Regional disparities in diagnosed HIV incidence further underscore the necessity for tailored, context-specific interventions that consider local epidemiological trends. To accelerate progress toward the goal of zero new HIV infections by 2030, it is necessary to enhance the elimination of mother-to-child transmission programs, with a focus on improving service access and uptake in regions with high HIV burden. Furthermore, strengthening adolescent-focused programs targeting females aged 10-14 years, who continue to bear a disproportionate burden, is essential. Concentrating efforts such as community-based ART delivery and DSD on high-burden districts and cities through more focused interventions will be crucial for further reducing HIV incidence in this population.
What is already known about the topic
What this study adds
The project was supported by the President’s Emergency Plan for AIDS Relief (PEPFAR) through the United States Centers for Disease Control and Prevention Cooperative Agreement number GH001353-01 through the Makerere University School of Public Health to the Uganda Public Health Fellowship Program, Ministry of Health. The findings and conclusions in this report are those of the authors and do not necessarily represent the official views of the US Centers for Disease Control and Prevention, the Department of Health and Human Services, the Agency for Toxic Substances and Disease Registry, the Makerere University School of Public Health, or the Uganda Ministry of Health.
Data availability
The datasets on which our findings are based belong to the Uganda Public Health Fellowship Program and the MoH. For confidentiality reasons, the datasets are not publicly available. However, the datasets are available upon reasonable request from the corresponding author with permission from the Uganda Public Health Fellowship Program and MoH.
DW conceptualized the idea, analyzed and interpreted the data, and drafted the manuscript. EM analyzed part of the data. RM, BK, HTN, LB, and ARA reviewed the manuscript for intellectual content.
Supplementary Files
Supplementary File 1:Population_Projections_2015-2030_UBOS (115 downloads)
| Characteristic (N=63,599) | Frequency | (%) |
|---|---|---|
| Gender | ||
| Female | 33,288 | 52.3 |
| Male | 30,311 | 47.7 |
| Age group (in years) | ||
| <5 | 27,688 | 43.5 |
| 5-9 | 17,502 | 27.5 |
| 10-14 | 18,409 | 28.9 |