Research![]() | Volume 8 (1), Article 7, 09 Apr 2025
| Volume 8 (1), Article 7, 09 Apr 2025
Abiodun Ebenezer Kolapo1,2, Olufunmilayo Ibitola Fawole3, Joshua Odunayo Akinyemi3, Magbagbeola David Dairo3, Muhammad Shakir Balogun4
1Nigeria Field Epidemiology and Laboratory Training Programme, Abuja, Nigeria, 2Kwara State Primary Health Care Development Agency, Ilorin, Nigeria, 3Department of Epidemiology and Medical Statistics, Faculty of Public Health, College of Medicine, University of Ibadan, Nigeria, 4Africa Field Epidemiology Network, Abuja, Nigeria
&Corresponding author: Abiodun Ebenezer Kolapo, Southern Africa Regional Coordinating Centre, Africa CDC, Stand 1186, Cnr Addis Ababa Drive & Chaoli Road, Lusaka, 10101, Zambia. Email address: abkolapo@gmail.com
Received: 30 May 2024, Accepted: 06 Feb 2025, Published: 09 Mar 2025
Domain: COVID-19, Vaccinology
Keywords: COVID-19, COVID-19 vaccine, vaccine acceptance, 7C vaccination readiness scale
This article is published as part of the Eighth AFENET Scientific Conference Supplement: Volume Two, commissioned by
African Field Epidemiology Network
Ground Floor, Wings B & C
Lugogo House
Plot 42, Lugogo By-Pass
PO Box 12874 Kampala
Uganda.
©Abiodun Ebenezer Kolapo et al Journal of Interventional Epidemiology and Public Health (ISSN: 2664-2824). This is an Open Access article distributed under the terms of the Creative Commons Attribution International 4.0 License (https://creativecommons.org/licenses/by/4.0/), which permits unrestricted use, distribution, and reproduction in any medium, provided the original work is properly cited.
Cite this article: Abiodun Ebenezer Kolapo et al Determinants of COVID-19 vaccine acceptance among residents of Ilorin metropolis, Nigeria, 2023: A community-based cluster survey. Journal of Interventional Epidemiology and Public Health. 2025;8(1):7. https://doi.org/10.37432/jieph.supp.2025.8.2.12.9
Introduction: At least 70% of the eligible population in Nigeria must be vaccinated for the country to achieve herd immunity against COVID-19. Suboptimal vaccine acceptance could delay the timely achievement of this objective. We investigated to determine the prevalence of COVID-19 acceptance, the factors influencing COVID-19 vaccine acceptance and the determinants of incomplete COVID-19 vaccination among residents of Ilorin metropolis, Nigeria.
Methods: Adopting a community-based cluster design, we collected data from a representative sample of 861 respondents in 30 enumeration areas of Ilorin metropolis selected proportionally to their estimated population. We used a questionnaire adapted from the 7C vaccination readiness scale which includes dimensions of confidence, complacency, constraints, calculation, collective responsibility, compliance and conspiracy. We performed descriptive and bivariate analyses. We used the chi-square test to evaluate associations between dependent and independent variables and conducted multivariate logistic regression to predict acceptance of a COVID-19 vaccine at a p-value of < 0.05.
Results: COVID-19 vaccine acceptance was 61% (n = 524/861, 95% CI: 0.58 to 0. 64). Of these, 339 (67.3%) had been completely vaccinated. The most common reason for non-completion of primary vaccine series was ´I have enough immunity. Multivariate logistic regression showed that COVID-19 vaccine acceptance was higher in individuals aged 40-49 years (AOR: 2.62, 95% CI: 1.37 – 5.00). Other predictive variables included belief in the existence of COVID-19 (AOR: 3.04, 95% CI: 1.72 – 5.36), confidence (AOR: 0.78, 95% CI: 0.72-0.85), collective responsibility (AOR: 0.73, 95% CI: 0.67-0.80); complacency (AOR: 1.43, 95% CI: 1.26 – 1.61) and calculations (AOR: 0.88, 95% CI: 0.80-0.96)
Conclusion: The prevalence of COVID-19 vaccine acceptance was sub-optimal, with age and belief in the existence of COVID-19 being significant predictors. We recommend targeted interventional strategies to increase vaccine acceptance among middle-aged individuals, address misconceptions about immunity to optimize vaccination completion, and enhance evidence-based public health campaigns to inform the public.
The COVID-19 pandemic, which started as a cluster of pneumonia-like cases in Wuhan, Hubei province of China, in December 2019, currently shows no indication of abating in the foreseeable future [1]. It spread rapidly across China, causing an epidemic, followed by a worldwide spread[1]. The global spread of the infection propelled the World Health Organisation to designate it as a pandemic by March 2020 [2]. As of 17 March 2023, more than 761 million cases have been confirmed globally with more than 6.8 million mortalities [3]. The infectious disease, first reported in Nigeria on 27 February 2020, has been confirmed positive in 266,652 subjects with 3,155 deaths as of 17 March 2023 [4].
The necessity and urgency of an effective vaccine cannot be overstated if economies and health systems will be protected from continuous disruptions and populations saved from the virus. However, the success of a safe and efficacious COVID-19 vaccine is contingent on the level of its acceptance and uptake by individuals and the general population [5-7]. The first shipment of AstraZeneca COVID-19 vaccines via the COVVAX facility arrived in Nigeria on 2 March 2021, and vaccination started on 5 March, 2021 [8]. As of 19 March 2023, Nigerians have received 116, 606, 863 doses of vaccines. Adults-individuals 18 years and older-were declared eligible for vaccination. At the time of the research, there was no efficacy or safety data for children or adolescents under the age of 18. Thus, persons under 18 were excluded from vaccination until such data became available. A total of 56 million Nigerians have been fully vaccinated, representing 50.6% of the targeted 111.7 million eligible population[3, 9].
In a study carried out in Nigeria, only 40.8% indicated a willingness to receive the vaccine if available [10]. In 2020, the Africa CDC conducted nationally representative surveys on people’s perceptions of COVID-19 vaccines in 15 African countries, including Nigeria. The results demonstrated willingness to be vaccinated in 80% of the people [11]. Research has shown that a poor confidence in vaccines (doubts about the safety and effectiveness of the vaccines) and providers, misinformation about COVID-19, complacency towards the need for vaccination, and vaccine inconvenience relating to unaffordability and costs are the main drivers of vaccine hesitancy globally [12,13].
A low uptake level or paucity of intention to be vaccinated can be understood within the concept of a complex behaviour known as hesitancy [14]. The World Health Organisation (WHO) Strategic Advisory Group of Experts on immunisation (SAGE) defines vaccine hesitancy as: “delay in acceptance or refusal of vaccines despite availability of vaccine services” [15]. The impact of ‘acceptance and, more importantly, its inverse – hesitancy, is so vital that the WHO in 2019 identified it as one of the top 10 threats to global health [16, 17]. Vaccine hesitancy could lead to rejection or delay of vaccination, and these may eventually cause a reduction in the coverage rate of the vaccine and thereby increase the morbidities and mortalities attributable to COVID-19 [18].
A constellation of factors such as conspiracy theories have hampered current efforts to control the COVID-19 pandemic [19]. Overcoming this trend and identifying those likely to be hesitant are critical to slowing down the pandemic and will require targeted communication strategies that will effectively reach populations refusing COVID-19 vaccination. Further, vaccine hesitancy control strategies must also be evidence-based to address the primary concerns of the vaccine-hesitant. This research aims to answer these critical questions. This study builds upon previous research on determinants of COVID-19 vaccine acceptance by adding novel insight on current level of readiness to be vaccinated and factors responsible for incomplete vaccination, using the 7C vaccination readiness scale.
This study conducted among residents of Ilorin metropolis in North central Nigeria seeks to determine the prevalence of COVID-19 vaccine acceptance, assess readiness to be vaccinated against COVID-19, determine factors influencing receipt of COVID-19 vaccine among residents of Ilorin metropolis, and identify factors responsible for incomplete COVID-19 vaccination among some residents of Ilorin metropolis.
Study Area and Population
The survey was conducted among residents of Ilorin metropolis, comprising Ilorin West, Ilorin East and Ilorin South Local Government Areas. Ilorin is the capital city and the largest urban centre in the state. The city had a projected population of 1,030,500 as at 31 December 2023, with an annual growth rate of 2.3% [20]. There are 229 public and private health facilities in the city, including two tertiary hospitals, the University of Ilorin Teaching Hospital and the General Hospital Ilorin. Routine vaccination services are provided in 129 of these facilities across the city, distributed as follows: Ilorin West -46, Ilorin East-32 and Ilorin South-51. Twenty four of the health facilities were designated for COVID-19 vaccination during the outbreak, in addition to about 17 mobile sites. All confirmed cases of COVID-19 were isolated and managed at the COVID-19/Infectious Disease Centre Sobi (Alagbado) Ilorin [21]. All adults (persons aged 18 years and above), male and female, who had lived in the locality for at least three months were included in the research. All persons who were sick or who were unwilling to participate in the study were excluded from the study
Sample Size Determination
We used the method in the WHO immunisation coverage cluster survey reference manual [22] to determine the sample size based on previous coverage of 50.6%, significance level of 5 % corresponding to a standard normal deviate (z) of 1.96, precision of 5 % and design effect (DEFF) of 2 and obtained a minimum sample size of 768. The final sample size was 853, calculated using the formula Adjusted Sample \( \text{Size} = \frac{1}{(1 – f) \cdot N} \)
after considering a non-response rate of 10% (f = 0.90) and the initial target of 768 respondents.
Sampling Technique
The study was a cross-sectional descriptive research design, utilising a three-stage household-level cluster approach adapted from the WHO EPI 30 cluster survey methodology. In this design, the sampling unit was the individual subject, although the sampling was conducted on the household level. We obtained a list of enumeration areas (EA) in Ilorin metropolis from the National Population Commission (NPC). This included all 35 political wards in the three local government areas (LGAs) in the city, namely Ilorin West [12], Ilorin East [12], and Ilorin South [11]. These EAs, also known as political wards in Nigeria, served as the primary sampling units (clusters).
In the first stage, we selected 10 clusters from each of the three LGAs in Ilorin using probability proportionate to size sampling. The clusters selected from Ilorin West included Adewole, Ajikobi, Baboko, Badari, Balogun Alanamu Central, Magaji Ngeri, Oloje, Ogidi, Oko Erin and Warrah/Egbejila/Osin wards. Clusters from Ilorin East LGA included Apado, Balogun Gambari 1, Balogun Gambari II, Ibagun, Iponrin, Magaji Are I, Magaji Are II, Marafa/Pepele, Oke Oyi/Oke Ose/Alalubosa and Zango. Clusters from Ilorin South were Akanbi II, Akanbi III, Akanbi IV, Akanbi V, Balogun Gambari I, Balogun Fulani II, Balogun Fulani III, Okaka I, Okaka II and Oke Ogun. Thus, a total of 30 clusters were selected.
In the second stage, respondents were enrolled from selected contiguous households radiating from a randomly chosen point at the geographic centre of the cluster following the principle of the next nearest household. Interviewers randomly chose the direction of data collection using the spinning bottle method: a bottle was spun on level ground, and the direction indicated by its pointed end when it stopped guided the interviewers’ path. Thus, the teams followed a standardised path. Recruitment of willing adults continued consecutively until the within-cluster sample size of 29 was achieved. In the third stage, all eligible adults in a household were interviewed.
To ensure representativeness, the 30 clusters were selected proportionally from 35 total wards across three LGAs. Within each LGA, clusters were selected using probability proportional to size (PPS), ensuring that wards with larger populations had a higher chance of selection. This combined approach of proportional allocation and PPS ensured representativeness.
The proportional allocation formula used was:
Number of clusters from each
\( \text{LGA} = \left( \frac{\text{Total wards in LGA}}{\text{Total wards across LGAs}} \right) \times \text{Total clusters to be selected} \)
Based on this formula:
\( \text{Ilorin West (12 wards)}: \left( \frac{12}{35} \right) \times 30 = 10.29 \)
\( \text{Ilorin East (12 wards)}: \left( \frac{12}{35} \right) \times 30 = 10.29 \)
\( \text{Ilorin South (11 wards)}: \left( \frac{11}{35} \right) \times 30 = 9.42 \)
The LGAs with over-allocation were adjusted to equalize proportionality and approximate the total number of clusters for each LGA to 10.
The study involved 3 LGAs, each containing 10 clusters. The calculated sample size was 853, which, when divided by 30, yielded approximately 29 respondents per cluster. Thus, 29 respondents were sampled from each of the 30 clusters, resulting in a total of 870 respondents. After discarding 9 incomplete entries, 861 respondents remained for analysis.
Study Instrument
Data was collected using an interviewer-administered questionnaire adapted from the 7C vaccination readiness scale, originally developed by Geiger et al. [23]. Data was collected by the researcher and a team of five trained research assistants. The questionnaire contained three sections encompassing socio-demographic detail, COVID-19 vaccination history and lastly the adapted 7C vaccination scale. Each of the seven subscales of the 7C model, namely confidence, complacency, constraint, calculation, collective responsibility, conspiracy and compliance, was assessed by 3 rating items on a 3-point Likert scale (original scale used a 7-point Likert scale). All items were scored as follows: 3 ‘Agree’; 2 ‘Neutral’; and 1 ‘Disagree’. All items in the domains complacency (‘It is unnecessary to receive the vaccine as it cannot prevent COVID- 19 and its many strains’; ‘I believe my immune system is powerful enough to protect me from getting COVID-19’; and ‘I don’t believe COVID-19 is as deadly as people take it to be’), calculations (‘I have to first weigh the benefits and risks to decide to be vaccinated’; ‘I will first consider whether the vaccine is effective or not before deciding for it’; and ‘I get vaccinated when I do not see the disadvantages for me’), conspiracy (‘COVID-19 vaccine contains microchips to control humans’; ‘The vaccine is designed by the West to kill and reduce the world’s population’; and ‘The vaccine is designed to tamper with our genome (DNA)’) and items one and two of constraints (‘I don’t have the time to go and receive the vaccines’ and ‘Vaccines were unavailable when I registered/ made inquiries’) were reverse coded. Mean scores of items under each domain were computed, with higher average score indicating higher levels of vaccine readiness. The Cronbach’s alpha for the scale in this study was 0.865, indicating a good internal consistency of the data set.
Data Management
Dependent Variable: The primary outcome of interest (the dependent variable) was the response to the question “Have you been vaccinated against COVID-19?” The response was dichotomous: yes or no.
Independent Variables: The independent variables consisted of socio-demographic detail, including: age (18-29, 30-39, 40-48, 50-59, 60-69, ≥ 70), sex (male, female), marital status (currently married, currently unmarried), level of education ( none, primary, secondary, tertiary), occupation (health-related, non-health-related), religion (Christianity, Islam, others) ; COVID-19 related information, such as belief in the existence of COVID-19 (assessed with options, ‘yes’, ‘no’ and ‘unsure’), history of infection with COVID-19 (assessed with options, ‘yes’ and a ‘no’), knowledge of anyone who had been infected with COVID-19 (assessed with options, ‘yes’ and a ‘no’), and 21 items of the 7C Vaccination readiness scale, assessed on a 3-point Likert scale of ‘disagree’, ‘neutral’ and ‘agree’.
Data Analysis
Data was cleaned with MS Excel and analysed with Stata MP Version 15. Descriptive statistics were reported using frequency and percentages for categorical variables and mean and standard deviations for continuous variables. The Chi Square test was used in bivariate analysis to test associations between the primary outcome of interest (“Have you been vaccinated against COVID-19?), and independent variables. The vaccinated group served as the comparison in the bivariate analysis. Multivariable logistic regression analysis was conducted to determine the predictors of COVID-19 vaccine acceptance. A p< 0.05 was considered statistically significant. Variables with more than two sub-variables were dichotomized in logistic regression using ‘dummy coding’. In Stata, which was used for the analysis of this work, this process was automated by simply adding the prefix ‘i.’ to a categorical variable. This method treats the first sub-variable as the reference (comparison group), and all others are compared with it.
Operational terms
Household: People who live together for at least a month under the same roof and share cooking and eating facilities from the same source.
Acceptors: All persons who answered “yes” to the question, “Have you been vaccinated against COVID-19?” regardless of whether the primary vaccinations have been completed or not.
Hesitant / rejecters: All person who answered “no” to the question, “Have you been vaccinated against COVID-19?”
Complete vaccination: All individuals who have been administered their two primary vaccinations or who received the one dose of Jansen & Jansen vaccine.
Incomplete vaccination: All individuals who have had only a dose of the two primary COVID-19 vaccines.
Ethical Consideration
We obtained ethical approval for the research from the Research and Ethics Committee of the Kwara State Ministry of Health, Nigeria with the approval I.D ERC/MOH/2021/10/004. All procedures performed in this study involving human participants complied with the institutional and/or national research committee ethical standards, the 1964 Helsinki declaration and subsequent amendments [24]. Participants were provided with the detailed objectives of the study, the survey and the investigators. All participants gave their verbal informed consent before participating in the survey. Strict anonymity was ensured for each respondent and choice of voluntary participation or withdrawal was clearly spelt out. The benefits of the research were lucidly communicated to all respondents.
A total of 861 respondents participated in the research. The mean age of participants was 34 years (SD = 12). The majority of participants identified as female (n = 437, 50.8%). Participants who had some form of tertiary education had the highest representation (n =547, 63.5%). A greater number of respondents were currently married (n = 509, 59.2%). About 10% (85/861) of the respondents were engaged in some form of health-related occupation. The vast majority of respondents believed in the existence of COVID-19 (n =651, 75.6%). A hundred and twelve respondents (13%) were unsure of COVID-19 existence, while the remaining 11% denied the existence of the pandemic. A greater number of the respondents did not know anyone who had been infected with the disease (n = 725, 84.3%). Less than 3% of the participants reported a history of infection with COVID-19. About 61% (n =524) of the participants reported a history of COVID-19 vaccination. Five hundred and four of the respondents (58.6%) had received at least one dose of the COVID-19 vaccine (Table 1).
Most respondents agreed that COVID-19 vaccines are safe (56.2%) and effective (54.2%), though over a quarter remained skeptical. Collective responsibility was a strong motivator (65.9%). Constraints like vaccine unavailability (56.8%) were common. While most rejected conspiracy theories (68.7%), vaccine mandates remained controversial, with 60.9% neutral on job restrictions (Table 2).
The mean readiness score was 38 ± 8.57, which is about 60% of the total score (max score: 63). The component conspiracy had the highest mean score (6.43 ± 1.54) while the collective responsibility domain had the lowest mean score (4.63 ± 2.20) (Table 3).
Covariates identified to have statistically significant effects on acceptance of the COVID-19 vaccine included age (Χ2 = 21.5, p-value <0.001); marital status (Χ2 = 5.5, p-value = 0.023); belief in COVID-19 existence (Χ2 = 102, p-value <0.001); knowing someone who had been infected with COVID-19 (Χ2 = 11.8, p-value < 0.001; and history of previous COVID-19 infection (Χ2 = 7.4, p-value = 0.005). All 7C domains, namely: confidence (Χ<sup>2</sup> = 255.4, p-value <0.001), collective responsibility (Χ2 = 258.1, p-value <0.001), calculation (Χ2= 63.1, p-value <0.001), complacency (Χ2= 97.3, p-value <0.001), constraint (Χ2 = 78.6, p-value <0.001), compliance (Χ2 = 35.5, p-value <0.001), and conspiracy (Χ2 = 78.4, p-value <0.001), showed significant association with vaccination status. Educational level, religion and occupation showed no statistical significance (Table 4).
In the unadjusted multivariable logistic model, participants within the age brackets 30-39 and 40 – 49 were more likely to be vaccinated compared to those below 30 years (COR = 1.64, 95% CI: 1.18-2.29, p-value = 0.003) and (COR = 2.48, 95% CI: 1.65-3.75, p-value < 0.001) respectively. Being currently married was associated with 28% lower odds of vaccine acceptance (COR=0.72, 95% CI: 0.54-1.02, p-value = 0.02). The predicted odds for those who believed in the existence of the virus was 7.26 times the odds for who did not believe (COR = 7.26, 95% CI: 4.44-11.86, p-value < 0.001). Also, participants who had known someone who was previously infected with COVID-19, were more likely to get vaccinated than those who had no such knowledge (COR = 2.03, 95% CI: 1.35-3.08, p-value < 0.001).
The unadjusted model identified five of the seven subscales of the 7C Vaccination readiness scale as being negatively associated COVID-19 vaccine acceptance, namely: Confidence (COR = 0.69, 95% CI: 0.65-0.74, p-value <0.001), collective responsibility (COR= 0.63, 95% CI: 0.59 – 0.68, p-value <0.001), calculations (COR = 0.82, 95% CI: 0.77-0.88, p-value <0.001), constraints (COR= 0.91, 95% CI: 0.83-0.99, p-value = 0.035) and conspiracy (COR = 0.83, 95% CI: 0.76-0.92, p-value <0.001). Complacency has a positive but weak association with vaccine acceptance (COR: 1.09, 95% CI: 1.00-1.20, p-value = 0.032)
In the adjusted model, respondents in the age groups 30-39 (AOR: 1.85 95% CI: 1.12-3.04, p-value = 0.015), 40-49 (AOR: 3.60, 95% CI: 1.94-6.70, p-value <0.00), and 50-59 (AOR: 2.26; 95% CI: 1.00-5.07, p-value = 0.048) were more likely to accept COVID-19 vaccine than those below 30 years. Participants who believed in the existence of the virus were 3 times as likely to accept the vaccine as those who disbelieved (AOR: 3.04, 95% CI: 1.72 – 5.36 p-value <0.001). The domains: confidence (AOR: 0.78, 95% CI: 0.72-0.85, pvalue < 0.001); complacency (AOR: 1.43, 95% CI: 1.26-1.61, p-value < 0.001) collective responsibility (AOR: 0.73, 95% CI: 0.60-0.85, p-value < 0.001); and calculations (AOR: 0.88, 95% CI: 0.80-0.96, p-value = 0.003) remained statistically significant in the multivariable model (Table 5).
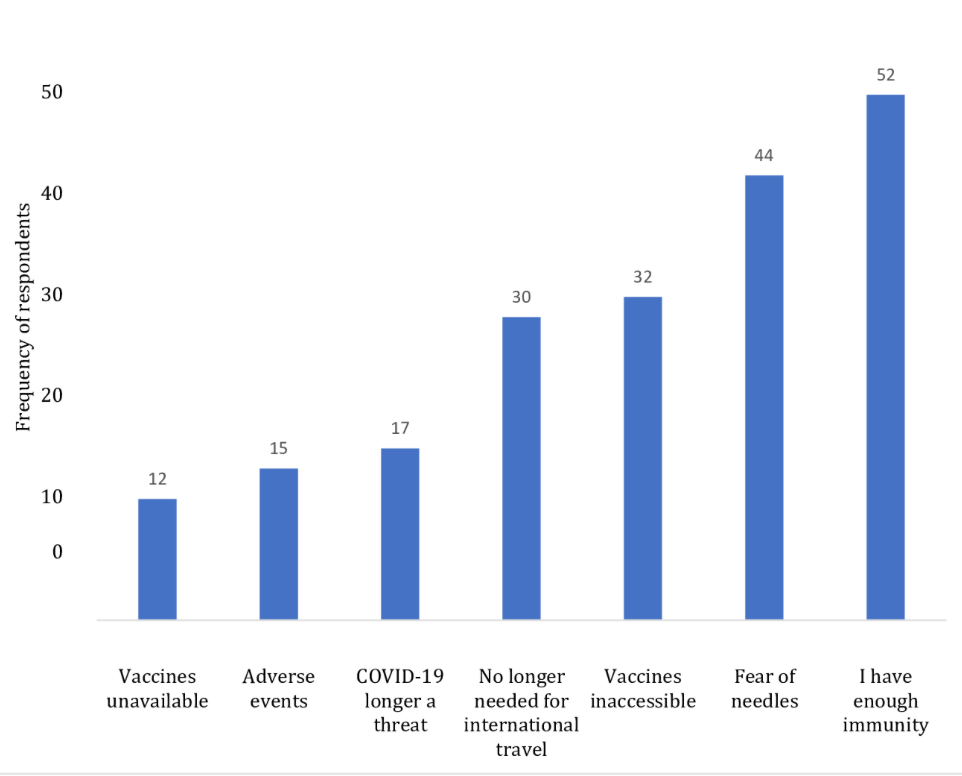
Reasons for non-completion of primary vaccination schedule
The most common reason for non-completion of the vaccine series was that many participants thought they had developed enough immunity with the initial dose (Figure 1)
The COVID-19 vaccination acceptance rate of 61% found in this study is above the average national coverage rate currently at 55.2% (as of January 2023). It is instructive to note that vaccine uptake or coverage rates do not actually represent the true acceptance of vaccine in a place as it does not consider ready acceptance or hesitancy to a vaccine. The overall readiness score of 60% in the population obtained in this study, includes those already vaccinated, as well as the unvaccinated. The present coverage rate stands to increase by additional 7% if the system is able to capture the 64 respondents who indicated willingness to be vaccinated.
Compared to predictions and results of research before the roll out of vaccines, much more people appear to be ready to take the vaccine now than ever. An earlier study done in Nigeria had indicated that only 40.8% were willing to receive the vaccine if available [10], whereas about 80% indicated readiness to receive the vaccine in a study conducted by the African Centers for Disease Control in 15 African countries, including Nigeria [10, 11] The differences in levels of willingness are likely spatiotemporal, as different factors drive vaccine acceptance or refusal in different climes at different times. The current level of readiness found by this research could have been borne out of improved awareness and a heightened COVID-19 risk perception over the past two years. Again, most of the conspiracy theories have been dispelled as myths, and very few adverse events of special interest are reported in Nigeria.
The findings of our study showed that individuals within the age bracket of 30 – 59 were more likely to accept the vaccine than others. This finding aligns with a Ugandan study that showed that younger age groups, particularly those aged 13-29, were less likely to accept COVID-19 vaccine and that individuals aged 40-49 were more likely to accept the vaccine than others. Young people might be more skeptical or less concerned about the risks of COVID-19, while middle-aged adults are more likely to accept the COVID-19 vaccine, likely due to perceived vulnerability, health risks and work-related requirements. This finding underscores the need for targeted vaccination strategies tailored to different age groups. Public health campaigns should focus on addressing vaccine hesitancy in younger individuals (<30) and emphasize the importance of vaccination for both personal and community protection.
Research findings have given a mixed picture about the influence of education on COVID-19 vaccine acceptance, with some establishing a significant connection and others not. Our study found that educational level did not significantly increase vaccine acceptance. This finding accords well with certain studies from Nigeria and some other countries. Regardless of educational background, misinformation and conspiracy theories about the vaccine are widespread on the social media and other channels. Many people, including those with higher levels of education are influenced by these narratives, leading to vaccine hesitancy.
Additionally, the pervasive influence of the COVID-19 misinfodemic, varying levels of trust in healthcare systems, the strong role of cultural and social factors, and individual risk-benefit perceptions may have had a stronger impact on vaccine acceptance than education. The finding highlights the need for public health initiatives to focus on building trust, countering misinformation, and tailoring approaches to address diverse socio-cultural and psychological factors influencing vaccine acceptance.
Our finding shows that higher levels of confidence in the vaccine safety and effectiveness decrease COVID-19 vaccine acceptance. This result contradicts another Nigerian study [25] and studies from several other countries, including Japan [26, 27], Saudi Arabia [28], Pakistan [29], and USA [30]. However, our study found support in a Danish study that showed that transparent communication about negative features of the COVID-19 vaccine increased trust but decreased acceptance [1].
Given that majority of studies have shown a positive and strong correlation between confidence and vaccine acceptance, our findings may have differed due to perceived necessity (urgency over confidence), social and institutional pressure (e.g. requirement for employment and international travel), influence of misinformation and individual perceptions of risk and benefits. Some people may have simply accepted the vaccine as a necessary tool for returning to normal life or avoiding further restrictions even if they had reservations. The implication of this finding is that, despite lower levels of confidence, individuals may still accept the COVID-19 vaccine due to certain external factors. This highlights the importance of addressing both confidence and external motivations in vaccine promotion strategies.
Our findings also showed that lower levels of collective responsibility were associated with acceptance of the vaccine. This is counterintuitive but could have resulted from prioritization of personal health decisions over societal considerations, perceived autonomy and individual choice, rejection of social and institutional pressure to accept the vaccine and mistrust of the vaccine and the public authorities promoting it. This finding underscores the need for more personalized approach towards vaccine promotion.
Our study also showed that belief in the existence of the COVID-19 virus was predictive of vaccine acceptance. Conspiracy theories, though not statistically significant in our study, were the main drivers of the denial of the pandemic and other associated COVID-19 misinformation. The findings of this study regarding belief in the existence of COVID-19 align with those of another Nigerian study, which identified the predominant conspiracy theory as the denial of SARS-CoV-2’s existence and the belief’s possible translation into vaccine hesitancy [31-33]. Similarly, conspiracy theory was also not a significant factor in a Japanese study [34]. This, however, could be attributed to the higher levels of education and familiarity with coronavirus syndromes like severe acute respiratory syndrome (SARS).
Enforcement of compliance with COVID-19 vaccination and control measures was not statistically significant in this research. The same findings were indicated in a similar Japanese study where it was explained that mandatory immunization policy by the government could cause psychological reactance and rather lead to decreased willingness to be vaccinated [34]. This finding may have provided new insight into why the infection still spread fast across the country despite all the restrictions put in place.
Policy interventions targeted towards optimizing acceptance of COVID-19 vaccine beyond the present levels should focus more on improving confidence in the vaccine and vaccination processes and countering misinformation and conspiracy theories. Policies must be made to address the dissemination of misinformation in the various media platforms.
Strengths and Limitations
Our study is probably one of the first in Nigeria that uses the 7C model. The model is unique in that the influence of conspiracy theories and enforcement of compliance with COVID-19 control modalities are considered as standalone components of the survey. This serves the advantage of making the findings generalizable to a larger population. The findings of this research, however, must be seen in the light of some limitations, including reliance on self-report of vaccination status. Secondly, the research did not evaluate the income and the level of knowledge of respondents towards COVID-19 and COVID-19 vaccine.
The findings from this research revealed a COVID-19 vaccine prevalence above the national average. While age, belief in the existence of COVID-19 and complacency were associated with increased vaccine acceptance, higher levels of confidence, calculations and a sense of collective responsibility significantly decreased acceptance. Moreover, compliance and educational level were not significant predictors of vaccine acceptance, highlighting the complex interplay of factors influencing vaccination decisions
What is already known about the topic
What this study adds
| Characteristic | Frequency (%) |
|---|---|
| Age | |
| <30 | 352 (40.9) |
| 30 – 39 | 256 (29.7) |
| 40 – 49 | 155 (18.0) |
| 50 – 59 | 60 (7.0) |
| 60 – 69 | 29 (3.4) |
| ≥ 70 | 9 (1.0) |
| Sex | |
| Female | 437 (50.8) |
| Male | 424 (49.2) |
| Highest Educational Level | |
| None | 35 (4.1) |
| Primary | 57 (6.6) |
| Secondary | 222 (25.8) |
| Tertiary | 547 (63.5) |
| Marital Status (n=860) | |
| Currently Married | 509 (59.2) |
| Currently Unmarried | 351 (40.8) |
| Religion | |
| Christianity | 473 (54.9) |
| Islam | 383 (44.5) |
| Others | 5 (0.6) |
| Occupation | |
| Health-related | 85 (9.9) |
| Non Health-related | 776 (90.1) |
| Belief in the existence of COVID-19 | |
| Yes | 651 (75.6) |
| No | 98 (11.4) |
| Unsure | 112 (13.0) |
| Knowing someone infected with COVID-19 | |
| Yes | 135 (15.7) |
| No | 725 (84.3) |
| History of COVID-19 infection (n=860) | |
| Yes | 24 (2.8) |
| No | 836 (97.2) |
| History of COVID-19 vaccination | |
| Yes | 524 (60.9) |
| No | 337 (39.1) |
| COVID-19 vaccine doses received | |
| None | 357 (41.4) |
| One | 165 (19.2) |
| At least two | 339 (39.4) |
| Domain | Mean ± SD | |
|---|---|---|
| Confidence | I am completely confident that COVID-19 vaccines are safe | 4.96 ± 2.34 |
| I am completely confident that COVID-19 vaccines are effective | ||
| I have the belief that the government acted in the best interest of the nation concerning COVID-19 vaccines | ||
| Complacency | It is unnecessary to receive the vaccine as it cannot prevent COVID-19 and its many strains (R) | 5.70 ± 1.60 |
| I believe my immune system is powerful enough to protect me from getting COVID-19 (R) | ||
| I don’t believe COVID-19 is as deadly as people take it to be (R) | ||
| Collective responsibility | I will take COVID-19 vaccine because I want to protect others | 4.63 ± 2.20 |
| I get vaccinated because protecting vulnerable groups like the elderly and the weak is important to me | ||
| I believe it is a collective task against the spread of the disease | ||
| Constraints | I don’t have the time to go and receive the vaccines (R) | 6.05 ± 1.58 |
| Vaccines were unavailable when I registered/ made inquiries (R) | ||
| I will prioritize taking the vaccine over other things | ||
| Calculations | I have to first weigh the benefits and risks to decide to be vaccinated (R) | 4.64 ± 2.06 |
| I will first consider whether the vaccine is effective or not before deciding for it (R) | ||
| I get vaccinated when I do not see the disadvantages for me (R) | ||
| Compliance | People should be barred from public and private jobs when they are not vaccinated against COVID-19 | 5.78 ± 1.75 |
| All people who do not follow the vaccination recommendations by health authorities should be denied certain rights e.g. international travel, banking and schooling | ||
| The health authorities should enforce COVID-19 vaccination to achieve high coverage rates | ||
| Conspiracy | COVID-19 vaccine contains microchips to control humans (R) | 6.43 ± 1.54 |
| The vaccine is designed by the West to kill and reduce the world’s population (R) | ||
| The vaccine is designed to tamper with our genome (DNA) (R) | ||
| Total readiness score | 38.01 ± 8.57 | |
| Variable | Vaccination status | χ² | P-value | |
|---|---|---|---|---|
| Vaccinated n (%) | Unvaccinated n (%) | |||
| Age groups | ||||
| <30 | 183 (34.9) | 169 (50.1) | 21.5 | <0.001* |
| 30 – 39 | 164 (31.3) | 92 (27.3) | ||
| 40 – 49 | 133 (21.6) | 42 (12.5) | ||
| 50 – 59 | 36 (6.9) | 24 (7.1) | ||
| 60 – 69 | 19 (3.6) | 10 (3.0) | ||
| ≥70 | 9 (1.7) | 0 | ||
| Marital Status (n=860) | ||||
| Currently Married | 326 (62.3) | 183 (54.3) | 5.5 | 0.023* |
| Currently Unmarried | 197 (37.7) | 154 (45.7) | ||
| Belief in COVID-19 existence | ||||
| Yes | 457 (87.2) | 194 (57.6) | 102.0 | <0.001* |
| No | 24 (4.6) | 74 (22.0) | ||
| Unsure | 43 (82.0) | 69 (20.5) | ||
| Knowing someone who had been infected with COVID-19 (n=860) | ||||
| Yes | 100 (19.1) | 35 (10.4) | 11.8 | 0.005* |
| No | 423 (80.9) | 302 (89.6) | ||
| History of COVID-19 infection (n=860) | ||||
| Yes | 21 (4.0) | 3 (0.89) | 7.4 | 0.005* |
| No | 502 (96.0) | 334 (99.1) | ||
| Confidence (n=854) | 336 (39.1) | 520 (60.9) | 225.5 | <0.001 |
| Complacency (n=857) | 334 (39.0) | 523 (61.0) | 97.3 | <0.001 |
| Collective responsibility (n=859) | 336 (39.1) | 523 (60.9) | 258.1 | <0.001 |
| Calculation (n=856) | 335 (39.1) | 521 (60.9) | 63.1 | <0.001 |
| Constraints (n=858) | 337 (39.3) | 521 (60.7) | 78.6 | <0.001 |
| Compliance (n=856) | 333 (38.9) | 523 (61.1) | 35.5 | <0.001 |
| Conspiracy (n=854) | 334 (39.1) | 520 (60.9) | 78.4 | <0.001 |
| Variable | COR | 95% CI | P-value | AOR | 95% CI | P-value |
|---|---|---|---|---|---|---|
| Age group (n = 852) | ||||||
| <30 | Reference | Reference | ||||
| 30–39 | 1.64 | 1.18–2.29 | 0.003* | 1.85 | 1.13–3.04 | 0.015* |
| 40–49 | 2.48 | 1.65–3.75 | <0.001* | 3.61 | 1.94–6.70 | 0.001* |
| 50–59 | 1.38 | 0.79–2.42 | 0.252 | 22.25 | 1.00–5.01 | 0.048* |
| 60–69 | 1.75 | 0.79–3.88 | 0.165 | 2.02 | 0.64–6.33 | 0.229 |
| Sex (n = 861) | ||||||
| Female | Reference | |||||
| Male | 0.89 | 0.68–1.17 | 0.399 | |||
| Highest Educational Level (n = 861) | ||||||
| None | Reference | |||||
| Primary | 0.76 | 0.32–1.79 | 0.526 | |||
| Secondary | 0.75 | 0.36–1.56 | 0.438 | |||
| Tertiary | 1.01 | 0.50–2.06 | 0.962 | |||
| Marital Status (n = 860) | ||||||
| Currently Married | Reference | Reference | ||||
| Currently Unmarried | 0.72 | 0.54–1.02 | 0.020* | 1.23 | 0.77–1.90 | 0.393 |
| Religion (n = 860) | ||||||
| Christianity | Reference | |||||
| Islam | 0.78 | 0.59–1.02 | 0.077 | |||
| Others | 0.38 | 0.06–2.30 | 0.293 | |||
| Occupation (n = 861) | ||||||
| Non-Health-related | Reference | |||||
| Health-related | 1.52 | 0.94–2.46 | 0.091 | |||
| Belief in COVID-19 existence (n = 861) | ||||||
| No | Reference | Reference | ||||
| Unsure | 1.92 | 1.06–3.49 | 0.032* | 1.60 | 0.81–3.16 | 0.178 |
| Yes | 7.26 | 4.44–11.86 | <0.001* | 3.04 | 1.72–5.36 | <0.001* |
| Knowing someone who had been infected with COVID-19 | ||||||
| No | Reference | Reference | ||||
| Yes | 2.03 | 1.35–3.08 | <0.001* | 1.09 | 0.64–1.85 | 0.739 |
| History of COVID-19 infection | ||||||
| No | Reference | Reference | ||||
| Yes | 4.66 | 1.38–15.70 | 0.013* | 1.79 | 0.43–7.39 | 0.421 |
| Confidence | 0.69 | 0.65–0.74 | <0.001* | 0.78 | 0.72–0.85 | <0.001* |
| Complacency | 1.09 | 1.00–1.20 | 0.032* | 1.43 | 1.26–1.61 | 0.001* |
| Collective responsibility | 0.63 | 0.59–0.68 | <0.001* | 0.73 | 0.67–0.80 | <0.001* |
| Calculations | 0.82 | 0.77–0.88 | <0.001* | 0.88 | 0.80–0.96 | 0.003* |
| Constraints | 0.91 | 0.83–0.99 | 0.035* | 1.06 | 0.93–1.20 | 0.373 |
| Compliance | 1.00 | 0.95–1.09 | 0.896 | |||
| Conspiracy | 0.83 | 0.76–0.92 | <0.001* | 0.98 | 0.87–1.11 | 0.776 |
| Domain | Item | Disagree (n%) | Neutral (n%) | Agree (n%) |
|---|---|---|---|---|
| Confidence | I am completely confident that COVID-19 vaccines are safe | 223 (26.2) | 150 (17.6) | 478 (56.2) |
| I am completely confident that COVID-19 vaccines are effective | 233 (27.8) | 151 (18.2) | 454 (54.2) | |
| I have the belief that the government acted in the best interest of the nation concerning COVID-19 vaccines | 186 (22.2) | 137 (16.3) | 516 (61.5) | |
| Complacency | It is unnecessary to receive the vaccine as it cannot prevent COVID-19 and its many strains (R) | 175 (20.6) | 198 (23.3) | 477 (56.1) |
| I believe my immune system is powerful enough to protect me from getting COVID-19 (R) | 198 (23.3) | 293 (34.5) | 359 (42.2) | |
| I don’t believe COVID-19 is as deadly as people take it to be (R) | 163 (19.2) | 261 (30.7) | 426 (50.1) | |
| Collective responsibility | I will take COVID-19 vaccine because I want to protect others | 158 (18.5) | 153 (18.0) | 539 (63.4) |
| I get vaccinated because protecting vulnerable groups like the elderly and the weak is important to me | 184 (21.6) | 138 (16.2) | 529 (62.2) | |
| I believe it is a collective task against the spread of the disease | 165 (19.5) | 124 (14.6) | 559 (65.9) | |
| Constraints | I don’t have the time to go and receive the vaccines (R) | 172 (20.2) | 189 (22.3) | 492 (56.7) |
| Vaccines were unavailable when I registered/ made inquiries (R) | 212 (25.0) | 154 (18.2) | 481 (56.8) | |
| I will prioritize taking the vaccine over other things | 293 (34.6) | 323 (38.1) | 231 (27.3) | |
| Calculations | I have to first weigh the benefits and risks to decide to be vaccinated (R) | 141 (16.6) | 538 (63.4) | 169 (19.9) |
| I will first consider whether the vaccine is effective before deciding for it (R) | 143 (16.7) | 544 (64.1) | 161 (19.0) | |
| I get vaccinated when I do not see the disadvantages for me (R) | 178 (21.0) | 488 (57.7) | 180 (21.3) | |
| Compliance | People should be barred from public and private jobs when they are not vaccinated against COVID-19 | 196 (23.0) | 518 (60.9) | 137 (16.1) |
| All people who do not follow the vaccination recommendations by health authorities should be denied certain rights | 209 (24.7) | 491 (58.0) | 147 (17.4) | |
| The health authorities should enforce COVID-19 vaccination to achieve high coverage rates | 160 (20.6) | 336 (43.3) | 280 (36.1) | |
| Conspiracy | COVID-19 vaccine contains microchips to control humans (R) | 209 (24.6) | 87 (10.2) | 553 (65.1) |
| The vaccine is designed by the West to kill and reduce the world’s population (R) | 207 (24.4) | 71 (8.4) | 569 (67.2) | |
| The vaccine is designed to tamper with our genome (DNA) (R) | 208 (24.6) | 57 (6.7) | 582 (68.7) |
Views: 2,608
Menu, Tables and Figures
| Characteristic | Frequency (%) |
|---|---|
| Age | |
| <30 | 352 (40.9) |
| 30 – 39 | 256 (29.7) |
| 40 – 49 | 155 (18.0) |
| 50 – 59 | 60 (7.0) |
| 60 – 69 | 29 (3.4) |
| ≥ 70 | 9 (1.0) |
| Sex | |
| Female | 437 (50.8) |
| Male | 424 (49.2) |
| Highest Educational Level | |
| None | 35 (4.1) |
| Primary | 57 (6.6) |
| Secondary | 222 (25.8) |
| Tertiary | 547 (63.5) |
| Marital Status (n=860) | |
| Currently Married | 509 (59.2) |
| Currently Unmarried | 351 (40.8) |
| Religion | |
| Christianity | 473 (54.9) |
| Islam | 383 (44.5) |
| Others | 5 (0.6) |
| Occupation | |
| Health-related | 85 (9.9) |
| Non Health-related | 776 (90.1) |
| Belief in the existence of COVID-19 | |
| Yes | 651 (75.6) |
| No | 98 (11.4) |
| Unsure | 112 (13.0) |
| Knowing someone infected with COVID-19 | |
| Yes | 135 (15.7) |
| No | 725 (84.3) |
| History of COVID-19 infection (n=860) | |
| Yes | 24 (2.8) |
| No | 836 (97.2) |
| History of COVID-19 vaccination | |
| Yes | 524 (60.9) |
| No | 337 (39.1) |
| COVID-19 vaccine doses received | |
| None | 357 (41.4) |
| One | 165 (19.2) |
| At least two | 339 (39.4) |
Table 1: Socio-demographic and COVID-19 related characteristics of residents of Ilorin metropolis, January 2023 (N=861)
| Domain | Mean ± SD | |
|---|---|---|
| Confidence | I am completely confident that COVID-19 vaccines are safe | 4.96 ± 2.34 |
| I am completely confident that COVID-19 vaccines are effective | ||
| I have the belief that the government acted in the best interest of the nation concerning COVID-19 vaccines | ||
| Complacency | It is unnecessary to receive the vaccine as it cannot prevent COVID-19 and its many strains (R) | 5.70 ± 1.60 |
| I believe my immune system is powerful enough to protect me from getting COVID-19 (R) | ||
| I don’t believe COVID-19 is as deadly as people take it to be (R) | ||
| Collective responsibility | I will take COVID-19 vaccine because I want to protect others | 4.63 ± 2.20 |
| I get vaccinated because protecting vulnerable groups like the elderly and the weak is important to me | ||
| I believe it is a collective task against the spread of the disease | ||
| Constraints | I don’t have the time to go and receive the vaccines (R) | 6.05 ± 1.58 |
| Vaccines were unavailable when I registered/ made inquiries (R) | ||
| I will prioritize taking the vaccine over other things | ||
| Calculations | I have to first weigh the benefits and risks to decide to be vaccinated (R) | 4.64 ± 2.06 |
| I will first consider whether the vaccine is effective or not before deciding for it (R) | ||
| I get vaccinated when I do not see the disadvantages for me (R) | ||
| Compliance | People should be barred from public and private jobs when they are not vaccinated against COVID-19 | 5.78 ± 1.75 |
| All people who do not follow the vaccination recommendations by health authorities should be denied certain rights e.g. international travel, banking and schooling | ||
| The health authorities should enforce COVID-19 vaccination to achieve high coverage rates | ||
| Conspiracy | COVID-19 vaccine contains microchips to control humans (R) | 6.43 ± 1.54 |
| The vaccine is designed by the West to kill and reduce the world’s population (R) | ||
| The vaccine is designed to tamper with our genome (DNA) (R) | ||
| Total readiness score | 38.01 ± 8.57 | |
| Variable | Vaccination status | χ² | P-value | |
|---|---|---|---|---|
| Vaccinated n (%) | Unvaccinated n (%) | |||
| Age groups | ||||
| <30 | 183 (34.9) | 169 (50.1) | 21.5 | <0.001* |
| 30 – 39 | 164 (31.3) | 92 (27.3) | ||
| 40 – 49 | 133 (21.6) | 42 (12.5) | ||
| 50 – 59 | 36 (6.9) | 24 (7.1) | ||
| 60 – 69 | 19 (3.6) | 10 (3.0) | ||
| ≥70 | 9 (1.7) | 0 | ||
| Marital Status (n=860) | ||||
| Currently Married | 326 (62.3) | 183 (54.3) | 5.5 | 0.023* |
| Currently Unmarried | 197 (37.7) | 154 (45.7) | ||
| Belief in COVID-19 existence | ||||
| Yes | 457 (87.2) | 194 (57.6) | 102.0 | <0.001* |
| No | 24 (4.6) | 74 (22.0) | ||
| Unsure | 43 (82.0) | 69 (20.5) | ||
| Knowing someone who had been infected with COVID-19 (n=860) | ||||
| Yes | 100 (19.1) | 35 (10.4) | 11.8 | 0.005* |
| No | 423 (80.9) | 302 (89.6) | ||
| History of COVID-19 infection (n=860) | ||||
| Yes | 21 (4.0) | 3 (0.89) | 7.4 | 0.005* |
| No | 502 (96.0) | 334 (99.1) | ||
| Confidence (n=854) | 336 (39.1) | 520 (60.9) | 225.5 | <0.001 |
| Complacency (n=857) | 334 (39.0) | 523 (61.0) | 97.3 | <0.001 |
| Collective responsibility (n=859) | 336 (39.1) | 523 (60.9) | 258.1 | <0.001 |
| Calculation (n=856) | 335 (39.1) | 521 (60.9) | 63.1 | <0.001 |
| Constraints (n=858) | 337 (39.3) | 521 (60.7) | 78.6 | <0.001 |
| Compliance (n=856) | 333 (38.9) | 523 (61.1) | 35.5 | <0.001 |
| Conspiracy (n=854) | 334 (39.1) | 520 (60.9) | 78.4 | <0.001 |
Table 3: Factors associated with COVID-19 vaccination among residents of Ilorin metropolis, Jan.2023
| Variable | COR | 95% CI | P-value | AOR | 95% CI | P-value |
|---|---|---|---|---|---|---|
| Age group (n = 852) | ||||||
| <30 | Reference | Reference | ||||
| 30–39 | 1.64 | 1.18–2.29 | 0.003* | 1.85 | 1.13–3.04 | 0.015* |
| 40–49 | 2.48 | 1.65–3.75 | <0.001* | 3.61 | 1.94–6.70 | 0.001* |
| 50–59 | 1.38 | 0.79–2.42 | 0.252 | 22.25 | 1.00–5.01 | 0.048* |
| 60–69 | 1.75 | 0.79–3.88 | 0.165 | 2.02 | 0.64–6.33 | 0.229 |
| Sex (n = 861) | ||||||
| Female | Reference | |||||
| Male | 0.89 | 0.68–1.17 | 0.399 | |||
| Highest Educational Level (n = 861) | ||||||
| None | Reference | |||||
| Primary | 0.76 | 0.32–1.79 | 0.526 | |||
| Secondary | 0.75 | 0.36–1.56 | 0.438 | |||
| Tertiary | 1.01 | 0.50–2.06 | 0.962 | |||
| Marital Status (n = 860) | ||||||
| Currently Married | Reference | Reference | ||||
| Currently Unmarried | 0.72 | 0.54–1.02 | 0.020* | 1.23 | 0.77–1.90 | 0.393 |
| Religion (n = 860) | ||||||
| Christianity | Reference | |||||
| Islam | 0.78 | 0.59–1.02 | 0.077 | |||
| Others | 0.38 | 0.06–2.30 | 0.293 | |||
| Occupation (n = 861) | ||||||
| Non-Health-related | Reference | |||||
| Health-related | 1.52 | 0.94–2.46 | 0.091 | |||
| Belief in COVID-19 existence (n = 861) | ||||||
| No | Reference | Reference | ||||
| Unsure | 1.92 | 1.06–3.49 | 0.032* | 1.60 | 0.81–3.16 | 0.178 |
| Yes | 7.26 | 4.44–11.86 | <0.001* | 3.04 | 1.72–5.36 | <0.001* |
| Knowing someone who had been infected with COVID-19 | ||||||
| No | Reference | Reference | ||||
| Yes | 2.03 | 1.35–3.08 | <0.001* | 1.09 | 0.64–1.85 | 0.739 |
| History of COVID-19 infection | ||||||
| No | Reference | Reference | ||||
| Yes | 4.66 | 1.38–15.70 | 0.013* | 1.79 | 0.43–7.39 | 0.421 |
| Confidence | 0.69 | 0.65–0.74 | <0.001* | 0.78 | 0.72–0.85 | <0.001* |
| Complacency | 1.09 | 1.00–1.20 | 0.032* | 1.43 | 1.26–1.61 | 0.001* |
| Collective responsibility | 0.63 | 0.59–0.68 | <0.001* | 0.73 | 0.67–0.80 | <0.001* |
| Calculations | 0.82 | 0.77–0.88 | <0.001* | 0.88 | 0.80–0.96 | 0.003* |
| Constraints | 0.91 | 0.83–0.99 | 0.035* | 1.06 | 0.93–1.20 | 0.373 |
| Compliance | 1.00 | 0.95–1.09 | 0.896 | |||
| Conspiracy | 0.83 | 0.76–0.92 | <0.001* | 0.98 | 0.87–1.11 | 0.776 |
Table 4: Logistic regression analysis of COVID-19 vaccine acceptance among residents of Ilorin metropolis
| Domain | Item | Disagree (n%) | Neutral (n%) | Agree (n%) |
|---|---|---|---|---|
| Confidence | I am completely confident that COVID-19 vaccines are safe | 223 (26.2) | 150 (17.6) | 478 (56.2) |
| I am completely confident that COVID-19 vaccines are effective | 233 (27.8) | 151 (18.2) | 454 (54.2) | |
| I have the belief that the government acted in the best interest of the nation concerning COVID-19 vaccines | 186 (22.2) | 137 (16.3) | 516 (61.5) | |
| Complacency | It is unnecessary to receive the vaccine as it cannot prevent COVID-19 and its many strains (R) | 175 (20.6) | 198 (23.3) | 477 (56.1) |
| I believe my immune system is powerful enough to protect me from getting COVID-19 (R) | 198 (23.3) | 293 (34.5) | 359 (42.2) | |
| I don’t believe COVID-19 is as deadly as people take it to be (R) | 163 (19.2) | 261 (30.7) | 426 (50.1) | |
| Collective responsibility | I will take COVID-19 vaccine because I want to protect others | 158 (18.5) | 153 (18.0) | 539 (63.4) |
| I get vaccinated because protecting vulnerable groups like the elderly and the weak is important to me | 184 (21.6) | 138 (16.2) | 529 (62.2) | |
| I believe it is a collective task against the spread of the disease | 165 (19.5) | 124 (14.6) | 559 (65.9) | |
| Constraints | I don’t have the time to go and receive the vaccines (R) | 172 (20.2) | 189 (22.3) | 492 (56.7) |
| Vaccines were unavailable when I registered/ made inquiries (R) | 212 (25.0) | 154 (18.2) | 481 (56.8) | |
| I will prioritize taking the vaccine over other things | 293 (34.6) | 323 (38.1) | 231 (27.3) | |
| Calculations | I have to first weigh the benefits and risks to decide to be vaccinated (R) | 141 (16.6) | 538 (63.4) | 169 (19.9) |
| I will first consider whether the vaccine is effective before deciding for it (R) | 143 (16.7) | 544 (64.1) | 161 (19.0) | |
| I get vaccinated when I do not see the disadvantages for me (R) | 178 (21.0) | 488 (57.7) | 180 (21.3) | |
| Compliance | People should be barred from public and private jobs when they are not vaccinated against COVID-19 | 196 (23.0) | 518 (60.9) | 137 (16.1) |
| All people who do not follow the vaccination recommendations by health authorities should be denied certain rights | 209 (24.7) | 491 (58.0) | 147 (17.4) | |
| The health authorities should enforce COVID-19 vaccination to achieve high coverage rates | 160 (20.6) | 336 (43.3) | 280 (36.1) | |
| Conspiracy | COVID-19 vaccine contains microchips to control humans (R) | 209 (24.6) | 87 (10.2) | 553 (65.1) |
| The vaccine is designed by the West to kill and reduce the world’s population (R) | 207 (24.4) | 71 (8.4) | 569 (67.2) | |
| The vaccine is designed to tamper with our genome (DNA) (R) | 208 (24.6) | 57 (6.7) | 582 (68.7) |
