Research | Open Access | Volume 8 (4): Article 90 | Published: 10 Nov 2025
Views: 1,609
Menu, Tables and Figures
| Variable | Frequency | Percentage |
|---|---|---|
| Gender | ||
| Male | 1023 | 84.3 |
| Female | 191 | 15.7 |
| Age (years) | ||
| 18 – 29 | 415 | 34.2 |
| 30 – 49 | 769 | 63.3 |
| 50 – 59 | 25 | 2.1 |
| 60+ | 5 | 0.4 |
| Education | ||
| Primary | 66 | 5.4 |
| Secondary | 63 | 5.2 |
| College/university | 1085 | 89.4 |
| Marital status | ||
| Married | 731 | 60.2 |
| Widowed | 13 | 1.1 |
| Separated | 12 | 1.0 |
| Divorced | 16 | 1.3 |
| Single | 442 | 36.4 |
| Employment status | ||
| Full-time employed | 909 | 74.9 |
| Part-time employed | 86 | 7.1 |
| Self-employed | 83 | 6.8 |
| Unemployed | 56 | 4.6 |
| Housewife | 9 | 0.7 |
| Student | 69 | 5.7 |
| Retired | 2 | 0.2 |
| Residence | ||
| Rural | 129 | 10.6 |
| Urban | 1085 | 89.4 |
| Monthly Income (Birr) | ||
| Below 5,000 | 223 | 18.4 |
| 5,000 – 15,000 | 690 | 56.8 |
| Above 15,000 | 301 | 24.8 |
Table 1: Demographic characteristics of respondents, June 2020 – July 2021 (N=1,214)
| Variables | Knowledge | Attitude | Practice | Psychological response | ||||||||
|---|---|---|---|---|---|---|---|---|---|---|---|---|
| Inadequate (n, %) | Adequate (n, %) | β (p-value) | Negative (n, %) | Positive (n, %) | β (p-value) | Inappropriate (n, %) | Appropriate (n, %) | β (p-value) | Inappropriate (n, %) | Appropriate (n, %) | β (p-value) | |
| Sex | ||||||||||||
| Male | 568(55.5) | 455(44.5) | 0.17(0.920) | 517(50.5) | 506(49.5) | -0.15(0.929) | 516(50.4) | 507(49.6) | -0.764(<0.05) | 463(45.3) | 560(54.7) | 0.168(0.316) |
| Female | 113(59.2) | 78(40.8) | REF | 102(53.4) | 89(46.6) | REF | 59(30.9) | 132(69.1) | REF | 98(51.3) | 93(48.7) | REF |
| Age in years | ||||||||||||
| 18–29 | 227(54.7) | 188(45.3) | 0.610(0.602) | 197(47.5) | 218(52.5) | 0.230(0.816) | 201(48.4) | 214(51.6) | 0.885(0.375) | 200(48.2) | 215(51.8) | 0.463(0.649) |
| 30–49 | 438(57.0) | 331(43.0) | 0.645(0.579) | 403(52.4) | 366(47.6) | 0.183(0.851) | 365(47.5) | 404(52.5) | 0.865(0.382) | 350(45.5) | 419(54.5) | 0.373(0.711) |
| 50–59 | 12(48.0) | 13(52.0) | 1.219(0.321) | 16(64.0) | 9(36.0) | -0.197(0.852) | 6(24.0) | 19(76.0) | 1.634(0.135) | 9(36.0) | 16(64.0) | 0.804(0.461) |
| 60+ | 4(80.0) | 1(20.0) | REF | 3(60.0) | 2(40.0) | REF | 3(60.0) | 2(40.0) | REF | 2(40.0) | 3(60.0) | REF |
| Educational level | ||||||||||||
| Primary | 37(56.1) | 29(43.9) | -0.169(0.521) | 32(48.5) | 34(51.5) | -0.051(0.848) | 27(40.9) | 39(59.1) | 0.170(0.530) | 39(59.1) | 27(40.9) | -0.475(0.075) |
| Secondary | 40(63.5) | 23(36.5) | -0.464(0.100) | 33(52.4) | 30(47.6) | -0.188(0.493) | 26(41.3) | 37(58.7) | 0.180(0.512) | 33(52.4) | 30(47.6) | -0.137(0.611) |
| College/university | 604(55.7) | 481(44.3) | REF | 554(51.1) | 531(48.9) | REF | 522(48.1) | 563(51.9) | REF | 489(45.1) | 596(54.9) | REF |
| Marital status | ||||||||||||
| Married | 416(56.9) | 315(43.1) | -0.125(0.375) | 395(54.0) | 336(46.0) | -0.260(0.063) | 335(45.8) | 396(54.2) | 0.301(0.032) | 309(42.3) | 422(57.7) | 0.337(0.016) |
| Widowed | 7(53.8) | 6(46.2) | 0.020(0.997) | 4(30.8) | 9(69.2) | 0.740(0.246) | 3(23.1) | 10(76.9) | 1.122(0.105) | 10(76.9) | 3(23.1) | -0.980(0.151) |
| Separated | 9(75.0) | 3(25.0) | -0.902(0.195) | 7(58.3) | 5(41.7) | -0.344(0.575) | 4(33.3) | 8(66.7) | 0.482(0.456) | 8(66.7) | 4(33.3) | -0.523(0.411) |
| Divorced | 9(56.3) | 7(43.7) | -0.147(0.778) | 5(31.3) | 11(68.8) | 0.740(0.185) | 6(37.5) | 10(62.5) | 0.529(0.330) | 10(62.5) | 6(37.5) | -0.519(0.330) |
| Single | 240(54.3) | 202(45.7) | REF | 208(47.1) | 234(52.9) | REF | 227(37.5) | 215(48.6) | REF | 224(50.7) | 218(49.3) | REF |
| Employment status | ||||||||||||
| Full-time employed | 496(54.6) | 413(45.4) | 16.740(<0.05) | 452(49.7) | 457(50.3) | -0.159(0.916) | 446(49.1) | 463(50.9) | -0.534(0.727) | 406(44.7) | 503(55.3) | -17.086(<0.05) |
| Part-time employed | 42(48.8) | 44(51.2) | 16.944(<0.05) | 38(44.2) | 48(55.8) | -0.013(0.993) | 44(51.2) | 42(48.8) | -0.630(0.684) | 43(50.0) | 43(50.0) | -17.222(<0.05) |
| Self-employed | 56(67.5) | 27(32.5) | 16.232(<0.05) | 51(61.4) | 32(38.6) | -0.638(0.674) | 34(41.0) | 49(59.0) | -0.346(0.823) | 43(51.8) | 40(48.2) | -17.332(<0.05) |
| Unemployed | 32(57.1) | 24(42.9) | 16.524(<0.05) | 32(57.1) | 24(42.9) | -0.640(0.675) | 18(32.1) | 38(67.9) | 0.121(0.938) | 26(46.4) | 30(53.6) | -17.006(<0.05) |
| Housewife | 7(77.8) | 2(22.2) | 15.626(<0.05) | 7(77.8) | 2(22.2) | 1.423(0.407) | 3(33.3) | 6(66.7) | -0.648(0.703) | 6(66.7) | 3(33.3) | -17.953(<0.05) |
| Student | 48(67.6) | 23(33.3) | REF | 39(54.9) | 32(45.1) | REF | 30(42.2) | 41(57.7) | REF | 37(52.1) | 34(47.8) | REF |
| Residence | ||||||||||||
| Urban | 626(57.4) | 459(42.3) | 0.579(0.003) | 569(52.4) | 516(47.6) | 0.485(0.015) | 516(47.6) | 569(52.4) | -0.026(0.895) | 494(45.5) | 591(54.5) | -0.170(0.386) |
| Rural | 55(42.6) | 74(57.4) | REF | 50(38.8) | 79(61.2) | REF | 59(45.7) | 70(54.3) | REF | 67(51.9) | 62(48.1) | REF |
| Income | ||||||||||||
| Below 5,000 | 111(49.8) | 112(50.2) | 0.579(0.005) | 102(45.7) | 121(54.3) | 0.447(0.025) | 95(42.6) | 128(57.1) | 0.069(0.731) | 107(48.0) | 116(52.0) | -0.072(0.718) |
| 5,000–15,000 | 378(54.8) | 312(45.2) | 0.341(0.023) | 337(48.8) | 353(51.2) | 0.327(0.026) | 351(50.9) | 339(49.1) | -0.221(0.134) | 327(47.4) | 363(52.6) | -0.180(0.221) |
| Above 15,000 | 192(63.8) | 109(36.2) | REF | 180(59.8) | 121(40.2) | REF | 129(42.9) | 172(57.1) | REF | 127(42.2) | 174(57.8) | REF |
Table 2: Regression analysis of demographic variables versus knowledge, attitudes, and practices and psychological responses, June 2020 – July 2021 (N = 1,214)
| Category | Practice | |||
|---|---|---|---|---|
| β | Sig. (p-value) | Odds ratio | 95% CI | |
| Knowledge | 0.230 | 0.064 | 1.259 | (0.99 – 1.61) |
| Attitude | -0.276 | 0.025 | 0.758 | (0.60 – 0.97) |
| Psychological responses | 0.710 | <0.05 | 2.034 | (1.01 – 4.14) |
Table 3: Perceived levels of knowledge, attitude, and behaviour regarding COVID-19 practices, logistic regression, June 2020–July 2021 (n = 1,214)
| Category | Time (over the course of pandemic) | ||
|---|---|---|---|
| β | T-test | Sig. (p-value) | |
| Knowledge | -0.052 | -1.561 | 0.119 |
| Attitude | 0.107 | 3.243 | 0.001 |
| Practice | -0.052 | -1.747 | 0.081 |
| Psychological responses | 0.035 | 1.166 | 0.244 |
Table 4: Impact of time on respondents’ knowledge, attitudes, practices, and psychological responses during the COVID-19 pandemic, June 2020 – July 2021 (N=1,214)
| Knowledge questions | Survey responses | ||
|---|---|---|---|
| Agree | Not agree | Neutral or not sure | |
| Do you agree that the main clinical symptoms of COVID-19 are fever, fatigue, dry cough, and difficult breathing? | 1134 (93.4)* | 35 (2.9) | 45 (3.7) |
| Do you agree that currently no effective cure for COVID-19-2019, but early symptomatic and supportive treatment can help most patients recover from the infection? | 1037 (85.4)* | 98 (8.1) | 79 (6.5) |
| Do you accept that not all persons with COVID-19-2019 will develop to severe cases? Only those who are elderly, have chronic illnesses, and are obese are more likely to be severe cases | 891 (73.4)* | 254 (20.9) | 69 (5.7) |
| Do eating or contacting wild animals would result infection by COVID-19 virus? | 560 (46.1) | 277 (22.8)* | 377 (31.1) |
| Do you agree that persons with COVID-19-2019 cannot transmit the virus to others when a fever is not present? | 909 (74.9) | 244 (20.1)* | 61 (5.0) |
| Does COVID-19 virus spreads via respiratory droplets of infected individuals? | 1151 (94.8)* | 27 (2.2) | 36 (3.0) |
| Do ordinary residents can wear general medical masks to prevent the infection by the COVID-19 virus? | 724 (59.6)* | 430 (35.4) | 60 (4.9) |
| Do you agree that children and young adults should not take any preventive measures of COVID-19 virus? | 639 (52.6) | 554 (45.6)* | 21 (1.7) |
| Do you agree that to prevent COVID-19 infection, individuals should avoid going to crowded place such as stadium, train stations, recreational, market area, and avoid taking public transportations? | 1045 (86.1)* | 123 (10.1) | 46 (3.8) |
| Do you agree that isolation and treatment of people who are infected with the COVID-19 virus are effective ways to reduce the spread of the virus? | 1128 (92.9)* | 60 (4.9) | 26 (2.1) |
| Do you agree that people who have contact with someone infected with the COVID-19 virus should be immediately isolated in a designated place? | 1043 (85.9)* | 71 (5.8) | 100 (8.2) |
| Do you agree that the incubation period for COVID-19, which is the time between exposure to the virus and symptom onset, is on average 2-14 days? | 629 (51.8)* | 506 (41.7) | 79 (6.5) |
| Do you agree that all people with COVID-19 virus show symptoms? | 701 (57.7) | 292 (24.1)* | 221 (18.2) |
| Do you agree that COVID-19 respiratory droplets are relatively heavy; do not travel far and quickly sink to the ground? | 694 (57.2)* | 243 (20.0) | 277 (22.8) |
| Do you agree that COVID-19 virus can survive for up to 72 hours on plastic and stainless steel, less than 4 hours on copper and less than 24 hours on cardboard? | 849 (69.9)* | 189 (15.6) | 176 (14.5) |
| *Expected correct response | |||
Table 5: Participants’ knowledge towards COVID-19: Distribution of survey responses (n = 1,214)
| Attitude – questions | Survey responses n(%) | ||
|---|---|---|---|
| Agree / Positive | Not agree / Negative | Neutral / Not sure | |
| Do you believe that COVID-19 has a high mortality rate? | 581 (47.9)* | 539 (44.4) | 94 (7.7) |
| Do you believe that COVID-19 is not a very dangerous disease? | 535 (44.1) | 618 (50.9) | 60 (4.9) |
| Do you think that the transmission of COVID-19 virus between humans is high? | 1018 (83.9)* | 154 (12.7) | 42 (3.5) |
| Do you have the ability to follow every preventive instruction against the disease? | 100 (8.2) | 1068 (88.0) | 46 (3.8) |
| Do you believe that TV, radio, and social media information about the disease has been helpful? | 687 (56.6) | 466 (38.4) | 61 (5.0) |
| Do you think travelling across/within the country is safe during these times? | 223 (18.4) | 841 (69.3)* | 150 (12.4) |
| Do you agree that you are likely to quarantine/isolate yourself if you have fever and cough? | 1022 (84.2)* | 135 (11.1) | 57 (4.7) |
| Do you consider yourself to be at risk of COVID-19? | 842 (69.4) | 238 (19.6) | 134 (11.0) |
| Do you agree that due to your work or daily activity you are more likely to get the COVID-19 virus? | 932 (76.8) | 177 (14.6) | 105 (8.6) |
| Don’t you care about this disease; thus, you do your daily activities like before? | 224 (18.5) | 912 (75.1) | 78 (6.4) |
| Do you believe that COVID-19 can be easily prevented by washing hands regularly with soap and water? | 1005 (82.8)* | 134 (11.0) | 75 (6.2) |
| Do you think that COVID-19 can be easily prevented by personal protective equipment such as masks and disposable gloves? | 1029 (84.8)* | 122 (10.0) | 63 (5.2) |
| Do you think that taking some dose of local food ingredients like garlic, honey, or ginger have effectively prevented or cured COVID-19? | 551 (45.4) | 307 (25.3) | 356 (29.3) |
| Do you think that you will probably contract COVID-19 within the coming months? | 407 (33.5) | 328 (27.0) | 479 (39.5) |
| Do you think COVID-19 does not exist in Ethiopia since you have not seen any patients yet? | 90 (7.4) | 1077 (88.7) | 47 (3.9) |
| *Expected correct response | |||
Table 6: Participants’ attitudes towards COVID-19: Distribution of survey responses (n = 1,214)
| Practice – Questions | Survey responses | ||
|---|---|---|---|
| Never (occasionally) | Always (most of the time) | Sometimes | |
| In recent days, have you gone to any crowded place? | 622 (51.2) | 218 (18.0) | 374 (30.8) |
| In recent days, have you worn a mask when leaving home? | 152 (12.5) | 988 (81.4)* | 74 (6.1) |
| In recent days, have you washed your hands frequently? | 122 (9.2) | 975 (80.3)* | 127 (10.5) |
| In recent days, have you practised social distancing? | 385 (31.7) | 552 (45.5) | 277 (22.8) |
| Is it difficult to follow the instructions to prevent this disease? | 587 (48.4) | 220 (18.1) | 407 (33.5) |
| Don’t have the patience to follow hygiene preventive instructions? | 431 (35.5) | 572 (47.1) | 211 (17.4) |
| Is it difficult to wash hands regularly with soap and water? | 890 (73.3)* | 117 (9.6) | 207 (17.1) |
| Do you wear a mask regardless of the presence or absence of symptoms? | 108 (8.9) | 1005 (82.8)* | 101 (8.3) |
| Do you clean your hands with alcohol rubs disinfectant after touching contaminated things? | 115 (9.5) | 929 (76.5)* | 170 (14.0) |
| Is it difficult not to touch mouth, nose, and eyes? | 484 (39.9) | 330 (27.2) | 400 (32.9) |
| Is it difficult to stay at home to prevent the disease? | 300 (24.7)* | 606 (49.9) | 308 (25.4) |
| Do you clean contaminated or reused mask due to cost implication? | 688 (56.7) | 278 (22.9) | 248 (20.4) |
| Is it difficult to change clothes when you come from outside? | 607 (50.0) | 334 (27.5) | 273 (22.5) |
| Is it difficult to change shoes when you come from outside? | 771 (63.5)* | 249 (20.5) | 194 (16.0) |
| Do you spend time with your group of friends? | 613 (50.5) | 222 (18.3) | 379 (31.2) |
| Do you drink tea/coffee from roadside shops if the providers protect themselves and they are clean? | 677 (55.8) | 241 (19.9) | 296 (24.4) |
| Do you eat food from roadside shops if the providers protect themselves and they are clean? | 752 (61.9) | 193 (15.9) | 269 (22.2) |
| Is it difficult to avoid eating from roadside snacks? | 838 (69.0)* | 171 (14.1) | 205 (16.9) |
| Do you clean your mobile with sanitizer? | 630 (51.9) | 294 (24.2) | 290 (23.9) |
| Do you touch your mobile phone with unwashed hands? | 393 (32.4) | 461 (38.0) | 360 (29.7) |
| Do you share your food or water pot with others? | 918 (75.6) | 108 (8.9) | 188 (15.5) |
| Do you wash hands immediately after coughing, rubbing the nose, or sneezing? | 329 (27.1) | 591 (48.7) | 294 (24.2) |
| Do you cover your mouth when coughing and sneezing? | 79 (6.5) | 1049 (86.4)* | 86 (7.1) |
| Have you visited coronavirus-infected area or hospital? | 864 (71.2) | 161 (13.3) | 189 (15.6) |
| Do you deal with COVID-19 sick people or health workers? | 739 (60.9) | 263 (21.7) | 212 (17.5) |
| Do you smoke together while smoking your friend’s cigarettes? | 1162 (95.7)* | 24 (2.0) | 28 (2.3) |
| Do you chew chat together in a friend’s car or at home? | 1121 (92.3)* | 33 (2.7) | 60 (4.9) |
| *Expected correct response | |||
Table 7: Participants’ practice towards COVID-19: Distribution of survey responses (n = 1,214)
| Psychological responses | Survey responses | ||
|---|---|---|---|
| Never | Always | Not sure | |
| Do you feel that no confidence to secure daily income? | 594 (48.9)* | 333 (27.4) | 287 (23.6) |
| Do you feel tired or had little energy and feelings of fatigue during the COVID-19 outbreak? | 759 (62.5) | 164 (13.5) | 291 (24.0) |
| Do you feel that things will not be as normal before or usual again? | 594 (48.9) | 291 (24.0) | 329 (27.1) |
| Do you feel depressed and hopeless? | 870 (71.7)* | 96 (7.9) | 248 (20.4) |
| Do you feel worried that keeping good appetite and health are difficult? | 838 (69.0) | 102 (8.4) | 274 (22.6) |
| Do you feel that it is difficult to concentrate on doing regular activities, reading newspapers, or watching television? | 920 (75.8) | 98 (8.1) | 196 (16.1) |
| Do you feel disturbed while sleeping? | 937 (77.2)* | 69 (5.7) | 208 (17.1) |
| Do you feel that you have no interest or pleasure in doing work or leisure activities? | 914 (75.3)* | 94 (7.7) | 206 (17.0) |
| Do you feel that you have no confidence or plan for the future? | 963 (79.3)* | 86 (7.1) | 165 (13.6) |
| Do you feel that you cannot stop thinking of COVID-19 transmission and its consequences? | 679 (55.9) | 299 (24.6) | 236 (19.4) |
| Do you feel worried that you may stay at home for an indefinite period? | 713 (58.7)* | 167 (13.8) | 334 (27.5) |
| Do you feel that it’s better to die or harm yourself during this outbreak? | 1122 (92.4)* | 36 (3.0) | 56 (4.6) |
| Do you feel that you are not able to defeat the COVID-19 virus? | 983 (81.0)* | 91 (7.5) | 140 (11.5) |
| Do you feel that no social and economic condition will revert to normal? | 819 (67.5) | 150 (12.4) | 245 (20.2) |
| Do you feel that you are stronger than ever because you do physical exercise every day? | 581 (47.9) | 294 (24.2) | 339 (27.9) |
| *Expected correct response | |||
Table 8: Participants’ psychological responses towards COVID-19: Distribution of survey responses (n = 1,214)
Eshetu Lemma Haile1,2,&, Theodros Getachew1, Firehiwot Balay1, Kirubel Menegesha1, Birhanu Hurisa1, Abebe Menegesha1, Gashaw Gebrewold1, Zewdu Assefa1, Aschalew Abayneh1
1Ethiopian Public Health Institute, Addis Ababa, Ethiopia, 2University of Antwerp, Belgium
&Corresponding author: Eshetu Lemma Haile, Ethiopian Public Health Institute, Ethiopia, Email: eshetulema@gmail.com, ORCID: https://orcid.org/0000-0003-3170-007X
Received: 13 Dec 2024, Accepted: 07 Nov 2025, Published: 10 Nov 2025
Domain: Field Epidemiology, COVID-19 Pandemic
Keywords: COVID-19, KAP, Ethiopia, social media, survey
©Eshetu Lemma Haile et al. Journal of Interventional Epidemiology and Public Health (ISSN: 2664-2824). This is an Open Access article distributed under the terms of the Creative Commons Attribution International 4.0 License (https://creativecommons.org/licenses/by/4.0/), which permits unrestricted use, distribution, and reproduction in any medium, provided the original work is properly cited.
Cite this article: Eshetu Lemma Haile et al., Knowledge, attitudes and practices towards COVID-19 in Ethiopia, 2021. Journal of Interventional Epidemiology and Public Health. 2025;8(4):90. https://doi.org/10.37432/jieph-d-24-02045
Introduction: COVID-19, caused by the novel severe acute respiratory syndrome coronavirus 2 (SARS-CoV-2), is a highly contagious respiratory disease that has posed major global and national public health challenges. In Ethiopia, effective prevention and control efforts largely depend on the population’s knowledge, attitudes, and practices (KAP) towards the disease. Assessing these factors provides valuable insights into public awareness, perception, and behavioural responses, which are essential for guiding health education and policy interventions. This study aimed to assess the level of knowledge, attitudes, practices, and psychological responses towards COVID-19 among the Ethiopian population in 2021.
Methods: A cross-sectional study using a convenient sampling technique was conducted, with an online survey administered from June 2020 to July 2021 via the EPHI (Ethiopian Public Health Institute) and FMOH (Federal Ministry of Health) websites. The target population consisted of adult (18+ years) participants residing in Ethiopia.
Results: Of the 1,214 study participants, 84.3% were male, and 15.7% were female. The average scores of knowledge, attitude, practice and psychological response towards COVID-19 were 43.9%, 49.0%, 52.6%, and 53.8% respectively. No significant association was found between knowledge and education, gender, age group, or marital status. However, knowledge and attitude were found to be significantly associated with lower monthly income (<15,000 ETB). In addition, knowledge showed a significant association with employment status (non-students, p<0.05) and urban residency (p=0.003). Psychological responses were significantly related to being employed (p<0.05) and being married (p=0.016). Furthermore, participants’ practices demonstrated significant associations with male gender (p<0.05) and marital status (married, p=0.032). Participants’ practices, including regular use of personal protective equipment (PPE), handwashing, and avoiding contaminated surfaces, were strongly linked to their psychological responses and perceived attitudes. Notably, 88.7% of participants expressed scepticism about the existence of COVID-19 in Ethiopia, as they had not witnessed any cases during the study period, and 88.0% were pessimistic about following preventive measures. There was no significant association between time (over the course of the study) and knowledge, practices, and psychological responses. There was a decrease in participants practising recommended COVID-19 preventive measures over time (β = -0.052). While time had a statistically significant positive effect on attitudes (β =0.107, P=0.001), revealing that individuals` attitudes improved over time
Conclusion: The study revealed generally low levels of knowledge, attitude, practice, and psychological response towards COVID-19 among participants, with socioeconomic and demographic factors influencing these aspects. Although attitudes improved over time, adherence to preventive measures declined, highlighting the need for sustained public health education and behavioural reinforcement.
Severe Acute Respiratory Syndrome Coronavirus 2 (SARS-CoV-2) or COVID-19 is a new respiratory illness caused by a novel Coronavirus, first identified in Wuhan, China, in December 2019. Aside from its global impact, the pandemic has led to an immense loss of lives and placed an overwhelming strain on healthcare systems worldwide. By June 26, 2021, more than 181 million confirmed cases and approximately 4 million deaths had been reported across 222 countries. In Ethiopia, over 275,769 cases, 4,302 deaths, and 258,203 recoveries were recorded by that date [1-3].
The pandemic has posed a major global public health challenge, and the effectiveness of controlling its spread largely depends on the public’s knowledge, attitudes, and practices (KAP). Understanding these factors is crucial to implementing successful public health interventions and guiding policy decisions. In Ethiopia, as in many other low-resource settings, controlling the pandemic has been particularly challenging due to socioeconomic and infrastructural factors, including limited healthcare resources, lower health literacy, and inadequate access to reliable information [4].
The attitudes of individuals towards the pandemic play a crucial role in shaping preventive behaviours. Positive attitudes towards social distancing, wearing masks, and hand hygiene are critical to minimizing transmission. Attitudes towards infection can be influenced by cultural, religious, and social beliefs, and in some cases, misinformation [5, 6].
Practices of the public are essential for controlling the spread of the virus. Studies from various African countries, including Ethiopia, have shown that adherence to these practices can vary based on the availability of resources, government policies, and cultural practices. Furthermore, social norms and perceptions about the virus also influence behavioural practices, where some individuals may not perceive the virus as a threat, leading to lower adherence to recommended practices [7, 8].
KAP theoretical model illustrated that knowledge alone is insufficient to change behaviour. Positive attitudes towards its preventive measures do not always result in compliance, which suggests that other factors, such as self-efficacy, social influence, and logistic challenges, play a critical role in determining health practices [9].
To mitigate the effects of the pandemic, the Ethiopian government implemented several preventive measures, including closing schools, suspending public gatherings and sporting events, halting flights to affected countries, and imposing a mandatory 14-day quarantine for incoming travellers. The House of Peoples’ Representatives declared a five-month state of emergency in response to the rising number of cases. The fight against the pandemic continues, with its ultimate success dependent on the public’s adherence to control measures. Public knowledge, attitudes, and practices concerning COVID-19 play a crucial role in this effort [10-15].
The primary aim of this study was to assess the level of knowledge, attitudes, and practices (KAP) and psychological factors towards COVID-19 among Ethiopian residents and to explore the relationship between sociodemographic variables and these outcomes.
Study design:
A cross-sectional study with a convenience sampling approach was conducted through an online survey from June 20, 2020, to July 20, 2021. The sample size of 1,214 was collected, and the study had >90% power to detect absolute differences of approximately 10 percentage points between equal-sized groups (α = 0.05), and >80% power to detect odds ratios of ≈1.5–2.0 for common outcomes. The survey was administered via the Ethiopian Public Health Institute (EPHI) and the Federal Ministry of Health (FMOH) Facebook pages, both of which have a substantial following. The survey remained open for nearly one-year, with the goal of including participants from both rural and urban areas to enhance the sample size and mitigate potential sampling and selection biases. It was not feasible to conduct a national community-based survey due to movement restrictions and border lockdowns imposed during the pandemic. Government statistics indicate that approximately 20.5 million people in Ethiopia use the internet, with 6 million active Facebook users, reflecting penetration rates of 18% and 5%, respectively [15-17].
Eligibility criteria of participants
The inclusion criteria for this study were individuals who could read and comprehend the questions, were willing to participate, and resided in Ethiopia who were 18 years and older. To ensure a broad representation, the study targeted a large cross section of Ethiopia’s population, including speakers of Amharic, Oromiffa, Tigrinya, Somali, and Afar. The questionnaire, originally in English, was translated into these five local languages to accommodate participants’ language preferences, and they were asked to respond based on the language they were most comfortable with. This approach allowed the study to capture a wide range of experiences and perspectives from diverse linguistic and cultural groups across the country.
Exclusion criteria
Participants were excluded from the study if they could not understand the questionnaire in any of the six available languages (Amharic, Oromiffa, Tigrinya, Somali, Afar, or English) and if questionnaires with major missing information, inconsistent answers, or evidence of random/non-serious responses.
Study variables
Demographic variables of age, sex, income, marital status, education, residence, and employment status were independent variables. Knowledge, attitude, practice and psychological factors were the dependent variables.
Data collection tool
The questionnaire and research approach were based on the Health Belief Model (HBM) and the Theory of Planned Behaviour (TPB), which are used to understand how knowledge, attitudes, practices, and psychological factors influence health-related decision-making and behaviours [9, 18]. A one-page poster for participants’ recruitment and a link to the questionnaire were shared on the EPHI and the FMOH Facebook pages (https://www.facebook.com/ephipage/ and https://www.facebook.com/EthiopiaFMoH/). The poster provided a brief overview of the study’s background, objectives, procedures, and emphasized that participation was voluntary, with guarantees of anonymity and confidentiality. It also included instructions on how to fill out the questionnaires. Informed consent was obtained from each participant. If they agreed to participate, they selected “Yes”; if they declined, they selected “No.” Only those who agreed to participate were directed to the questionnaire.
The demographic section included questions on age, gender, marital status, education, occupation, household income, and place of residence. The questionnaire included 12 items on knowledge, 15 on attitudes, and 25 on practices. In addition to the KAP sections, 16 psychological questions were also developed and posted.
The knowledge section contained 12 questions where four of them related to clinical symptoms (K1-K4), 3 on transmission routes (K5-K7), and five about COVID-19 prevention and control (K8-K12). Response options were “Strongly Agree,” “Agree,” “Neutral/Don’t Know/No Opinion,” “Disagree,” and “Strongly Disagree.” These responses were scored as follows: 5 for “Strongly Agree,” 4 for “Agree,” 3 for “Neutral,” 2 for “Disagree,” and one for “Strongly Disagree.”
The total knowledge score ranged from 12 to 60, with higher scores indicating better knowledge of COVID-19. If respondents answered over 90% of the questions correctly, they were categorized as having “high” knowledge; 80-90% as “moderate” knowledge; and below 80% as “low” knowledge. For the purpose of data analysis and classification the responses categorized as adequate (>=80%) and inadequate score (<80%). This scoring system was also applied to attitudes, practices, and psychological responses with different class categories.
In this study, the original five-point Likert scale—Strongly Agree (5), Agree (4), Neutral/Don’t Know/No Opinion (3), Disagree (2), and Strongly Disagree (1)—was recoded into fewer categories for ease of analysis.
First, the responses were collapsed into three categories:
Subsequently, for further simplification, the responses were collapsed into two categories:
This recoding approach was applied to facilitate binary and categorical statistical analyses by distinguishing between positive and non-positive perceptions or behaviours. The binary categorization was done toto simplify data interpretation, increase statistical power, and make category comparisons more meaningful across the knowledge, attitude, practice, and psychological domains
Data management
Missing data analysis and applied estimation procedures means using the most suitable method (mean substitution, regression, or multiple imputation) depending on how much data were missing and whether the missingness appeared random — all with the goal of keeping the analysis robust, unbiased, and reproducible. to address incomplete responses employed to ensure that the results remained robust and free from bias due to missing information. Data analysis was conducted using SPSS version 21.0, with statistical significance set at p < 0.05 (two-sided). The knowledge scores, attitudes, and practices were compared across demographic groups using independent-samples t-tests, (β), odds ratios, and 95% confidence, as appropriate. Multivariable linear regression analysis was conducted with demographic variables as independent variables and KAP as the dependent variable. Unstandardized regression coefficients (β) and odds ratios (ORs), along with their 95% confidence intervals (CIs), were used to quantify the relationships between variables and KAP outcomes.
Ethical considerations
This study received approval from the Ethiopian Public Health Institute Institutional Review Board (EPHI-IRB), with protocol number EPHI-IRB-264-2020. Each participant provided online informal consent to take part in this survey.
Out of a total of 1,245 responses, 2.7% (34/1,245) were found to be incomplete; however, estimation procedures were applied to address these missing responses. Additionally, 31 responses were excluded from the analysis because the participants were residing abroad, resulting in a final sample size of 1,214 respondents.
The demographic characteristics of the sample revealed a predominantly male cohort, with 84.3% (1,023) male and 15.7% (191) female respondents. The age distribution showed that the majority, 63.3% (769) of participants, were between the ages of 30 and 49, and 89.4% (1,085) of the respondents had completed tertiary education.
Regarding marital and employment status, 60.2% (731) of the participants were married, and 74.9% (909) were employed full-time. Most participants (89.4%, 1,085) lived in urban areas, and 56.8% (690) had a monthly income between 5,000 and 15,000 birrs (Table 1).
The average levels of COVID-19-related adequate knowledge, positive attitudes, positive practices, and psychological impacts among participants were 43.9% (533/1,214), 49.0% (595/1,214), 52.6% (639/1,214), and 53.8% (653/1,214), respectively.
There was no significant correlation between having COVID-19 inadequate knowledge and factors such as education level, gender, age group, or marital status. However, inadequate knowledge was significantly associated (p < 0.05) with individuals earning a monthly income below 15,000 ETB, those who were employed, and those living in urban areas. Similarly, living in an urban area and having a monthly income below 15,000 ETB were significantly associated (p < 0.05) with individuals’ negative attitudes towards COVID-19. Regarding inappropriate practices, being married and male were significantly associated (p < 0.05) compared to being single and female; being male was protective. Inappropriate psychological responses were significantly linked to being employed and married, with the former being protective (Table 2).
Participants with higher knowledge scores were 1.26 times more likely to engage in good preventive practices compared to those with lower knowledge levels, although this association was not statistically significant (β = 0.230, p = 0.064, 95% CI: 0.99–1.61). Conversely, a negative attitude towards COVID-19 significantly reduced the likelihood of practising preventive measures (β = –0.276, p = 0.025, OR = 0.76, 95% CI: 0.60–0.97). In contrast, participants with stronger psychological responses—reflecting higher concern and perceived risk—were twice as likely to adopt recommended practices (β = 0.710, p < 0.05, OR = 2.03, 95% CI: 1.00–4.14). These findings suggest that positive attitudes and heightened psychological awareness are key determinants of effective COVID-19 prevention behaviours. (Table 3).
There was no statistically significant association between time and knowledge, practices, and psychological responses (Table 4). However, COVID-19-related practices and knowledge had a negative relationship over time, implying a small decrease in practice over the course of the year-long study (β = -0.052). These represent only a minimal, non-significant decline (approximately 0.6 points over the one-year study period, calculated as total estimated change = β × 12 = −0.052 × 12 = −0.624 < 1). As time progresses, individuals` attitudes tend to improve (β =0.107). Thus, the data suggested that time does have a statistically significant positive effect on attitudes (P=0.001). Similarly, psychological responses improved with time (β = 0.035), though this was not statistically significant (p=0.244).
The analysis of psychological responses across different employment categories revealed statistically significant differences. Compared with students (reference group), all employment groups—full-time employed (β = –17.086, p < 0.05), part-time employed (β = –17.222, p < 0.05), self-employed (β = –17.332, p < 0.05), unemployed (β = –17.006, p < 0.05), and housewives (β = –17.953, p < 0.05)—showed substantially lower psychological response scores. This indicates that individuals in various employment statuses reported less appropriate or lower psychological responses compared to students. The consistent negative β values suggest that students exhibited relatively stronger or more adaptive psychological responses than their employed or unemployed counterparts (Table 2).
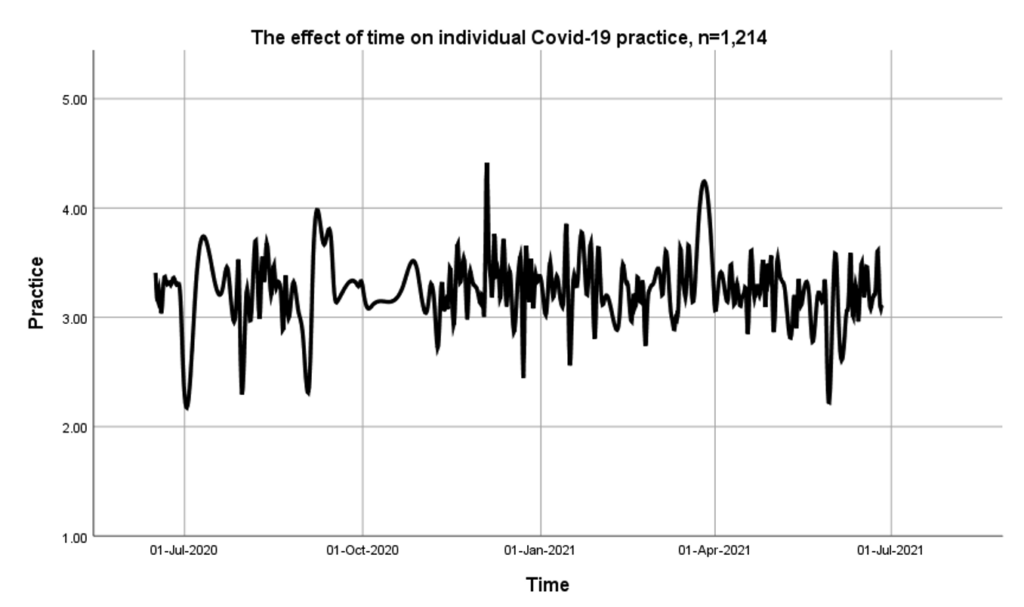
The mean scores (SD) for individuals’ knowledge, attitude, practices, and psychological responses were 3.7 (0.4), 3.3 (0.37), 3.3 (0.34), and 3.9 (0.58), respectively. Over the course of the study, no significant variation was observed in individuals’ practices towards COVID-19 (Figure 1).
Table 4, the results showed a significant positive association between time and attitude (β = 0.107, t = 3.243, p = 0.001), indicating that participants’ attitudes towards COVID-19 prevention and control improved as the pandemic progressed. However, knowledge (β = –0.052, p = 0.119), practice (β = –0.052, p = 0.081), and psychological responses (β = 0.035, p = 0.244) did not show statistically significant changes over time. This suggests that while individuals’ attitudes became more favourable with time, their overall knowledge, preventive practices, and psychological responses remained relatively stable throughout the pandemic period.
In Table 5, the majority of participants demonstrated adequate knowledge, answering correctly regarding key aspects such as the main clinical symptoms (93.4%), COVID-19 transmission mechanisms (94.8%), movement restrictions (86.1%), and virus survival time (69.9%). Notably, a significant portion of participants (57.7%) wrongly believed that COVID-19 symptoms must be present to confirm an infection, while 45.6% correctly stated that everyone, including the young and children, should follow preventive measures for COVID-19.
In Table 6, 83.9% (1,018/1,214) of participants held a positive attitude towards the transmission of COVID-19 from human to human. Additionally, 84.2% of respondents expressed optimism about self-isolating or quarantining if they experienced symptoms like fever and cough. A majority of participants believed that regular handwashing with soap and water, along with the use of personal protective equipment such as masks and disposable gloves, could help prevent COVID-19 infection, with response rates of 82.8% and 84.8%, respectively. Nearly three quarters (69.3%) of participants showed a positive attitude towards avoiding travel within or across the country during the COVID-19 pandemic due to safety concerns.
In the present study, a significant proportion of participants (88.7%) exhibited scepticism regarding the existence of COVID-19 in Ethiopia. Additionally, 88.0% of respondents expressed pessimism towards adhering to the recommended preventive measures for COVID-19, as detailed in Table 6.
Table 7, the majority of participants reported consistent adherence to several key COVID-19 preventive measures. Specifically, 988 participants (81.4%) stated that they always or most of the time wore a mask when leaving home, and 975 (80.3%) reported frequent handwashing. Likewise, 1,005 participants (82.8%) said they wore a mask regardless of symptoms, while 929 (76.5%) regularly cleaned their hands with alcohol-based disinfectants after touching potentially contaminated objects. A substantial 1,049 respondents (86.4%) reported that they covered their mouth when coughing or sneezing, showing strong respiratory hygiene compliance. However, 890 participants (73.3%) found it difficult to wash hands regularly with soap and water, suggesting that consistent hand hygiene remained a challenge for some despite awareness.
Conversely, certain preventive and behavioural habits showed poor adherence. A notable 838 participants (69.0%) indicated that they found it difficult to avoid eating roadside snacks, and 771 (63.5%) said they had difficulty changing shoes after coming from outside. Additionally, 300 respondents (24.7%) reported that staying at home to prevent infection was difficult. Risky group behaviours also persisted: 1,162 participants (95.7%) admitted to smoking together using shared cigarettes, and 1,121 (92.3%) reported chewing Chat together in friends’ cars or homes. Overall, while participants exhibited strong compliance with personal protective measures such as mask use and hand hygiene, social and cultural practices that promote close contact remained prevalent, posing ongoing public health risks (Table 7).
The findings indicate that 92.4% of participants reported never experiencing any form of danger, such as feelings of dying or self-harm, attributed to the physiological effects of the COVID-19 pandemic. Additionally, 81.0% of participants stated that they had successfully overcome the challenges presented by the pandemic. Notably, 79.3% of participants demonstrated psychological readiness and expressed confidence in their ability to combat the virus and plan for the future. While 75.3% of respondents reported no issues with losing interest or pleasure in work or leisure activities during the COVID-19 pandemic. Furthermore, 77.2% of participants indicated they had not experienced sleep disturbances, and 71.7% did not report feelings of depression or hopelessness. The findings reveal that 27.4% of participants expressed concerns about losing confidence in securing their daily income, while 13.8% reported anxiety about being confined to their homes for an indefinite period due to the COVID-19 situation. (Table 8).
A substantial proportion of participants exhibited compliance with public health measures, as they frequently left their homes wearing masks; however, a notable participants indicated that they found it difficult to avoid eating roadside snacks. Furthermore, participants found it difficult to wash hands regularly with soap and water, suggesting that consistent hand hygiene remained a challenge for some despite awareness. Marital status did significantly influence adherence to preventive behaviours.
Studies have shown that good knowledge of disease is associated with higher compliance with recommended preventive measures [4]. The general population had varying levels of knowledge, with urban residents generally possessing more accurate information than those in rural areas [19, 20]. Sociodemographic factors such as age, gender, education level, and geographic location play a critical role in determining KAP towards COVID-19. Younger individuals and those with higher education levels tend to have better knowledge and more favourable attitudes and practices regarding the pandemic [19, 21].
Respondents with lower incomes found it challenging to stay at home to avoid the virus and refrained from drinking tea/coffee from roadside shops, even if the providers took precautions. Contrary to our study, patterns have been observed in South Korea and other countries, where individuals in higher-income brackets were less likely to adhere to strict lockdown measures due to their job-related responsibilities or social expectations [22-24].
During the pandemic, males were more likely to visit crowded places and encountered difficulty changing clothes upon returning home. However, they were diligent about washing their hands after coughing, rubbing their nose, or sneezing. In contrast, they tended to share cigarettes and chew Khat with friends in their cars or homes. Educated participants practised frequent hand washing but found it difficult to avoid touching their mouths, noses, and eyes. Married participants shared cigarettes and chewed Khat together, and they also shared food or drinks with others. This observation is consistent with other research indicating that while education can improve awareness of health guidelines, habitual behaviours were difficult to change [25].
Our study revealed that the overall individual virus-related knowledge score was 43.9%. Although most participants were educated, no significant association was found between knowledge and educational level, which differs from other studies where knowledge was positively correlated with education [1, 26-30]. However, significant associations were found between knowledge and monthly income, employment status, and urban residence. Similar findings were documented in studies, where higher knowledge scores were associated with employment and urban living [17, 31-34].
Most online participants were aged 30-49 years, had completed tertiary education, were male, married, employed full-time, lived in urban areas, and had medium monthly incomes (5,000-15,000 ETB). These findings were similar to other studies where most participants were male [3, 35]. This could be because men in many Ethiopian families are the primary income earners and may have been more compelled to work, which resulted in less adherence to lockdowns/social distancing.
Attitudes were significantly associated with residence and income status. Living in urban areas and having low or medium incomes had negative attitudes compared to rural residents and higher-income earners. Virus-related practices, such as the regular use of PPE, handwashing, and avoiding contaminated surfaces, were significantly related to attitudes. Similar results were observed elsewhere [2, 17, 34].
Our study had similar findings in Uganda, where participants showed lower adherence to public health measures [30]. In Malawi, people with no formal education had more relaxed attitudes, while in our study, education was not significantly associated with attitudes, but residence was, with urban residents displaying more relaxed attitudes than rural residents [16, 35].
Virus-related practices were significantly associated with being male and married. Studies from Uganda and Iran found that adherence to public health measures varied with factors like sex, education level, age, region, and employment status, which was inconsistent in our study [4, 30]. Study from Saudi Arabia, where men were less likely to adopt proper prevention measures compared to women. In Saudi Arabia, poor practices were 41.7%, which is lower than the 52.6% observed in our study, possibly due to differences in the study period [26, 31, 36, 37]. In Malawi, the biggest barrier to practising preventive measures was the lack of money and resources, while in our study, income did not significantly affect individual practices [16, 38].
Previous studies [14, 39] found that knowledge scores on COVID-19 in many low- and middle-income countries were generally below optimal levels, with individuals possessing higher educational attainment and better access to health education demonstrating significantly greater knowledge, which may not translate into practice adherence due to economic constraints, misinformation, and limited enforcement of health protocols [40]. However, in our study, no such notable difference was observed between those with higher education and those with only primary school education regarding their knowledge of the virus.
Our research has shown that people who were employed and all other employment group, experienced higher levels of stress, anxiety, and fear due to the risk of exposure to the virus and the economic strain during lockdowns as compared to student. A study by Vindegaard and Eriksen Benros [41] found that unemployment or economic instability during the pandemic exacerbated feelings of anxiety, depression, and uncertainty. On the other hand, marital status also influenced psychological outcomes. Contrary to our findings, another study suggested that married individuals or those in stable relationships generally reported lower levels of anxiety and distress compared to single individuals, possibly due to the emotional support offered by a partner during a crisis [42].
The study observed negative attitudes towards the existence of COVID-19 in Ethiopia. A study by Abate et al. (43) found that some Ethiopians questioned the reality of the COVID-19 pandemic, with some attributing the virus to political motives or external interference. Additionally, beliefs in traditional medicine as a cure for COVID-19 also led to a lack of trust in public health measures. [44].
Our study indicates that participants’ attitudes towards COVID-19 prevention and control significantly improved over time, despite relatively stable levels of knowledge, practices, and psychological responses. This positive shift in attitude may reflect the cumulative impact of continuous public health messaging, increased exposure to media campaigns, and personal experience with the evolving pandemic situation. Similar studies have reported that repeated health communication and increased societal awareness can lead to gradual improvement in public attitudes even when knowledge and behavioural practices plateau [17, 45]. The lack of significant change in knowledge and practice might be attributed to information fatigue, reduced perception of risk, or adaptation to pandemic routines as the situation prolonged. Furthermore, the stability in psychological responses suggests a level of resilience or normalization of pandemic-related stress over time. These findings underscore the importance of maintaining ongoing, evidence-based public health education and engagement strategies to sustain positive attitudes and translate them into consistent preventive behaviours.
Restoring normalcy has been challenging, as observed globally during the COVID-19 pandemic [42-43]. However, in our study, participants remained psychologically strong and maintained a positive outlook, believing that life would return to normal once the pandemic ended.
Given the gender imbalance and the challenges in reaching rural populations due to limited internet access, it would be helpful to use a more inclusive sampling approach that tackles these biases. This could include offline surveys or mobile-based platforms to better capture a wider range of participants. Without this, there’s a risk of over-representing male perspectives while under-representing female experiences, which could affect how representative the results are of the broader population. Additionally, the study might disproportionately reflect urban populations with better internet access, which could further skew the findings and limit their generalizability.
Therefore, further research could also examine the effectiveness of specific interventions, such as community engagement strategies or tailored health communication campaigns, to improve knowledge and practices regarding COVID-19 and other infectious diseases prevention. Additionally, exploring the influence of cultural and socioeconomic factors on attitudes and practices could provide a deeper understanding of the barriers to adopting preventive measures, especially in rural and low-income communities.
Limitation
Given the skewed gender distribution and the challenges in reaching rural populations due to limited internet access, it would be beneficial to employ a more inclusive sampling method that addresses these biases, potentially incorporating offline surveys or mobile-based platforms to reach a broader segment of the population. Exploring the influence of cultural and socioeconomic factors on attitudes and practices could provide a deeper understanding of the barriers to adopting preventive measures, especially in rural and low-income communities.
The study revealed generally low levels of knowledge, attitude, practice, and psychological response towards COVID-19 among participants, with socioeconomic and demographic factors influencing these aspects. Lower income, non-student employment, and urban residency were linked to better knowledge, while gender and marital status affected preventive practices. Although attitudes improved over time, adherence to preventive measures declined, highlighting the need for sustained public health education and behavioural reinforcement.
What is already known about the topic
What this study adds
The authors express their gratitude to all participants involved in this project, as well as the healthcare workers who serve and protect their communities, particularly those on the frontlines during the COVID-19 pandemic.
Availability of data
The datasets used and/or analysed during this study are available upon reasonable request from the corresponding author.
| Variable | Frequency | Percentage |
|---|---|---|
| Gender | ||
| Male | 1023 | 84.3 |
| Female | 191 | 15.7 |
| Age (years) | ||
| 18 – 29 | 415 | 34.2 |
| 30 – 49 | 769 | 63.3 |
| 50 – 59 | 25 | 2.1 |
| 60+ | 5 | 0.4 |
| Education | ||
| Primary | 66 | 5.4 |
| Secondary | 63 | 5.2 |
| College/university | 1085 | 89.4 |
| Marital status | ||
| Married | 731 | 60.2 |
| Widowed | 13 | 1.1 |
| Separated | 12 | 1.0 |
| Divorced | 16 | 1.3 |
| Single | 442 | 36.4 |
| Employment status | ||
| Full-time employed | 909 | 74.9 |
| Part-time employed | 86 | 7.1 |
| Self-employed | 83 | 6.8 |
| Unemployed | 56 | 4.6 |
| Housewife | 9 | 0.7 |
| Student | 69 | 5.7 |
| Retired | 2 | 0.2 |
| Residence | ||
| Rural | 129 | 10.6 |
| Urban | 1085 | 89.4 |
| Monthly Income (Birr) | ||
| Below 5,000 | 223 | 18.4 |
| 5,000 – 15,000 | 690 | 56.8 |
| Above 15,000 | 301 | 24.8 |
| Variables | Knowledge | Attitude | Practice | Psychological response | ||||||||
|---|---|---|---|---|---|---|---|---|---|---|---|---|
| Inadequate (n, %) | Adequate (n, %) | β (p-value) | Negative (n, %) | Positive (n, %) | β (p-value) | Inappropriate (n, %) | Appropriate (n, %) | β (p-value) | Inappropriate (n, %) | Appropriate (n, %) | β (p-value) | |
| Sex | ||||||||||||
| Male | 568(55.5) | 455(44.5) | 0.17(0.920) | 517(50.5) | 506(49.5) | -0.15(0.929) | 516(50.4) | 507(49.6) | -0.764(<0.05) | 463(45.3) | 560(54.7) | 0.168(0.316) |
| Female | 113(59.2) | 78(40.8) | REF | 102(53.4) | 89(46.6) | REF | 59(30.9) | 132(69.1) | REF | 98(51.3) | 93(48.7) | REF |
| Age in years | ||||||||||||
| 18–29 | 227(54.7) | 188(45.3) | 0.610(0.602) | 197(47.5) | 218(52.5) | 0.230(0.816) | 201(48.4) | 214(51.6) | 0.885(0.375) | 200(48.2) | 215(51.8) | 0.463(0.649) |
| 30–49 | 438(57.0) | 331(43.0) | 0.645(0.579) | 403(52.4) | 366(47.6) | 0.183(0.851) | 365(47.5) | 404(52.5) | 0.865(0.382) | 350(45.5) | 419(54.5) | 0.373(0.711) |
| 50–59 | 12(48.0) | 13(52.0) | 1.219(0.321) | 16(64.0) | 9(36.0) | -0.197(0.852) | 6(24.0) | 19(76.0) | 1.634(0.135) | 9(36.0) | 16(64.0) | 0.804(0.461) |
| 60+ | 4(80.0) | 1(20.0) | REF | 3(60.0) | 2(40.0) | REF | 3(60.0) | 2(40.0) | REF | 2(40.0) | 3(60.0) | REF |
| Educational level | ||||||||||||
| Primary | 37(56.1) | 29(43.9) | -0.169(0.521) | 32(48.5) | 34(51.5) | -0.051(0.848) | 27(40.9) | 39(59.1) | 0.170(0.530) | 39(59.1) | 27(40.9) | -0.475(0.075) |
| Secondary | 40(63.5) | 23(36.5) | -0.464(0.100) | 33(52.4) | 30(47.6) | -0.188(0.493) | 26(41.3) | 37(58.7) | 0.180(0.512) | 33(52.4) | 30(47.6) | -0.137(0.611) |
| College/university | 604(55.7) | 481(44.3) | REF | 554(51.1) | 531(48.9) | REF | 522(48.1) | 563(51.9) | REF | 489(45.1) | 596(54.9) | REF |
| Marital status | ||||||||||||
| Married | 416(56.9) | 315(43.1) | -0.125(0.375) | 395(54.0) | 336(46.0) | -0.260(0.063) | 335(45.8) | 396(54.2) | 0.301(0.032) | 309(42.3) | 422(57.7) | 0.337(0.016) |
| Widowed | 7(53.8) | 6(46.2) | 0.020(0.997) | 4(30.8) | 9(69.2) | 0.740(0.246) | 3(23.1) | 10(76.9) | 1.122(0.105) | 10(76.9) | 3(23.1) | -0.980(0.151) |
| Separated | 9(75.0) | 3(25.0) | -0.902(0.195) | 7(58.3) | 5(41.7) | -0.344(0.575) | 4(33.3) | 8(66.7) | 0.482(0.456) | 8(66.7) | 4(33.3) | -0.523(0.411) |
| Divorced | 9(56.3) | 7(43.7) | -0.147(0.778) | 5(31.3) | 11(68.8) | 0.740(0.185) | 6(37.5) | 10(62.5) | 0.529(0.330) | 10(62.5) | 6(37.5) | -0.519(0.330) |
| Single | 240(54.3) | 202(45.7) | REF | 208(47.1) | 234(52.9) | REF | 227(37.5) | 215(48.6) | REF | 224(50.7) | 218(49.3) | REF |
| Employment status | ||||||||||||
| Full-time employed | 496(54.6) | 413(45.4) | 16.740(<0.05) | 452(49.7) | 457(50.3) | -0.159(0.916) | 446(49.1) | 463(50.9) | -0.534(0.727) | 406(44.7) | 503(55.3) | -17.086(<0.05) |
| Part-time employed | 42(48.8) | 44(51.2) | 16.944(<0.05) | 38(44.2) | 48(55.8) | -0.013(0.993) | 44(51.2) | 42(48.8) | -0.630(0.684) | 43(50.0) | 43(50.0) | -17.222(<0.05) |
| Self-employed | 56(67.5) | 27(32.5) | 16.232(<0.05) | 51(61.4) | 32(38.6) | -0.638(0.674) | 34(41.0) | 49(59.0) | -0.346(0.823) | 43(51.8) | 40(48.2) | -17.332(<0.05) |
| Unemployed | 32(57.1) | 24(42.9) | 16.524(<0.05) | 32(57.1) | 24(42.9) | -0.640(0.675) | 18(32.1) | 38(67.9) | 0.121(0.938) | 26(46.4) | 30(53.6) | -17.006(<0.05) |
| Housewife | 7(77.8) | 2(22.2) | 15.626(<0.05) | 7(77.8) | 2(22.2) | 1.423(0.407) | 3(33.3) | 6(66.7) | -0.648(0.703) | 6(66.7) | 3(33.3) | -17.953(<0.05) |
| Student | 48(67.6) | 23(33.3) | REF | 39(54.9) | 32(45.1) | REF | 30(42.2) | 41(57.7) | REF | 37(52.1) | 34(47.8) | REF |
| Residence | ||||||||||||
| Urban | 626(57.4) | 459(42.3) | 0.579(0.003) | 569(52.4) | 516(47.6) | 0.485(0.015) | 516(47.6) | 569(52.4) | -0.026(0.895) | 494(45.5) | 591(54.5) | -0.170(0.386) |
| Rural | 55(42.6) | 74(57.4) | REF | 50(38.8) | 79(61.2) | REF | 59(45.7) | 70(54.3) | REF | 67(51.9) | 62(48.1) | REF |
| Income | ||||||||||||
| Below 5,000 | 111(49.8) | 112(50.2) | 0.579(0.005) | 102(45.7) | 121(54.3) | 0.447(0.025) | 95(42.6) | 128(57.1) | 0.069(0.731) | 107(48.0) | 116(52.0) | -0.072(0.718) |
| 5,000–15,000 | 378(54.8) | 312(45.2) | 0.341(0.023) | 337(48.8) | 353(51.2) | 0.327(0.026) | 351(50.9) | 339(49.1) | -0.221(0.134) | 327(47.4) | 363(52.6) | -0.180(0.221) |
| Above 15,000 | 192(63.8) | 109(36.2) | REF | 180(59.8) | 121(40.2) | REF | 129(42.9) | 172(57.1) | REF | 127(42.2) | 174(57.8) | REF |
| Category | Practice | |||
|---|---|---|---|---|
| β | Sig. (p-value) | Odds ratio | 95% CI | |
| Knowledge | 0.230 | 0.064 | 1.259 | (0.99 – 1.61) |
| Attitude | -0.276 | 0.025 | 0.758 | (0.60 – 0.97) |
| Psychological responses | 0.710 | <0.05 | 2.034 | (1.01 – 4.14) |
| Category | Time (over the course of pandemic) | ||
|---|---|---|---|
| β | T-test | Sig. (p-value) | |
| Knowledge | -0.052 | -1.561 | 0.119 |
| Attitude | 0.107 | 3.243 | 0.001 |
| Practice | -0.052 | -1.747 | 0.081 |
| Psychological responses | 0.035 | 1.166 | 0.244 |
| Knowledge questions | Survey responses | ||
|---|---|---|---|
| Agree | Not agree | Neutral or not sure | |
| Do you agree that the main clinical symptoms of COVID-19 are fever, fatigue, dry cough, and difficult breathing? | 1134 (93.4)* | 35 (2.9) | 45 (3.7) |
| Do you agree that currently no effective cure for COVID-19-2019, but early symptomatic and supportive treatment can help most patients recover from the infection? | 1037 (85.4)* | 98 (8.1) | 79 (6.5) |
| Do you accept that not all persons with COVID-19-2019 will develop to severe cases? Only those who are elderly, have chronic illnesses, and are obese are more likely to be severe cases | 891 (73.4)* | 254 (20.9) | 69 (5.7) |
| Do eating or contacting wild animals would result infection by COVID-19 virus? | 560 (46.1) | 277 (22.8)* | 377 (31.1) |
| Do you agree that persons with COVID-19-2019 cannot transmit the virus to others when a fever is not present? | 909 (74.9) | 244 (20.1)* | 61 (5.0) |
| Does COVID-19 virus spreads via respiratory droplets of infected individuals? | 1151 (94.8)* | 27 (2.2) | 36 (3.0) |
| Do ordinary residents can wear general medical masks to prevent the infection by the COVID-19 virus? | 724 (59.6)* | 430 (35.4) | 60 (4.9) |
| Do you agree that children and young adults should not take any preventive measures of COVID-19 virus? | 639 (52.6) | 554 (45.6)* | 21 (1.7) |
| Do you agree that to prevent COVID-19 infection, individuals should avoid going to crowded place such as stadium, train stations, recreational, market area, and avoid taking public transportations? | 1045 (86.1)* | 123 (10.1) | 46 (3.8) |
| Do you agree that isolation and treatment of people who are infected with the COVID-19 virus are effective ways to reduce the spread of the virus? | 1128 (92.9)* | 60 (4.9) | 26 (2.1) |
| Do you agree that people who have contact with someone infected with the COVID-19 virus should be immediately isolated in a designated place? | 1043 (85.9)* | 71 (5.8) | 100 (8.2) |
| Do you agree that the incubation period for COVID-19, which is the time between exposure to the virus and symptom onset, is on average 2-14 days? | 629 (51.8)* | 506 (41.7) | 79 (6.5) |
| Do you agree that all people with COVID-19 virus show symptoms? | 701 (57.7) | 292 (24.1)* | 221 (18.2) |
| Do you agree that COVID-19 respiratory droplets are relatively heavy; do not travel far and quickly sink to the ground? | 694 (57.2)* | 243 (20.0) | 277 (22.8) |
| Do you agree that COVID-19 virus can survive for up to 72 hours on plastic and stainless steel, less than 4 hours on copper and less than 24 hours on cardboard? | 849 (69.9)* | 189 (15.6) | 176 (14.5) |
| *Expected correct response | |||
| Attitude – questions | Survey responses n(%) | ||
|---|---|---|---|
| Agree / Positive | Not agree / Negative | Neutral / Not sure | |
| Do you believe that COVID-19 has a high mortality rate? | 581 (47.9)* | 539 (44.4) | 94 (7.7) |
| Do you believe that COVID-19 is not a very dangerous disease? | 535 (44.1) | 618 (50.9) | 60 (4.9) |
| Do you think that the transmission of COVID-19 virus between humans is high? | 1018 (83.9)* | 154 (12.7) | 42 (3.5) |
| Do you have the ability to follow every preventive instruction against the disease? | 100 (8.2) | 1068 (88.0) | 46 (3.8) |
| Do you believe that TV, radio, and social media information about the disease has been helpful? | 687 (56.6) | 466 (38.4) | 61 (5.0) |
| Do you think travelling across/within the country is safe during these times? | 223 (18.4) | 841 (69.3)* | 150 (12.4) |
| Do you agree that you are likely to quarantine/isolate yourself if you have fever and cough? | 1022 (84.2)* | 135 (11.1) | 57 (4.7) |
| Do you consider yourself to be at risk of COVID-19? | 842 (69.4) | 238 (19.6) | 134 (11.0) |
| Do you agree that due to your work or daily activity you are more likely to get the COVID-19 virus? | 932 (76.8) | 177 (14.6) | 105 (8.6) |
| Don’t you care about this disease; thus, you do your daily activities like before? | 224 (18.5) | 912 (75.1) | 78 (6.4) |
| Do you believe that COVID-19 can be easily prevented by washing hands regularly with soap and water? | 1005 (82.8)* | 134 (11.0) | 75 (6.2) |
| Do you think that COVID-19 can be easily prevented by personal protective equipment such as masks and disposable gloves? | 1029 (84.8)* | 122 (10.0) | 63 (5.2) |
| Do you think that taking some dose of local food ingredients like garlic, honey, or ginger have effectively prevented or cured COVID-19? | 551 (45.4) | 307 (25.3) | 356 (29.3) |
| Do you think that you will probably contract COVID-19 within the coming months? | 407 (33.5) | 328 (27.0) | 479 (39.5) |
| Do you think COVID-19 does not exist in Ethiopia since you have not seen any patients yet? | 90 (7.4) | 1077 (88.7) | 47 (3.9) |
| *Expected correct response | |||
| Practice – Questions | Survey responses | ||
|---|---|---|---|
| Never (occasionally) | Always (most of the time) | Sometimes | |
| In recent days, have you gone to any crowded place? | 622 (51.2) | 218 (18.0) | 374 (30.8) |
| In recent days, have you worn a mask when leaving home? | 152 (12.5) | 988 (81.4)* | 74 (6.1) |
| In recent days, have you washed your hands frequently? | 122 (9.2) | 975 (80.3)* | 127 (10.5) |
| In recent days, have you practised social distancing? | 385 (31.7) | 552 (45.5) | 277 (22.8) |
| Is it difficult to follow the instructions to prevent this disease? | 587 (48.4) | 220 (18.1) | 407 (33.5) |
| Don’t have the patience to follow hygiene preventive instructions? | 431 (35.5) | 572 (47.1) | 211 (17.4) |
| Is it difficult to wash hands regularly with soap and water? | 890 (73.3)* | 117 (9.6) | 207 (17.1) |
| Do you wear a mask regardless of the presence or absence of symptoms? | 108 (8.9) | 1005 (82.8)* | 101 (8.3) |
| Do you clean your hands with alcohol rubs disinfectant after touching contaminated things? | 115 (9.5) | 929 (76.5)* | 170 (14.0) |
| Is it difficult not to touch mouth, nose, and eyes? | 484 (39.9) | 330 (27.2) | 400 (32.9) |
| Is it difficult to stay at home to prevent the disease? | 300 (24.7)* | 606 (49.9) | 308 (25.4) |
| Do you clean contaminated or reused mask due to cost implication? | 688 (56.7) | 278 (22.9) | 248 (20.4) |
| Is it difficult to change clothes when you come from outside? | 607 (50.0) | 334 (27.5) | 273 (22.5) |
| Is it difficult to change shoes when you come from outside? | 771 (63.5)* | 249 (20.5) | 194 (16.0) |
| Do you spend time with your group of friends? | 613 (50.5) | 222 (18.3) | 379 (31.2) |
| Do you drink tea/coffee from roadside shops if the providers protect themselves and they are clean? | 677 (55.8) | 241 (19.9) | 296 (24.4) |
| Do you eat food from roadside shops if the providers protect themselves and they are clean? | 752 (61.9) | 193 (15.9) | 269 (22.2) |
| Is it difficult to avoid eating from roadside snacks? | 838 (69.0)* | 171 (14.1) | 205 (16.9) |
| Do you clean your mobile with sanitizer? | 630 (51.9) | 294 (24.2) | 290 (23.9) |
| Do you touch your mobile phone with unwashed hands? | 393 (32.4) | 461 (38.0) | 360 (29.7) |
| Do you share your food or water pot with others? | 918 (75.6) | 108 (8.9) | 188 (15.5) |
| Do you wash hands immediately after coughing, rubbing the nose, or sneezing? | 329 (27.1) | 591 (48.7) | 294 (24.2) |
| Do you cover your mouth when coughing and sneezing? | 79 (6.5) | 1049 (86.4)* | 86 (7.1) |
| Have you visited coronavirus-infected area or hospital? | 864 (71.2) | 161 (13.3) | 189 (15.6) |
| Do you deal with COVID-19 sick people or health workers? | 739 (60.9) | 263 (21.7) | 212 (17.5) |
| Do you smoke together while smoking your friend’s cigarettes? | 1162 (95.7)* | 24 (2.0) | 28 (2.3) |
| Do you chew chat together in a friend’s car or at home? | 1121 (92.3)* | 33 (2.7) | 60 (4.9) |
| *Expected correct response | |||
| Psychological responses | Survey responses | ||
|---|---|---|---|
| Never | Always | Not sure | |
| Do you feel that no confidence to secure daily income? | 594 (48.9)* | 333 (27.4) | 287 (23.6) |
| Do you feel tired or had little energy and feelings of fatigue during the COVID-19 outbreak? | 759 (62.5) | 164 (13.5) | 291 (24.0) |
| Do you feel that things will not be as normal before or usual again? | 594 (48.9) | 291 (24.0) | 329 (27.1) |
| Do you feel depressed and hopeless? | 870 (71.7)* | 96 (7.9) | 248 (20.4) |
| Do you feel worried that keeping good appetite and health are difficult? | 838 (69.0) | 102 (8.4) | 274 (22.6) |
| Do you feel that it is difficult to concentrate on doing regular activities, reading newspapers, or watching television? | 920 (75.8) | 98 (8.1) | 196 (16.1) |
| Do you feel disturbed while sleeping? | 937 (77.2)* | 69 (5.7) | 208 (17.1) |
| Do you feel that you have no interest or pleasure in doing work or leisure activities? | 914 (75.3)* | 94 (7.7) | 206 (17.0) |
| Do you feel that you have no confidence or plan for the future? | 963 (79.3)* | 86 (7.1) | 165 (13.6) |
| Do you feel that you cannot stop thinking of COVID-19 transmission and its consequences? | 679 (55.9) | 299 (24.6) | 236 (19.4) |
| Do you feel worried that you may stay at home for an indefinite period? | 713 (58.7)* | 167 (13.8) | 334 (27.5) |
| Do you feel that it’s better to die or harm yourself during this outbreak? | 1122 (92.4)* | 36 (3.0) | 56 (4.6) |
| Do you feel that you are not able to defeat the COVID-19 virus? | 983 (81.0)* | 91 (7.5) | 140 (11.5) |
| Do you feel that no social and economic condition will revert to normal? | 819 (67.5) | 150 (12.4) | 245 (20.2) |
| Do you feel that you are stronger than ever because you do physical exercise every day? | 581 (47.9) | 294 (24.2) | 339 (27.9) |
| *Expected correct response | |||
