Research | Open Access | Volume 8 (4): Article 94 | Published: 19 Nov 2025
Views: 1,401
Menu, Tables and Figures
| Atribute | Verification criteria | Parameter | Result | Score / Rating |
|---|---|---|---|---|
| Simplicity | Number of variables in the system (log book) | ≤20 variables, simple = 1 ˃20 variables, complex = 0 | 12 = 1 Point | 0 to 5 points Rating: <3 Simple, >3 Complex |
| Number of instruments to fill in the system | 1 Instrument, simple = 1 >1 Instrument, complex = 0 | 2 = 0 Point | Achieved: 3/5 = Simple | |
| Information delivery levels | ≤3 Levels, simple = 1 >3 Levels, complex = 0 | 1 = 1 Point | ||
| Information sending mode | Online, simple = 1 Offline, complex = 0 | Online = 1 Point | ||
| Existence of other surveillance systems operated by the same technician | There are no other systems, simple = 1 There are other systems, complex = 0 | There are other surveillance systems operated by the same technician = 0 Point | ||
| Acceptability | Completeness of variables (Age, diarrhea onset date, diarrhea frequency, dehydration) | ≥75% good = 2 51–74% regular = 1 <50% low = 0 | 0 = 98.4% | 0–1 Points Classification: ≥1 Acceptable, 0 Not acceptable Achieved: 1 Point = Good acceptability |
| Data quality | Completeness of fields | ≥75% good = 2 51–74% regular = 1 <50% bad = 0 | 2 = 87.5% | 0–2 Points Rating: 2 = good quality <2 = bad quality |
| Completeness of data = (Number of unfilled forms / Total observed forms) × 100 | 51–74% regular = 1 <50% bad = 0 | |||
| Consistency between logbook data and SISMA Consistency = (Logbook recounted data – Reported Data) / (Logbook recounted data) × 100 | Deviation <10% = good = 2 10–20% = medium = 1 >20% = low = 0 | Deviation 2020 = 22% Deviation 2019 = 87% | Achieved: 1 Point = Bad quality Bad = 0 Points | |
| Representativeness | Distribution of diarrhea & cholera cases by person, time, place | Allows analysis = 1 Does not allow = 0 | Representative = 1 Point | 0–1 Points 1 = representative Achieved: 1 Point |
| Timeliness | Interval between onset of symptoms, sample collection, and receipt of results | ≤5 days timely = 1 >5 days not timely = 0 | 1 = 3-day average | 0–1 Points 1 = timely Achieved: 1 Point |
| Stability | Check HISME data by epidemiological week | Yes = 1 No = 0 | Yes = 1 Point | 0–1 Points 1 = stable Achieved: 1 Point |
Table 1. Criteria, Parameters and Results of the Evaluation of the Diarrheal Disease Surveillance System in Nampula Province, Nampula, Monapo and Meconta Districts, 2019–2020

Beatriz Nhantumbo1,&, Dionísia Balate1, Cidia Francisco1,2, Felisberto Muteca3, Cristolde Salomão1, Cynthia Baltazar1, Erika Rossetto4
1Field Epidemiology Training Program, National Institute of Health, Maputo, Mozambique, 2Faculty of Sciences at Eduardo Mondlane University, Mozambique, 3National Institute of Health, Nampula, Mozambique, 4MassGenics assigned to the Centres for Disease Control and Prevention, Mozambique
&Corresponding author: Beatriz Nhantumbo, Field Epidemiology Training Program, Mozambique National Institute of Health, Maputo, Mozambique Email: beatrizfnhantumbo@gmail.com
Received: 30 May 2024, Accepted: 18 Nov 2025, Published: 19 Nov 2025
Domain: Surveillance System Evaluation
Keywords: Sentinel Surveillance, Diarrhoea, Public Health Surveillance, Mozambique
©Beatriz Nhantumbo et al. Journal of Interventional Epidemiology and Public Health (ISSN: 2664-2824). This is an Open Access article distributed under the terms of the Creative Commons Attribution International 4.0 License (https://creativecommons.org/licenses/by/4.0/), which permits unrestricted use, distribution, and reproduction in any medium, provided the original work is properly cited.
Cite this article: Beatriz Nhantumbo et al. Evaluation of the diarrheal disease surveillance system, Nampula-Mozambique, 2019-2020. Journal of Interventional Epidemiology and Public Health. 2025;8(4):94. https://doi.org/10.37432/jieph.2025.8.4.93
Introduction: Diarrhoea is considered the fourth leading cause of mortality in Mozambique, and the northern region has a seasonal occurrence of outbreaks. The study aims to evaluate the surveillance system for diarrheal diseases in the districts of Nampula, Monapo, 2019-2020.
Methods: Updated US Centres for Disease Control and Prevention guidelines were used to evaluate the public health surveillance system; specifically, the qualitative attributes of simplicity, acceptability and quality of data and the quantitative attributes: representativeness, stability and timeliness for the period 2019-2020. Diarrhoea/cholera record books and investigation forms were used as data sources. Informal conversations were also held with surveillance technicians to understand how the system works.
Results: The surveillance system for diarrheal diseases/cholera is simple, with a logbook containing 12 variables, and the information is sent via the internet to the Health Information System for the Monitoring and Evaluation of Diarrheal Diseases/Cholera of the Ministry of Health of Mozambique. The system was acceptable at 89.4%, representative, with a total of 1,356 diarrhoea cases reported, of which 50.3% (682/1,356) were female, 14.7% (199/1,356) in age groups 1-4. Data quality was 54.5%, timely, with results being received in 3 days on average. 75.0% (3/4) collected the sample within one day. The system was considered stable, as it remained operational throughout the period analysed.
Conclusions: The surveillance system for diarrheal diseases achieves the objectives for which it was created. It is simple, acceptable, representative, timely, and stable, but with a poor quality of data, so it is recommended to improve the quality of the data and intensify the investigation of cases.
Diarrhoea is defined as the occurrence of three or more soft or liquid bowel movements in the last 24 hours, and it is the main cause of death in children under 5 years of age [1,2]. Cholera is a diarrheal disease caused by Vibrio cholerae and is a major public health problem in developing countries, with sub-Saharan Africa being one of the most affected regions, with mortality rates of 50-150 per 100,000 inhabitants in all age groups [1,3]. It is estimated that 2.86 million cases of cholera occur each year in endemic countries [4].
Mozambique is an endemic country for acute diarrheal diseases, including Cholera, which has an epidemic behaviour and is a major public health problem, as it can quickly lead to death if not treated in time. Cholera is highly seasonal, with a marked concentration of cases during the hot and rainy season, especially in the provinces of Cabo Delgado, Nampula, Tete and Sofala between February and March. Its occurrence can be defined as endemic with occasional epidemic peaks. The annual incidence varies from 0 to 211 per 100,000 inhabitants, with a lethality rate of between 0.2% and 4.3% [5].
In recent years, cholera outbreaks have tended to occur in all months of the year, reversing the characteristic seasonality of the disease restricted to the rainy season [5]. These outbreaks can cause far-reaching socio-economic disruption to people’s lives [6]. During the period of 27 highest incidence in the northern region, Nampula province recorded 59,212 cases of diarrhoea in 2019 and 56,719 in 2020 [7]. The World Health Organization (WHO) recommends that countries assess public health events involving cholera [8,9]. Evaluating the surveillance system for diarrheal diseases is important for improving public health intervention strategies [7,10]. This study evaluated the surveillance system for diarrheal diseases in the districts of Nampula, 31 Monapo and Meconta from 2019 to 2020.
To evaluate the surveillance system for diarrheal diseases, the updated United States of America Centers for Disease Control and Prevention, guidelines for the Evaluation of Public Health Surveillance Systems [11] were used to evaluate the qualitative attributes: simplicity, acceptability and quality of data and the quantitative attributes: representativeness, stability and timeliness (Table 1) and the usefulness of the system. Our sources of data were logbooks for screening appointments, the diarrhoea/cholera investigation forms and the Health Information System for Monitoring and Evaluation (HISME), which we used to compare with the registration books. Informal conversations were also held with the surveillance technicians to understand how the system worked, the flow of information and also to check whether the surveillance technicians operated other surveillance systems. Scorecards were used to evaluate (no specific questionnaire was drawn up). The study was carried out in the districts of Nampula (health unit 1st de May and and Anchilo), Monapo (health unit Monapo and Carapira) and Meconta (health unit Meconta and Namialo). The districts were selected for convenience, and the health units (HU) and months were selected by simple random sampling using Microsoft Excel, using the RAND formula. Sociodemographic data and symptoms (date of onset of diarrhoea) were collected at the health centers. The data was collected for a three months period, namely, Nampula district 2019 (January, June, August), 2020 (January, June, December), Monapo district 2019 (February, May, December), 2020 (January, May, November) and Meconta district, 2019 (June, March, October) and 2020 (January, February, May).
Description of the system
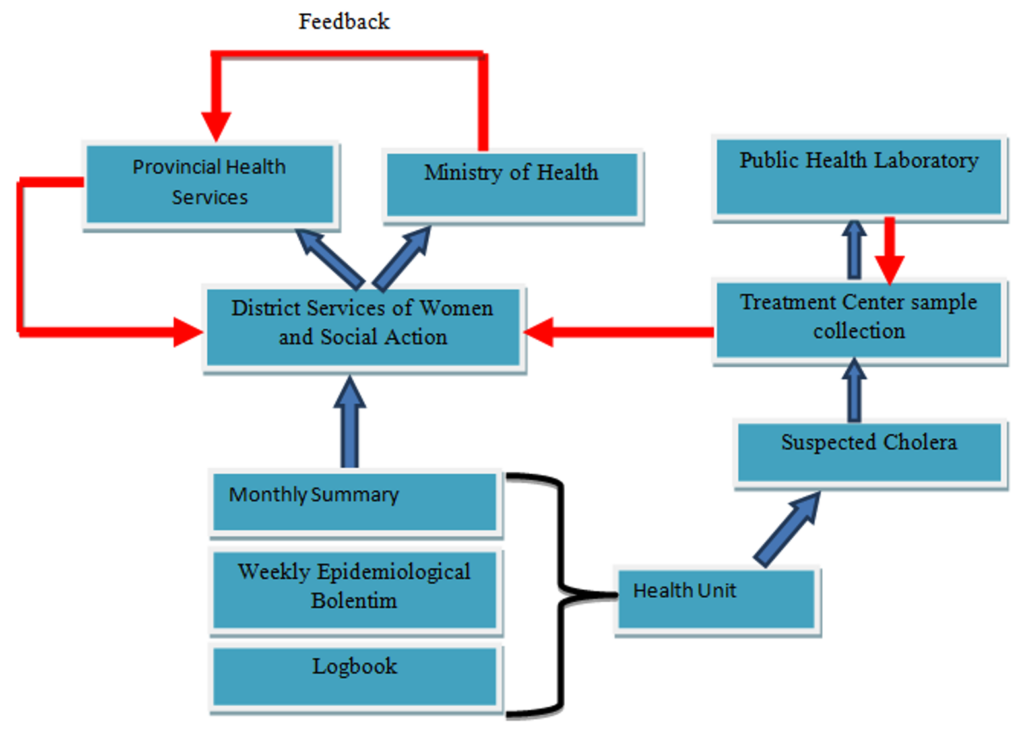
Informal conversations revealed that the surveillance of diarrheal diseases in Nampula Province begins at the health center, with the collection of data every Monday in the logbooks for the Weekly Epidemiological Bulletin, which is carried out by the technician responsible for surveillance at the health center. It then aggregates the information and sends it to the district level via an application (message, image or WhatsApp).
Every Tuesday the information is sent in physical format via the research sheets. In the district health services, the technician from the District Statistics Center enters the data into the Health Information System for Monitoring and Evaluation platform on a weekly basis. Once entered into the Health Information System for Monitoring and Evaluation platform, the data is automatically available at district, provincial and central levels. The central level sends feedback within 15 days to the province, which in turn sends the same information within the same timeframe to the districts. When cholera is suspected, patients are transferred to the Cholera Treatment Centers available in each district. Samples are taken from patients at these centres and sent to the Public Health Laboratory in Nampula City, through passive surveillance (Figure 1).
Evaluation of attributes
Simplicity
For a system to be simple, it is expected that the number of organizations involved does not exceed four and that the instruments used do not have more than 15 variables, among other parameters [7]. To this end, the number of existing variables, the way in which the information is transmitted, the levels at which the information is sent and the existence of other surveillance systems operated by the same technician were evaluated. The evaluation parameters are attached (Table 1). It was found that two data collection instruments are used in the surveillance of diarrheal diseases (the record book and the weekly epidemiological bulletin). The logbook has 12 variables, and the information is sent to four levels (health unit, district, provincial and central). The information is sent electronically and it was mentioned that the diarrhea surveillance technician is responsible for the surveillance of other systems. According to the parameters defined in this attribute, the system was considered simple.
Acceptability
To analyze the acceptability attribute the completion of the diarrhea/cholera investigation form was analyzed (Table 1), as it reflects the acceptance of professionals to participate in the system. However, this attribute was only assessed for the District of Nampula, as the other districts did not have diarrhea/cholera case investigation forms at the time of the assessment. The variables assessed were the date of onset of diarrhoea, frequency of diarrhoea and dehydration. The analysis showed that 89.4% of the variables were complete. In this sense, the system had good acceptability.
Data quality
Data quality reflects the completeness and validity of the data recorded in the public health surveillance system [7]. In terms of data quality, the variables on the diarrhoea/cholera case investigation form in the Nampula district were checked (age, district, city, neighborhood, date of onset of diarrhea, frequency of diarrhea and dehydration). In this attribute, the four variables included in acceptability and three others that contribute to taking action on sanitation and hygiene were analyzed, making a total of seven variables evaluated, Data deviation was also calculated using the data quality categories applied in the interpretation of deviation, which follow the data quality classification system used internationally and by the Ministry of Health’s Annual Joint Assessment, (Table 1). The completeness of the fields was 86.5% and the age variable was the most complete, with 100% completeness. Regarding agreement, it was found that in 2019 the discrepancy was 87% and for 2020 it was 22%, with the average discrepancy of the data being 54.5. The system was therefore considered to be of poor quality according to the defined parameter.
Representativeness
A representative public health surveillance system accurately describes the occurrence of a health event over time and its distribution in the population by place and person [7]. To assess representativeness, we analysed the distribution of diarrhoea cases by person (age, sex) and place (health unit where the cases originate) (Table 1). A total of 1,356 cases of diarrhoea were reported in the three districts, of which 49.7% (674/1,356) were male and 50.3% (682/1,356) female. Describing the cases by origin, the health unit 1st de May registered the highest number of cases with 29.5% (400/1,356), where of the total of 400 cases, the most predominant age group was 1 to 4 years old, of which 13.7% (55/400) were male. In this context, the system proved to be representative, as the system allows the mandatory epidemiological variables to be captured.
Timeliness
For this attribute, the time between taking the sample and receiving the results was checked using the database of diarrhoea cases that tested positive for cholera in the laboratory (Table 1). It was found that the Nampula district collected a total of 23 samples, and it was observed that the results were received in an average of 3 days, with a range of 2 to 5 days. In the District of Meconta, the average was also 3 days, with a total of 5 samples taken, and the district of Monapo did not take any samples. In the evaluation of the time between the date of onset of symptoms and the collection of samples in the diarrhea/cholera case investigation forms, of the three districts visited, only the forms in the District of Nampula were located, where it was found that, of the total of 54 cases investigated, 92.6% (50/54) did not have information on the date of sample collection, while 3 of the 4 cases that did have information collected the sample within1 day. According to the defined parameter, the system was considered timely.
Stability
Stability refers to the reliability (the ability to collect, manage, and provide data correctly without failure) and availability (the ability to be operational when needed) of the public health surveillance system [7] (Table 1). During the period under evaluation, in the three districts visited, it was found that data were recorded in the Health Information System for Monitoring and Evaluation platform every epidemiological week, which shows that there was no interruption to the system, so the system was considered stable.
Usefulness
The surveillance system for diarrheal diseases operates according to the standards recommended by the Ministry of Health. It provides information for understanding the magnitude of diarrheal diseases, in terms of clinical, epidemiological and laboratory results. However, it was observed that it is underutilised, as evidenced by the lack of information on the date of sample collection and laboratory results in diarrhea/cholera investigation forms. Even with underutilization, the system contributes to providing timely measures for the prevention and control of the disease and is considered useful because the system achieves the objectives for which it was created.
The flow of information within the diarrheal disease surveillance system in the province reflects the hierarchical structure of what is recommended by the Ministry of Health, since each level of the hierarchy has the information for decision-making, reducing morbidity and mortality from diarrheal diseases/cholera. The online system for data sharing facilitates the rapid dissemination of information, making the surveillance system simple. Although the system is simple, it should be noted that the presence of other surveillance systems operated by the same technician at the health center affects the system’s performance. The simplicity of the cholera surveillance system was also observed in Ghana [3].
The good acceptability of the surveillance system that we found can be explained by the good completeness of the fields found in this evaluation. Similar results were found by Amabo et al. (2016) in Cameroon [12]. The completeness of the fields was good. However, it was classified as poor-quality data because of the disagreement found in the logbooks and the Health Information System for Monitoring and Evaluation platform, which can hinder decision-making. Low quality was also found in the evaluation carried out in Nigeria [13].
Good data quality is crucial for decision-making, but poor data quality can lead to erroneous conclusions and decisions, which can have negative impacts [14,15]. Therefore, efforts must be made to improve data quality. Our findings indicate that the evaluated system is representative, as it accurately describes the occurrence of a health-related event over time and its distribution in the population by place and person, better characterizing the epidemiology of diarrheal disease [11]. The system showed good stability, which was observed when cases were reported every month during the period under analysis, and the data flowed without interruption. The opposite result was found in the evaluation carried out in Guinea Bissau [16].
Disposal of the investigation forms may be related to a lack of knowledge of the time recommended by the Ministry of Health for the conservation and disposal of instruments. On the other hand, it could probably be due to a lack of storage space for the instruments themselves. With regard to the timeliness attribute in this evaluation, the system proved to be timely; this was influenced by the availability of laboratory results within the period stipulated by the Ministry of Health. Similar findings were found in the study carried out by Leal (2014) in Brazil[17]. However, this contradicts the findings of the study carried out in Cameroon by Amabo et al. (2016) and Ngwa et al. (2016) [12,18].
Limitations
Lack of data in the Meconta and Monapo Districts was a limiting factor. The use of informal conversations instead of key informant interviews using a standard question guide was another limitation.
The surveillance system for diarrheal diseases is useful because it can be used to guide control and prevention measures and generate changes in surveillance practices. The surveillance system follows what is recommended by the National Health System. The online system, using messages, facilitates the rapid dissemination of information, making the surveillance system simple, acceptable, stable, timely, and representative, but with weaknesses in the data quality attribute. Heterogeneity was observed in the districts regarding the retention and disposal period of the investigation forms and logbooks. And incomplete completion of diarrhoea/cholera case investigation forms.
Recommendations
Promote continuous in-service training for surveillance technicians on the importance of surveillance of diarrheal diseases, investigation of cases, complete filling in of fields and collection of samples. For the districts of Monapo and Meconta, there is a need to preserve the instruments used in disease surveillance for a period of five years, in accordance with the standards recommended by the Ministry of Health.
What is already known about the topic
What this study adds
| Atribute | Verification criteria | Parameter | Result | Score / Rating |
|---|---|---|---|---|
| Simplicity | Number of variables in the system (log book) | ≤20 variables, simple = 1 ˃20 variables, complex = 0 | 12 = 1 Point | 0 to 5 points Rating: <3 Simple, >3 Complex |
| Number of instruments to fill in the system | 1 Instrument, simple = 1 >1 Instrument, complex = 0 | 2 = 0 Point | Achieved: 3/5 = Simple | |
| Information delivery levels | ≤3 Levels, simple = 1 >3 Levels, complex = 0 | 1 = 1 Point | ||
| Information sending mode | Online, simple = 1 Offline, complex = 0 | Online = 1 Point | ||
| Existence of other surveillance systems operated by the same technician | There are no other systems, simple = 1 There are other systems, complex = 0 | There are other surveillance systems operated by the same technician = 0 Point | ||
| Acceptability | Completeness of variables (Age, diarrhea onset date, diarrhea frequency, dehydration) | ≥75% good = 2 51–74% regular = 1 <50% low = 0 | 0 = 98.4% | 0–1 Points Classification: ≥1 Acceptable, 0 Not acceptable Achieved: 1 Point = Good acceptability |
| Data quality | Completeness of fields | ≥75% good = 2 51–74% regular = 1 <50% bad = 0 | 2 = 87.5% | 0–2 Points Rating: 2 = good quality <2 = bad quality |
| Completeness of data = (Number of unfilled forms / Total observed forms) × 100 | 51–74% regular = 1 <50% bad = 0 | |||
| Consistency between logbook data and SISMA Consistency = (Logbook recounted data – Reported Data) / (Logbook recounted data) × 100 | Deviation <10% = good = 2 10–20% = medium = 1 >20% = low = 0 | Deviation 2020 = 22% Deviation 2019 = 87% | Achieved: 1 Point = Bad quality Bad = 0 Points | |
| Representativeness | Distribution of diarrhea & cholera cases by person, time, place | Allows analysis = 1 Does not allow = 0 | Representative = 1 Point | 0–1 Points 1 = representative Achieved: 1 Point |
| Timeliness | Interval between onset of symptoms, sample collection, and receipt of results | ≤5 days timely = 1 >5 days not timely = 0 | 1 = 3-day average | 0–1 Points 1 = timely Achieved: 1 Point |
| Stability | Check HISME data by epidemiological week | Yes = 1 No = 0 | Yes = 1 Point | 0–1 Points 1 = stable Achieved: 1 Point |