Research | Open Access | Volume 8 (4): Article 98 | Published: 29 Nov 2025
Views: 2,241
Menu, Tables and Figures
| Variable | Kirfi N = 73 n (%) | Toro N = 56 n (%) | Bauchi N = 21 n (%) | Tafawa-Balewa n = 5 n (%) | Dass n = 3 n (%) | Darazo N = 1 n (%) | Ganjuwa N = 1 n (%) | Ningi N = 1 n (%) | Total N = 161 n (%) |
|---|---|---|---|---|---|---|---|---|---|
| Sex | |||||||||
| Male | 38 (52) | 31 (55) | 9 (43) | 2 (40) | 2 (67) | 1 (100) | 1 (100) | 0 (0) | 84 (52.0) |
| Female | 35 (48) | 25 (45) | 12 (57) | 3 (60) | 1 (33) | 0 (0) | 0 (0) | 1 (100) | 77 (48.0) |
| Age Group | |||||||||
| 0–4 | 3 (4.1) | 1 (1.8) | 1 (4.8) | 0 (0) | 0 (0) | 0 (0) | 0 (0) | 0 (0) | 5 (3.1) |
| 5–19 | 14 (19) | 17 (30) | 1 (4.8) | 3 (60) | 3 (100) | 1 (100) | 0 (0) | 0 (0) | 39 (24.0) |
| 20–59 | 51 (70) | 34 (61) | 18 (86) | 2 (40) | 0 (0) | 0 (0) | 1 (100) | 1 (100) | 107 (66.0) |
| 60+ | 5 (6.8) | 4 (7.1) | 1 (4.8) | 0 (0) | 0 (0) | 0 (0) | 0 (0) | 0 (0) | 10 (6.2) |
| Occupation | |||||||||
| Artisan | 1 (1.4) | 0 (0) | 2 (9.5) | 0 (0) | 0 (0) | 0 (0) | 0 (0) | 0 (0) | 3 (1.9) |
| Civil Servant | 1 (1.4) | 0 (0) | 1 (4.8) | 0 (0) | 0 (0) | 0 (0) | 0 (0) | 0 (0) | 2 (1.2) |
| Farmer | 19 (26) | 13 (23) | 1 (4.8) | 0 (0) | 0 (0) | 0 (0) | 1 (100) | 0 (0) | 34 (21) |
| Health Worker | 0 (0) | 0 (0) | 2 (9.5) | 0 (0) | 0 (0) | 0 (0) | 0 (0) | 0 (0) | 2 (1.2) |
| Other | 0 (0) | 1 (1.8) | 0 (0) | 0 (0) | 0 (0) | 0 (0) | 0 (0) | 0 (0) | 1 (0.6) |
| Student | 13 (18) | 16 (29) | 0 (0) | 1 (20) | 2 (67) | 0 (0) | 0 (0) | 0 (0) | 32 (20.0) |
| Trader | 6 (8.2) | 6 (11) | 4 (19) | 0 (0) | 0 (0) | 0 (0) | 0 (0) | 0 (0) | 16 (9.9) |
| Unemployed/Dependent | 33 (45) | 20 (36) | 10 (48) | 4 (80) | 1 (33) | 1 (100) | 0 (0) | 1 (100) | 70 (43) |
Table 1: Sociodemographic Characteristics of Confirmed Lassa Fever Cases by LGA (November 2024 – February 2025)
| LGA | Confirmed Cases n | Detection Timeliness ≤7 Days n (%) | Detection Delay >7 Days n (%) | Median Detection Delay [IQR] (days) | Case Fatality Rate (%) |
|---|---|---|---|---|---|
| Kirfi | 73 | 38 (52) | 35 (48) | 7.0 [6.0 – 9.0] | 4.1 |
| Toro | 56 | 21 (38) | 35 (62) | 8.0 [6.0 – 10.0] | 19.6 |
| Bauchi | 21 | 7 (33) | 14 (67) | 8.0 [7.0 – 10.0] | 38.1 |
| Tafawa-Balewa | 5 | 2 (40) | 3 (60) | 10.0 [7.0 – 10.0] | 40.0 |
| Dass | 3 | 1 (33) | 2 (67) | 13.0 [9.5 – 14.0] | 66.7 |
| Darazo | 1 | 1 (100) | 0 (0) | 4.0* | 0 |
| Ganjuwa | 1 | 0 (0) | 1 (100) | 8.0* | 0 |
| Ningi | 1 | 1 (100) | 0 (0) | 4.0* | 0 |
| Overall | 161 | 71 (44) | 90 (56) | 8.0 [6.0 – 10.0] | 16.2 |
* Only one case reported in the LGA; median and IQR not applicable. Exact value shown.
Table 2: Timeliness and Delay in Detection of Confirmed Lassa Fever Cases by LGA, Bauchi State (November 2024 – February 2025)


Taofik Ademola Oloyede1,&, Nasir Ahmed Omar2, Elizabeth Bunmi Adedire3, Moses Job Tarfa1, Musonda Chikwanda4, Bilal Abdullahi Muhammad2, Bashir Ahmed2
1Nigerian Field Epidemiology and Laboratory Training Program (NFELTP), Asokoro, Abuja, Nigeria, 2Nigeria Centre for Disease Control and Prevention (NCDC), Abuja, Nigeria, 3African Field Epidemiology Network (AFENET), Abuja, Nigeria, 4Africa Centres for Disease Control and Prevention (Africa CDC), Abuja, Nigeria
&Corresponding author: Taofik Ademola Oloyede, Nigerian Field Epidemiology and Laboratory Training Program (NFELTP), Asokoro, Abuja, Nigeria, Email: tawfeeq313@gmail.com ORCID: https://orcid.org/0009-0004-0607-3216
Received: 04 Aug 2025, Accepted: 28 Nov 2025, Published: 29 Nov 2025
Domain: Field Epidemiology, Outbreak Investigation
Keywords: Lassa fever, Detection timeliness, Case fatality rate, 7-1-7 framework, Nigeria
©Taofik Ademola Oloyede et al. Journal of Interventional Epidemiology and Public Health (ISSN: 2664-2824). This is an Open Access article distributed under the terms of the Creative Commons Attribution International 4.0 License (https://creativecommons.org/licenses/by/4.0/), which permits unrestricted use, distribution, and reproduction in any medium, provided the original work is properly cited.
Cite this article: Taofik Ademola Oloyede et al., Detection timeliness and case fatality patterns of Lassa fever in Bauchi State, Nigeria: A descriptive epidemiological analysis, November 2024–February 2025. Journal of Interventional Epidemiology and Public Health. 2025;8(4):98. https://doi.org/10.37432/jieph-d-25-00171
Introduction: Early detection of Lassa fever is critical for improving treatment outcomes, yet diagnostic and surveillance delays remain a challenge in endemic settings. In 2024, the Nigeria Centre for Disease Control and Prevention (NCDC) reported 1,309 confirmed cases with a case fatality of 16.3%. This study assessed the timeliness of detection and case fatality patterns during a Lassa fever outbreak in Bauchi State, Nigeria, from November 2024 to February 2025.
Methods: A descriptive epidemiological analysis was conducted on confirmed Lassa fever cases identified in Bauchi State between November 2024 and February 2025. Data collection utilized a mixed approach, combining retrospective analysis of surveillance line lists with prospective data gathered through enhanced active case finding and field investigations. We described the demographic distribution, time interval from symptom onset to laboratory confirmation, and patient outcomes. Detection timeliness was assessed using the first benchmark of the 7-1-7 (case detection within 7 days of symptom onset). Data were analysed using R software version 4.4.2, and spatial mapping and an epidemic curve were generated.
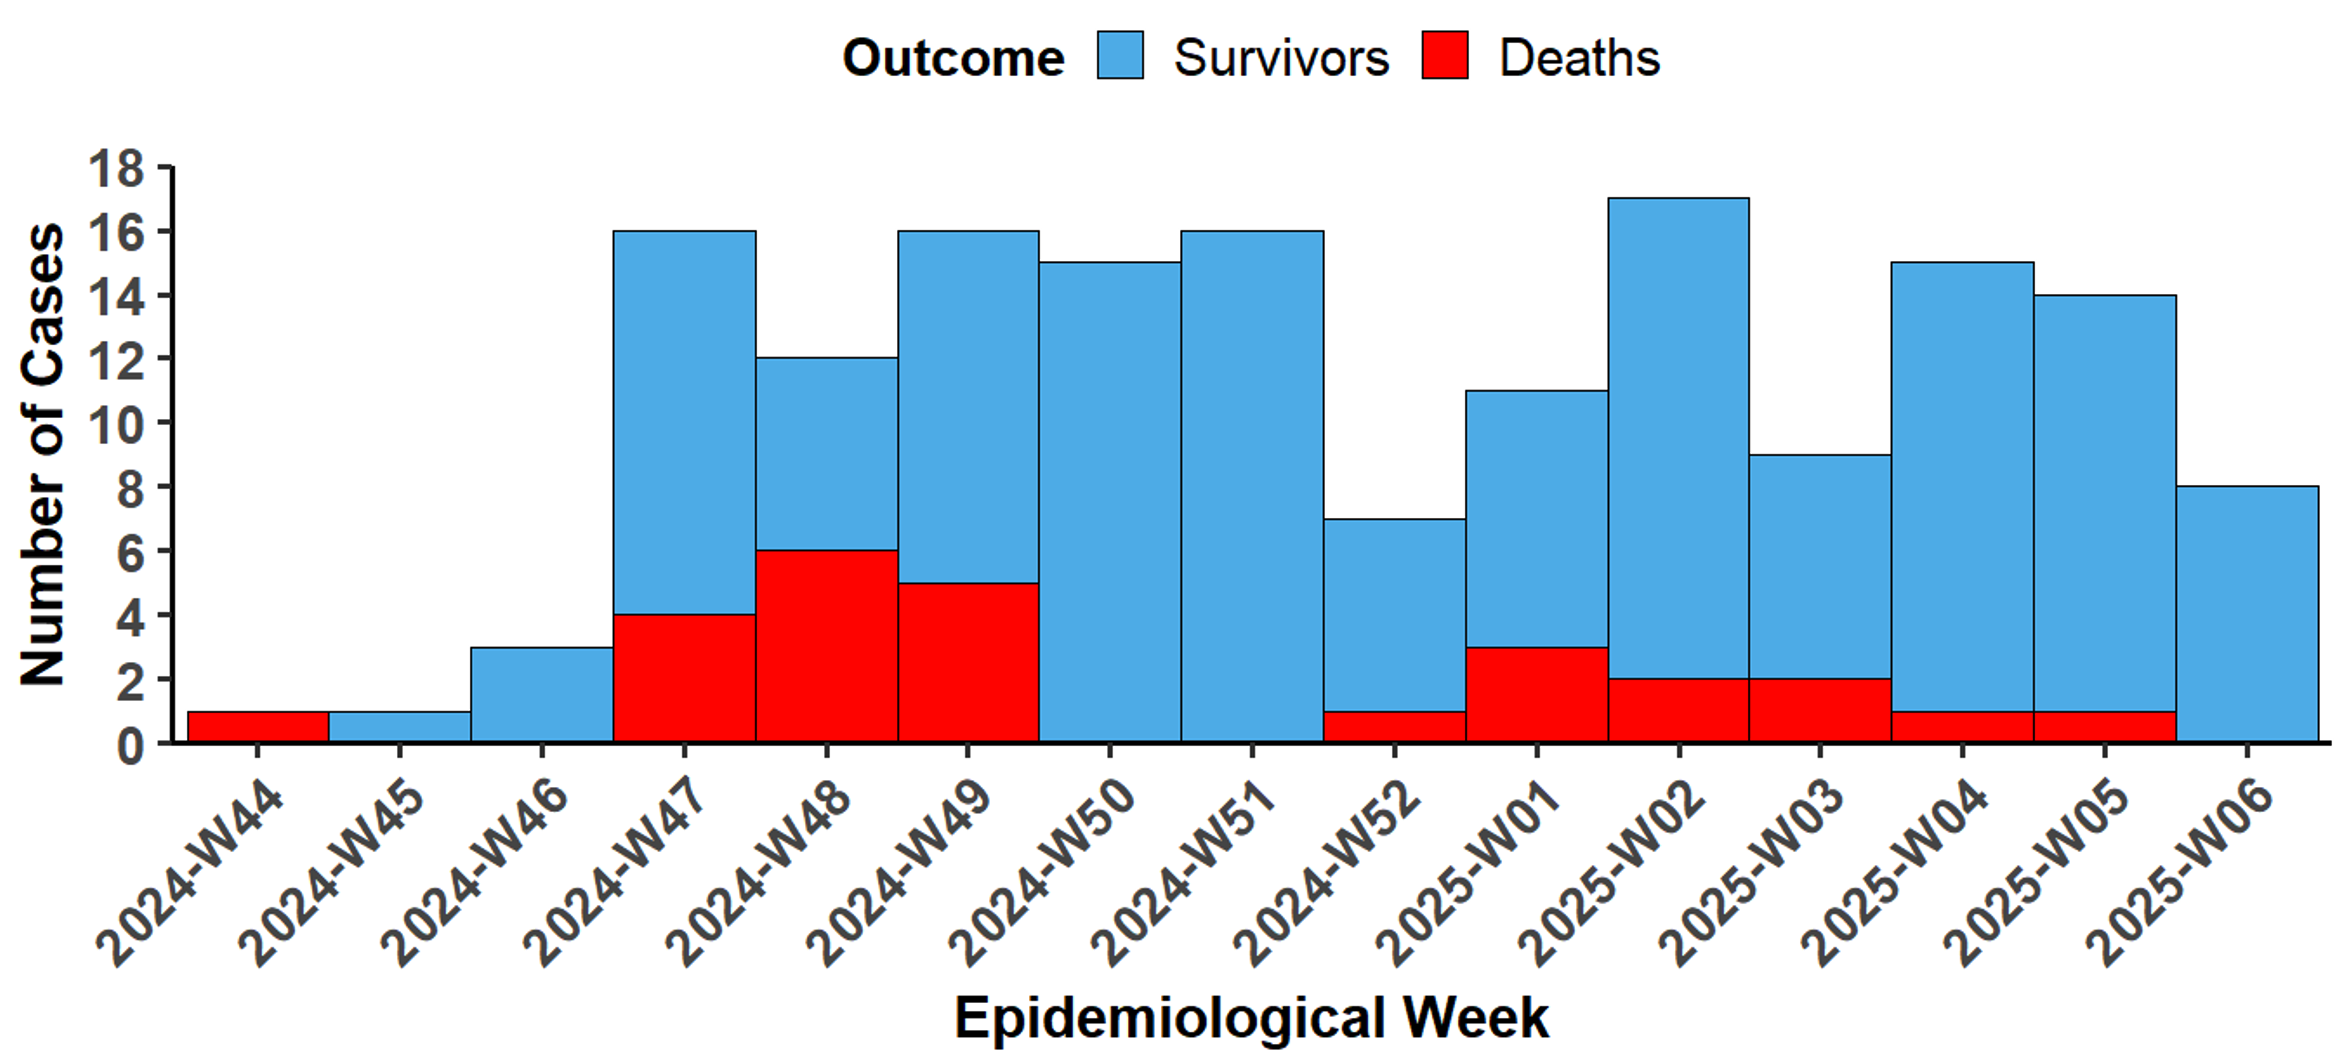
Results: A total of 161 confirmed cases were identified, with an overall case fatality rate (CFR) of 26 (16.2%). Of these, 71 (44%) were detected within 7 days of symptom onset. Median detection delay was 8 days [IQR: 6–10]. The epidemic curve shows an initial rise in confirmed Lassa fever cases beginning in epidemiological week 46 of 2024, with a sustained increase peaking in week 2 of 2025, followed by a gradual decline through week 6 of 2025. Most cases 107 (66%) occurred among individuals aged 20–59 years. The sex distribution was nearly equal, with a male-to-female ratio of 1.1:1. CFRs varied markedly by local government area (LGA), ranging from 4.1% to 66.7%, with a simple linear regression showing a statistically significant relationship between median detection delay and CFR across LGAs (β = 7.34, p = 0.0047, R² = 0.762).
Conclusion: Delays in detection has contributed to variations in Lassa fever mortality across Bauchi State. Strengthening early diagnostic capacity, routine monitoring of detection benchmarks, and reinforcing outbreak readiness at all levels of the health system are essential to improve outcomes in future epidemics.
Lassa fever is an acute viral haemorrhagic illness endemic in West and Central Africa, with Nigeria, Sierra Leone, Guinea, and Liberia reporting the highest disease burden [1]. The estimated annual incidence ranges from 100,000 to 300,000 cases. Crucially, while the majority of Lassa virus infections are mild or asymptomatic, the disease is severe in about 20% of symptomatic patients [2]. Case fatality rates (CFRs), range from 20% to 30%, and up to 60% among hospitalized patients [3]. In Nigeria, which has the highest burden of the disease, confirmed cases are low considering estimates. Between 2020 and 2024, the highest number of confirmed cases was 1,370 in 2024, with a case fatality of 16.3% [4]. Annually, cases fluctuated from 1,089 in 2020 to 511 in 2021, then increased through 2022 (1,067), 2023 (1,270), and 2024 (1,370) [4]. These trends highlight persistent challenges in surveillance and reporting, which may partly explain the gap between predicted and confirmed case numbers.
Timely detection and management of Lassa fever is challenged by its nonspecific early symptoms, which often mimic other febrile illnesses and contribute to delayed diagnosis and treatment [5]. Such delays, especially beyond seven days from symptom onset, are strongly associated with increased mortality [6]. Additionally, seasonal peaks, typically from January to March, coincide with heightened rodent-human interaction and overstretched public health systems [3].
In Nigeria, despite growing surveillance efforts, underreporting remains widespread due to diagnostic limitations, inconsistent case detection, and weak integration of prevention and response mechanisms [2, 7]. Past outbreaks have revealed systemic bottlenecks in laboratory confirmation, delayed notifications, and resource constraints that hinder rapid public health action [8].
Bauchi State is consistently listed among the Lassa fever–affected states in Nigeria, alongside higher-burden states such as Edo, Ondo, and Ebonyi [9]. However, while national analyses have documented trends at the aggregate level, these studies provide limited insight into subnational outbreak dynamics in Bauchi [9]. Unlike the deep, established surveillance systems in core endemic states like Edo and Ondo, Bauchi’s response challenges, particularly at the Local Government Area (LGA) level, remain under-documented. To date, no published study has systematically examined detection timelines, case fatality patterns, or diagnostic delays specific to this region.
This study presents a mixed retrospective and prospective cross-sectional analysis of all confirmed Lassa fever cases identified during the Bauchi State outbreak, from November 2024 to February 2025, a period of heightened transmission. We focus specifically on patterns of detection timeliness and case fatality rates across affected LGAs, aiming to identify critical delays and gaps in the surveillance-to-response pathway.
Study setting and period
This study was conducted in Bauchi State, north-eastern Nigeria, during a confirmed Lassa fever outbreak from November 2, 2024, to February 6, 2025. The outbreak was first identified in Toro LGA, with additional confirmed cases subsequently reported in Kirfi, Bauchi, Tafawa Balewa, Dass, Darazo, Ganjuwa, and Ningi LGAs. Bauchi State, with an estimated population of over 6 million, is served by a network of primary and secondary health facilities, including the Abubakar Tafawa Balewa University Teaching Hospital (ATBUTH), which served as a referral centre during the outbreak. The Nigeria Centre for Disease Control (NCDC) deployed a National Rapid Response Team (NRRT) from January 23, 2025 to February 6, 2025, in collaboration with the Bauchi State Ministry of Health, World Health Organization (WHO), and Médecins Sans Frontières (MSF).
Study design and population
We conducted a descriptive epidemiological analysis that combined retrospective analysis of confirmed Lassa fever cases from surveillance records with prospective active case finding within the communities during the study period. The study population included all laboratory-confirmed Lassa fever cases reported in Bauchi State between November 2, 2024, and February 6, 2025. The study population included all 161 laboratory-confirmed Lassa fever cases identified in Bauchi State between November 2024 and February 6, 2025. This dataset comprised 118 cases (73%) identified retrospectively from surveillance line lists spanning November 2024 through January 22, 2025, and 43 cases (26%) identified prospectively through active case finding and field investigations by the NRRT from January 23 to February 6, 2025.
Data collection
Data collection followed NCDC’s standardized outbreak response protocols and involved both NRRT and state-level public health teams:
Record review: A retrospective review was conducted using harmonized line lists derived from clinical care records, laboratory reporting systems, and the Surveillance Outbreak Response Management and Analysis System (SORMAS).
Active case finding: Field investigations were conducted in affected LGAs through interviews with health workers and community members, observation of infection prevention and control (IPC) practices, and assessments of health care facilities. This activity resulted in the confirmation and inclusion of 43 cases in the final analytical dataset.
Coordination meetings: Information was consolidated from daily NRRT briefings, Public Health Emergency Operations Centre (PHEOC) meetings, and coordination visits with local authorities
Detection milestones: For each confirmed case, the date of symptom onset and the date of laboratory confirmation were extracted to calculate diagnostic timeliness.
Case definitions
Standard NCDC Lassa fever case definitions were applied:
Data analysis
All quantitative analyses were conducted using R version 4.4.2. The following analytical approaches were applied:
Descriptive statistics: Sociodemographic and clinical characteristics were summarized using frequencies, proportions, and medians (with interquartile ranges).
Case fatality rate (CFR): Calculated as the proportion of confirmed cases who died, stratified by LGA.
Detection timeliness analysis: Time from symptom onset to laboratory confirmation was computed to assess timeliness. The time interval was calculated inclusively, with the date of symptom onset counting as day 1, consistent with the 7-1-7 framework – a global public health standard that calls for detecting an outbreak within 7 days, initiating investigation within 1 day, and completing an effective response within the following 7 days. Detection was categorized as timely (≤7 days) or delayed (>7 days).
Spatial Mapping: Geographic Information System (GIS) tools were used to visualize Lassa fever case distribution across LGAs.
Epidemic Curve Construction: A temporal curve of symptom onset dates for confirmed cases was generated to visualize outbreak progression.
Ethical Considerations
This study utilized a mixed dataset comprising routine surveillance records and data collected through enhanced, field-based active case finding. All data used in the final analysis were strictly de-identified (anonymized) at the individual case level, consistent with the use of a confidential case line list. This investigation was conducted as a component of the official public health emergency response to the Lassa fever outbreak in Bauchi State, led by the Nigeria Centre for Disease Control and Prevention (NCDC) and carried out by the deployed NRRT. Administrative clearance for the conduct of the investigation and the use of the final, aggregated surveillance data was obtained from the Bauchi State Ministry of Health. As the work fell under the scope of routine public health surveillance and emergency response, it was conducted under national protocols and therefore did not require separate institutional review board (IRB) approval.
A total of 161 laboratory-confirmed Lassa fever cases were included in the final analysis. This dataset comprised 118 cases (73%) identified retrospectively from surveillance records and 43 cases (27%) identified prospectively through active case finding and field investigations by the NRRT.
Sociodemographic analysis of the 161 confirmed cases is presented in Table 1. One hundred and seven cases (66%) occurred among individuals aged 20–59 years, with a near-equal male-to-female distribution [84 (52%) male, 77 (48%) female]. Unemployed or dependent individuals were 70 (43%), followed by farmers 34 (21%) and students 32 (20%).
The temporal progression of the outbreak is shown in Figure 1. The epidemic curve indicates that confirmed Lassa fever cases began rising in epidemiological week 46 of 2024, peaked in week 2 of 2025, and gradually declined through week 6.
Among the 161 confirmed cases analysed, 71 (44%) were detected within seven days of symptom onset, while 90 (56%) experienced delayed detection. The overall median detection delay was 8 days (IQR: 6–10). Kirfi, the LGA with the highest number of cases, recorded the highest percentage of cases detected within 7 days with 38 (52%) cases, while LGAs Bauchi, Dass and Ganjuwa reported lowest timeliness with 7 (33%), 1 (33%) and 0 (0%) respectively. (Table 2)
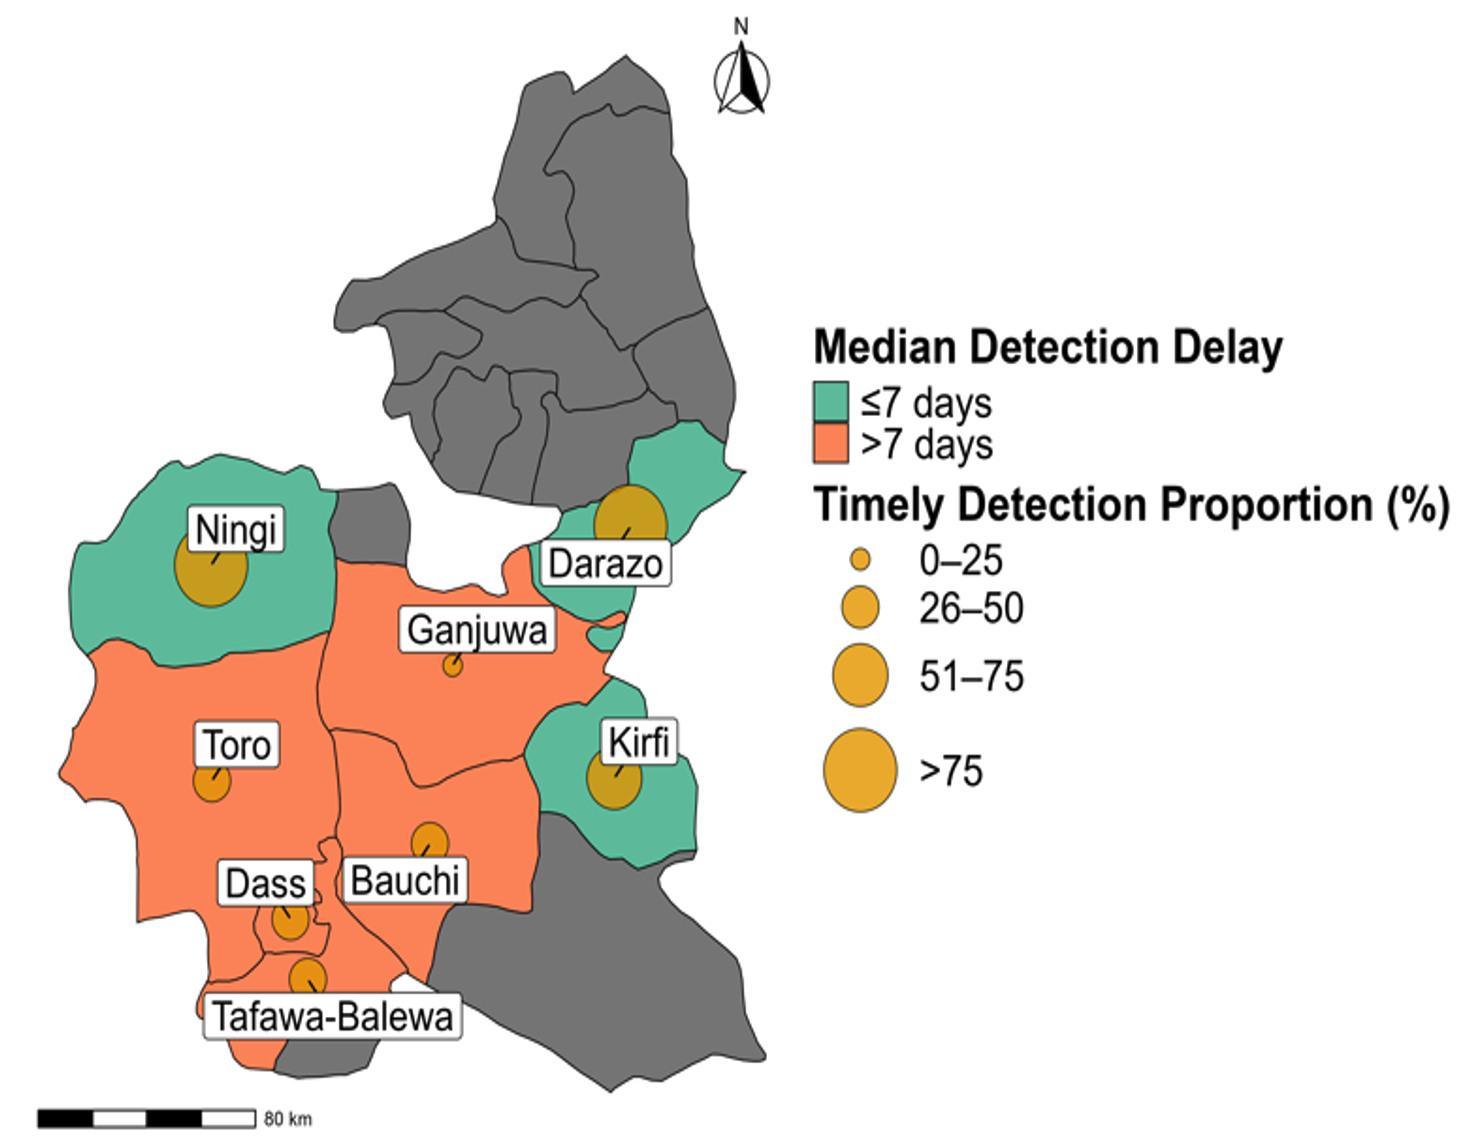
Spatial differences in timeliness of detection are summarized in Figure 2. Only 71 (44%) of confirmed cases across the state were identified within 7 days of symptom onset. Median detection delays varied by LGA, ranging from 4 to 13 days. LGAs such as Kirfi and Ningi had shorter median detection delays (4 and 7 days respectively) while Bauchi and Dass had longer detection delays (8 and 13 days respectively).
A simple linear regression showed a statistically significant association between detection delay and CFR across LGAs (β = 7.34, p = 0.0047, R² = 0.762).
This investigation provides one of the first LGA-level analyses of Lassa fever detection timeliness and fatality patterns in Bauchi State, Nigeria. Our findings indicate a significant gap in timely case recognition during the outbreak: the majority of confirmed cases were detected with substantial delay, and this delay was found to be highly predictive of patient outcome. Although the overall CFR of 16.2% is lower than national historical estimates of 20–30% [1], the analysis revealed marked disparities across LGAs, underscoring persistent subnational inequities in outbreak response capacity.
The substantial variation in detection performance and CFR across Bauchi’s LGAs (4.1% to 66.7%) presents a more heterogeneous pattern than typically reported in core endemic states, where surveillance infrastructure is often more centralized and established. This heterogeneity is directly explained by our quantitative analysis, which revealed a strong linear relationship between detection timeliness and CFR. Specifically, the regression model demonstrated that for each additional day of delay in case detection, the LGA-specific CFR increased by 7.34% on average, with case detection delay accounting for 76.2% of the variation in CFR across the affected LGAs. However, it is critical to interpret this finding with caution, as this is an ecological association across aggregated LGA data and does not represent the direct risk or outcome at the individual patient level. This finding confirms that detection delay is a primary driver of case fatality in this setting, echoing findings from a previous study in the state [6].
Differences in case fatality across LGAs were consistent with variations in detection timeliness and facility readiness observed during field assessments. LGAs with earlier recognition and stronger coordination of referrals, such as Kirfi, recorded lower mortality, whereas those with delayed confirmation, including Dass and Tafawa Balewa, experienced poorer outcomes. These findings suggest that local surveillance performance and access to diagnostic services played a central role in determining case outcomes, consistent with observations that weak community surveillance and delayed case recognition have contributed to higher mortality in endemic regions of Nigeria [5]. Distribution by LGA also revealed variations in both age and occupation, reflecting differences in exposure risk and health care access. Furthermore, these assessments revealed varying levels of preparedness across health facilities. Active case searches confirmed clustering of cases in specific wards, and several facilities lacked sufficient IPC resources, such as personal protective equipment (PPE) and isolation areas. Case burden appeared highest in Kirfi, which also demonstrated earlier case recognition compared to other LGAs. These operational deficiencies directly translate to delayed patient identification and slower referral.
Using the “7” benchmark from the WHO-supported 7-1-7 framework, this study focused on the interval between symptom onset and laboratory confirmation as a proxy for detection capacity. The proportion of cases identified within this window (44%) falls substantially short of global detection standards. Furthermore, it is considerably lower than the reported national public health event detection rate of 76% (meeting the 7-day target) documented through the NCDC SITAware system in 2023–2024. [10]. This disparity highlights that Lassa fever detection presents a specific, persistent challenge in non-core endemic states like Bauchi, echoing findings where bottlenecks occur at the frontline level [8]. Detection timeliness varied substantially by LGA and coincided with higher case fatality rates, supporting a linear relationship between detection timeliness and survival.
Delayed care-seeking behaviour, low community risk perception, and limited diagnostic capacity at peripheral health facilities may have further contributed to slow detection [7]. Such delays are critical not only for clinical outcomes but also for limiting transmission, especially in settings with fragile IPC systems. The observed detection delays underscore the need for focused local interventions. Regular in-service training for frontline health workers can improve clinical suspicion and reduce diagnostic lag. In addition, achieving the seven-day benchmark will require expanding rapid diagnostic capacity to general hospitals and primary care levels rather than concentrating it in tertiary centres. Strengthened community engagement and culturally appropriate risk communication are equally essential to reduce delayed care-seeking, a key driver of prolonged onset-to-detection intervals observed in this investigation.
Limitations of this investigation include incomplete line-listing for some cases, potential underreporting of mild infections, absence of molecular typing, potential reporting bias, incomplete clinical data and spatial analysis constrained to the LGA level. These factors may have influenced CFR calculations and limited finer-grained interpretation of detection performance. Despite these constraints, the patterns observed are consistent with known surveillance gaps in similar settings and offer useful insights for public health planning.
The investigation of Lassa fever outbreak in Bauchi State revealed substantial delays in case detection, with less than half of confirmed cases identified within the critical 7-day window. These delays had a positive relationship with elevated case fatality rates. To reduce fatality and enhance outbreak responsiveness, it is essential to improve early detection of cases through strengthening subnational surveillance systems and institutionalising routine monitoring of detection indicators at the local level.
What is already known about the topic
What this study adds
TAO, NAO designed the outbreak investigation protocol, collected and analysed surveillance data. TAO drafted the manuscript. The other authors contributed to data interpretation and critical manuscript revisions. All the authors read and approved the final version of the manuscript for submission.
| Variable | Kirfi N = 73 n (%) | Toro N = 56 n (%) | Bauchi N = 21 n (%) | Tafawa-Balewa n = 5 n (%) | Dass n = 3 n (%) | Darazo N = 1 n (%) | Ganjuwa N = 1 n (%) | Ningi N = 1 n (%) | Total N = 161 n (%) |
|---|---|---|---|---|---|---|---|---|---|
| Sex | |||||||||
| Male | 38 (52) | 31 (55) | 9 (43) | 2 (40) | 2 (67) | 1 (100) | 1 (100) | 0 (0) | 84 (52.0) |
| Female | 35 (48) | 25 (45) | 12 (57) | 3 (60) | 1 (33) | 0 (0) | 0 (0) | 1 (100) | 77 (48.0) |
| Age Group | |||||||||
| 0–4 | 3 (4.1) | 1 (1.8) | 1 (4.8) | 0 (0) | 0 (0) | 0 (0) | 0 (0) | 0 (0) | 5 (3.1) |
| 5–19 | 14 (19) | 17 (30) | 1 (4.8) | 3 (60) | 3 (100) | 1 (100) | 0 (0) | 0 (0) | 39 (24.0) |
| 20–59 | 51 (70) | 34 (61) | 18 (86) | 2 (40) | 0 (0) | 0 (0) | 1 (100) | 1 (100) | 107 (66.0) |
| 60+ | 5 (6.8) | 4 (7.1) | 1 (4.8) | 0 (0) | 0 (0) | 0 (0) | 0 (0) | 0 (0) | 10 (6.2) |
| Occupation | |||||||||
| Artisan | 1 (1.4) | 0 (0) | 2 (9.5) | 0 (0) | 0 (0) | 0 (0) | 0 (0) | 0 (0) | 3 (1.9) |
| Civil Servant | 1 (1.4) | 0 (0) | 1 (4.8) | 0 (0) | 0 (0) | 0 (0) | 0 (0) | 0 (0) | 2 (1.2) |
| Farmer | 19 (26) | 13 (23) | 1 (4.8) | 0 (0) | 0 (0) | 0 (0) | 1 (100) | 0 (0) | 34 (21) |
| Health Worker | 0 (0) | 0 (0) | 2 (9.5) | 0 (0) | 0 (0) | 0 (0) | 0 (0) | 0 (0) | 2 (1.2) |
| Other | 0 (0) | 1 (1.8) | 0 (0) | 0 (0) | 0 (0) | 0 (0) | 0 (0) | 0 (0) | 1 (0.6) |
| Student | 13 (18) | 16 (29) | 0 (0) | 1 (20) | 2 (67) | 0 (0) | 0 (0) | 0 (0) | 32 (20.0) |
| Trader | 6 (8.2) | 6 (11) | 4 (19) | 0 (0) | 0 (0) | 0 (0) | 0 (0) | 0 (0) | 16 (9.9) |
| Unemployed/Dependent | 33 (45) | 20 (36) | 10 (48) | 4 (80) | 1 (33) | 1 (100) | 0 (0) | 1 (100) | 70 (43) |
| LGA | Confirmed Cases n | Detection Timeliness ≤7 Days n (%) | Detection Delay >7 Days n (%) | Median Detection Delay [IQR] (days) | Case Fatality Rate (%) |
|---|---|---|---|---|---|
| Kirfi | 73 | 38 (52) | 35 (48) | 7.0 [6.0 – 9.0] | 4.1 |
| Toro | 56 | 21 (38) | 35 (62) | 8.0 [6.0 – 10.0] | 19.6 |
| Bauchi | 21 | 7 (33) | 14 (67) | 8.0 [7.0 – 10.0] | 38.1 |
| Tafawa-Balewa | 5 | 2 (40) | 3 (60) | 10.0 [7.0 – 10.0] | 40.0 |
| Dass | 3 | 1 (33) | 2 (67) | 13.0 [9.5 – 14.0] | 66.7 |
| Darazo | 1 | 1 (100) | 0 (0) | 4.0* | 0 |
| Ganjuwa | 1 | 0 (0) | 1 (100) | 8.0* | 0 |
| Ningi | 1 | 1 (100) | 0 (0) | 4.0* | 0 |
| Overall | 161 | 71 (44) | 90 (56) | 8.0 [6.0 – 10.0] | 16.2 |