Research | Open Access | Volume 9 (1): Article 34 | Published: 25 Feb 2026

Views: 1,667
Menu, Tables and Figures
| Determinants | Question | Option | Score | Observation (Tick what you see) |
|---|---|---|---|---|
| PPE | What type of PPE do you wear while spraying? | PPE-0 (Never wears PPE) | 1.0 | |
| PPE-1 (Face shield/goggles, fabric/leather gloves, apron, overall, long sleeves & trousers, dust mask) | 0.8 | Yes / No | ||
| PPE-2 (Rubber boots, gas mask, disposable outer clothing – Tyvek) | 0.7 | Yes / No | ||
| PPE-3 (Chemically resistant rubber gloves) | 0.6 | Yes / No | ||
| PPE-1 and PPE-2 | 0.5 | Yes / No | ||
| PPE-1 and PPE-3 | 0.4 | Yes / No | ||
| PPE-2 and PPE-3 | 0.3 | Yes / No | ||
| PPE-1, PPE-2 and PPE-3 | 0.1 | Yes / No | ||
| MIX | Do you mix pesticides? | Yes | 9.0 | Scores adopted from (37) |
| No | 0.0 | |||
| APPLICATION | What do you use for applying pesticides? | Backpack sprayer | 8.0 | Yes / No |
| Hand sprayer | 9.0 | Yes / No | ||
| Brooms | 9.0 | Yes / No | ||
| CHANGE | How long does it take between the end of application and changing your clothes? | Immediately | 0.7 | N/A |
| Few hours later (≤ 3 hours) | 0.8 | |||
| Many hours later (> 4 hours) | 0.9 | |||
| Next day | 1.0 | |||
| SHOWER | How long does it take between the end of application and showering? | Immediately | 0.7 | N/A |
| Few hours later (≤ 3 hours) | 0.8 | |||
| Many hours later (> 4 hours) | 0.9 | |||
| Next day | 1.0 | |||
| Duration of spraying (hours) | How many times have you sprayed in the last month? | Number of times sprayed in the last month × time spent while spraying in that month | ||
| For how long do you spray every time you spray? | ||||
| *N/A: Not applicable | ||||
| Variable | Frequency (n = 576) | Percentage (%) |
|---|---|---|
| Sex | ||
| Male | 403 | 70.0 |
| Female | 173 | 30.0 |
| Age (Mean ± SD) | 41.8 (±14.1) | |
| Age groups | ||
| 17–35 | 224 | 38.9 |
| 36–49 | 191 | 33.2 |
| 50 and above | 161 | 28.0 |
| Marital status | ||
| Single | 47 | 8.2 |
| Married | 469 | 81.4 |
| Separated / Divorced / Widowed | 60 | 10.4 |
| Level of education | ||
| None | 53 | 9.2 |
| Primary | 335 | 58.2 |
| Secondary / tertiary | 188 | 32.6 |
| Number of household members | ||
| 1–5 | 260 | 45.1 |
| 6–10 | 258 | 44.8 |
| ≥11 | 58 | 10.1 |
| Use pesticides | ||
| Yes | 409 | 71.0 |
| No | 167 | 29.0 |
| Years of applying pesticides | ||
| < 1 | 76 | 18.6 |
| 1–4 | 195 | 47.7 |
| 5–9 | 86 | 21.0 |
| ≥10 | 52 | 12.7 |
| DERM score | ||
| ≤22.5 | 233 | 57.0 |
| >22.5 | 176 | 43.0 |
| Use pesticide mixtures | ||
| Yes | 215 | 52.6 |
| No | 194 | 47.4 |
| Storage practices | ||
| Bedroom | 87 | 21.3 |
| House ceiling / roof | 77 | 18.8 |
| Lockable store | 118 | 28.9 |
| Kitchen | 45 | 11.0 |
| Living room | 47 | 11.5 |
| Others | 35 | 8.6 |
| Clean PPE application containers after spraying | ||
| Yes | 367 | 89.7 |
| No | 42 | 10.3 |
| Time taken to re-enter field after spraying | ||
| ≤ 12 hours | 107 | 26.2 |
| > 12 hours | 302 | 73.8 |
| Use crop pesticides for domestic purposes | ||
| Spraying pests in the house | 170 | 85.0 |
| Preserve seeds | 37 | 18.6 |
| Treat skin infections | 13 | 6.5 |
| Use on livestock to kill pests | 44 | 22.1 |
| Others | 3 | 1.5 |
| Variable | Exposure to pesticides | Unadjusted PR (95% CI) | Adjusted PR (95% CI) | |
|---|---|---|---|---|
| High n (%) | Low n (%) | |||
| Sex | ||||
| Male | 153 (49.8) | 154 (50.2) | Ref | Ref |
| Female | 23 (22.6) | 79 (77.5) | 0.45 (0.31–0.66) *** | 0.45 (0.31–0.67) *** |
| Age group | ||||
| 17–35 | 61 (40.4) | 90 (59.6) | Ref | |
| 36–49 | 68 (44.2) | 86 (55.8) | 1.09 (0.84–1.42) | – |
| ≥50 | 47 (45.2) | 57 (54.8) | 1.12 (0.84–1.49) | – |
| Level of education | ||||
| None | 19 (50.0) | 19 (50.0) | Ref | Ref |
| Primary | 101 (43.4) | 132 (56.7) | 0.87 (0.61–1.23) | 0.93 (0.66–1.32) |
| Secondary / Tertiary | 56 (40.6) | 82 (59.4) | 0.81 (0.56–1.18) | 0.86 (0.60–1.25) |
| Marital status | ||||
| Single | 16 (48.5) | 17 (51.5) | Ref | Ref |
| Married / Cohabiting | 152 (43.3) | 199 (56.7) | 0.89 (0.62–1.30) | 0.82 (0.57–1.20) |
| Separated / Divorced / Widowed | 8 (32.0) | 17 (68.0) | 0.66 (0.34–1.29) | 0.76 (0.40–1.47) |
| Number of family members | ||||
| 1–5 | 64 (39.0) | 100 (61.0) | Ref | |
| 6–10 | 90 (46.4) | 104 (53.6) | 1.19 (0.93–1.52) | – |
| ≥11 | 22 (43.1) | 29 (56.9) | 1.11 (0.76–1.60) | – |
| Variable | Exposure to pesticides | Unadjusted PR (95% CI) | Adjusted PR (95% CI) | |
|---|---|---|---|---|
| High n (%) | Low n (%) | |||
| Use brooms to apply pesticides | ||||
| No | 168 (47.3) | 187 (52.7) | Ref | Ref |
| Yes | 8 (15.1) | 45 (84.9) | 0.32 (0.17–0.61) ** | 0.50 (0.22–1.12) |
| Use a sharp object to unblock a backpack sprayer nozzle | ||||
| No | 46 (59.7) | 31 (40.3) | Ref | |
| Yes | 127 (41.4) | 180 (58.6) | 0.69 (0.55–0.87) ** | – |
| Use pesticide mixtures | ||||
| No | 90 (41.9) | 34 (42.5) | Ref | Ref |
| Yes | 86 (44.3) | 143 (61.9) | 1.06 (0.85–1.32) | 1.47 (1.03–2.10) * |
| Wear rubber boots for protection | ||||
| No | 46 (57.5) | 34 (42.5) | Ref | Ref |
| Yes | 88 (38.1) | 143 (61.9) | 0.66 (0.52–0.85) ** | 0.49 (0.34–0.71) *** |
| Storage of pesticides | ||||
| Bedroom | 44 (50.6) | 43 (49.4) | Ref | |
| House ceiling/roof | 22 (28.6) | 55 (71.4) | 0.57 (0.38–0.85) ** | – |
| Lockable store | 56 (47.9) | 61 (52.1) | 0.95 (0.71–1.25) | – |
| Kitchen | 13 (28.9) | 32 (71.1) | 0.57 (0.35–0.95) * | – |
| Living room | 24 (51.1) | 23 (49.0) | 1.01 (0.71–1.43) | – |
| Others | 17 (48.6) | 18 (51.4) | 0.92 (0.64–1.43) | – |
| Use crop pesticides to control pests on domestic animals | ||||
| No | 68 (43.9) | 11 (36.7) | Ref | Ref |
| Yes | 8 (18.2) | 112 (65.9) | 0.41 (0.22–0.80) ** | 0.45 (0.22–0.91) * |
| Use crop pesticides to spray pests in the farmers residence | ||||
| No | 19 (63.3) | 11 (36.7) | Ref | Ref |
| Yes | 58 (34.1) | 112 (65.9) | 0.52 (0.38–0.76) *** | 0.43 (0.29–0.64) *** |
| Clean pesticide application equipment | ||||
| Wash / wipe | 154 (42.0) | 213 (58.0) | Ref | Ref |
| Do not clean | 22 (52.4) | 20 (47.6) | 1.25 (0.91–1.71) | 1.59 (0.97–2.62) |
Elizabeth Muhumuza1,2,&, Charles Ssemugabo1, Andrew Tusubira3,4,5, Maggie Ssekitto Ashaba1, Deborah Wanzira6,7, David Guwattudde6
1Department of Disease Control and Environmental Health, School of Public Health, Makerere University, Kampala, Uganda, 2Mildmay Research Centre, Kampala, Uganda, 3Department of Community Health and Behavioral Sciences, School of Public Health, Makerere University, Kampala, Uganda, 4Department of Global Health and Development, Faculty of Public Health and Policy, London School of Hygiene and Tropical Medicine, London United Kingdom, 5MRC/ UVRI and LSHTM Uganda Research Unit, Entebbe, Wakiso, Uganda, 6Department of Epidemiology and Biostatistics, School of Public Health, Makerere University, Kampala, Uganda, 7Pilgrim Africa, Kampala, Uganda
&Corresponding author: Elizabeth Muhumuza, Makerere University-School of Public Health, P.O. Box 7072, Kampala, Uganda. Email: lizhumuza@gmail.com ORCID: https://orcid.org/0009-0005-2505-2282
Received: 17 Nov 2025, Accepted: 21 Feb 2026, Published: 25 Feb 2026
Domain: Occupational Health
Keywords: Pesticides, exposure, smallholder farmers, acute health effects, Uganda
©Elizabeth Muhumuza et al. Journal of Interventional Epidemiology and Public Health (ISSN: 2664-2824). This is an Open Access article distributed under the terms of the Creative Commons Attribution International 4.0 License (https://creativecommons.org/licenses/by/4.0/), which permits unrestricted use, distribution, and reproduction in any medium, provided the original work is properly cited.
Cite this article: Elizabeth Muhumuza et al., Pesticide exposure and associated acute health effects among smallholder farmers in Mbale District, Eastern Uganda. Journal of Interventional Epidemiology and Public Health. 2026; 9(1):34. https://doi.org/10.37432/jieph-d-25-00283
Introduction: Pesticide use for agriculture is on the rise in Uganda. Many farmers improperly use pesticides, which puts them at risk of exposure and adverse health effects. We assessed pesticide exposure levels and acute health effects among smallholder farmers in Mbale district, Uganda.
Methods: A total of 576 smallholder farmers in Mbale District were surveyed in August 2020 to assess pesticide exposure using a semi-structured questionnaire. A cumulative exposure score was generated from six self-reported determinants (e.g., use of personal protective equipment, method of application, mixing, duration of spraying, bathing, and changing clothes after applying pesticides). Farmers with a monthly cumulative pesticide exposure score > 22.5 were categorised as having high exposure to pesticides. We used a multivariable modified Poisson regression model to determine factors associated with high pesticide exposure, reporting prevalence ratios (PR) and confidence intervals as measures of association.
Results: Of the 576 smallholder farmers, 71% (409/576) reported using pesticides, and 70% (403/576) were male. Of the 409 pesticide users, 43.0% (176/409) experienced high exposure to pesticides. Among pesticide users, majority, 80.9% (331/409), reported at least one acute health effect, with skin irritation (60.5%), headache (31%), nausea (24.7%) and dizziness (27.4%) being the most common. High pesticide exposure levels were twice as high among male pesticide users (aPR 2.19; 95% CI: 1.49, 3.20) compared to females. Farmers who used pesticide mixtures (aPR: 1.47; 95%CI: 1.03, 2.10) were more likely to experience high levels of pesticide exposures. Wearing rubber boots while handling pesticides (aPR: 0.49; 95%CI: 0.34, 0.71) was protective of high pesticide exposure.
Conclusion: Exposure to pesticides was high among smallholder farmers, particularly among males and those who used pesticide mixtures. These findings highlight the need for targeted occupational health and agricultural policies to strengthen safe pesticide handling practices and mitigate exposure-related health effects among smallholder farmers.
According to the World Health Organization (WHO), about 2.2 million people, predominantly living in low-income countries (LICs) are at increased risk of exposure to pesticides [1]. Globally, an estimated 18.2 per 100,000 agricultural workers experience occupational pesticide poisoning, mainly during pesticides handling and application [2]. Pesticide exposure occurs through inhalation of aerosols and vapors, ingestion during activities such as eating while spraying, and dermal contact [3]. In LICs, several factors contribute to pesticide exposure. These include poor pesticide handling practices such as: inappropriate use of personal protective equipment (PPE), improper storage of pesticides at home [4], smoking and drinking during pesticide spraying [5], inadequate knowledge of pesticide use [6], and poor implementation of laws regulating pesticide distribution and use [7].
In the Eastern highlands of Uganda including Mbale District, more than half (58%) of smallholder farmers have been chronically exposed to pesticides for more than 10 years [8]. Farmers in Mbale District primarily cultivate food crops such as beans and maize [9]. However, between June 2016 and December 2017, maize production across Uganda was severely affected by the fall armyworm infestation, leading to increased reliance on pesticides to protect crops. Consequently, farmers widely applied WHO class II pesticides including Profenofos, Cypermethrin, Thiamethoxam and Lambda-Cyhalothrin to control pests [10]. Despite the increased use of pesticides, studies have shown that pesticide handling practices among farmers in Uganda remain poor [11]. Personal protective equipment (PPE) utilization is low [8], with 73% of farmers wearing ordinary clothing during spraying, and 61% using their mouths to unblock the sprayer nozzles [11]. These unsafe practices persist despite the existence of regulatory frameworks.
The government of Uganda enacted the Agricultural Chemicals Control Act, 2006, to control and regulate the manufacture, storage, use, importation, exportation, distribution, and trade of agricultural chemicals [12]. The Act outlines safety protocols requiring certified pesticide applicators and strict adherence to manufacturer guidelines. Although legislation exists to regulate pesticide use, it’s implementation remains poor in Uganda [13]. This has contributed to the suboptimal pesticide handling practices.
Improper pesticide use has been associated with a range of acute health effects including headaches, body weakness, difficulty in breathing, depression, salivation, stomach ache, muscle pains, and skin and eye irritations, among others, during or after applying pesticides [11,14]. Prolonged or unregulated exposure may also result in more adverse and chronic health conditions such as leukemia, lymphoma, brain, kidney and breast cancer; disturbed neuro-development in children, allergies, decreased fertility, reduced visual ability, diabetes and Parkinson’s disease among others[15]. Despite the health risks, the magnitude of pesticide exposure and the associated health effects among smallholder farmers in Uganda, particularly Mbale District remains insufficiently quantified. Therefore, this study aimed to assess pesticide exposure and acute health effects among smallholder farmers in Mbale District, Eastern Uganda. These aspects make it easier for stakeholders to take action in planning appropriate policies and interventions for monitoring, prevention, and control of pesticide exposure in the population[16].
Study setting
The study was conducted in Mbale District, located in Eastern Uganda. The district covers a total area of 519km2 with an estimated total population of 488,960. The total population for males is 233,339, and 255,621 for females [9]. Mbale comprises one county, one municipality, 19 sub-counties, 114 parishes and 912 villages [9]. The primary economic activity is agriculture, and 75,506 of the 108,558 households in Mbale District are engaged in crop growing. Of the 75,506 households engaged in crop growing, 61,652 grow maize, 14,613 grow coffee, 67,832 grow beans, 9891 grow millet, 16,462 grow sweet potatoes, and 34,988 grow bananas. Over 61,771 households are engaged in livestock farming [9].
Study design and population
A cross-sectional study was conducted, employing exclusively quantitative data collection techniques. This study was conducted among smallholder farmers in Mbale District. Smallholder farmers were defined as individuals who cultivate crops on small plots of land mainly for home consumption and one or two cash crops, with help from family members. Inclusion criteria comprised smallholder farmers aged 18 years or older, or emancipated minors, with a minimum of one month’s residency and farming experience in Mbale District. Individuals unable to participate in interviews due to illness or debilitation at the time of the study were excluded.
Sample size
The sample size was determined using the Kish-Leslie (1965) formula for cross-sectional studies [17]. A precision of 5% and a 95% confidence level were assumed. An estimated proportion of 47.5% of farmers using pesticides, adopted from a previous study among smallholder farmers in Uganda [18] was used in the calculation. This yielded an initial sample size of 384 participants. Since the multistage sampling technique was employed, a design effect of 1.5 was applied, resulting in a final sample size of 576 participants.
Sampling procedure
Multi-stage sampling was used. First, three sub-counties; Bukasakya, Bungokho and Busoba were purposively selected based on the fact that most of their residents are typical smallholder farming communities actively involved in crop growing. From each subcounty, two parishes were randomly selected and a list of the villages in each parish was provided by the respective sub-county offices. Simple random sampling was then used to select 10 villages from each parish. Finally, systematic random sampling was applied to select households from the selected villages. The study units were the household heads or any adult household member who was a smallholder farmer. In cases where the household head was unavailable at the time of the interview, and two or more eligible adults or emancipated minors (who fit the inclusion criteria) were present, simple random sampling was used to select the study participant.
Data collection and study variables
Data were collected in August 2020 through face-to-face interviews using a semi structured questionnaire adapted from previous studies conducted in Uganda [11] and Chile [19]. Data collection tools were translated from English to Lugisu and back translated to ensure consistency, and pretested among 5% of study participants in Pallisa District which borders Mbale District to the Northwest. Data were collected by trained research assistants, who conducted interviews with support from the LCI chairman and Village Health Team (VHT) members. Interviews were conducted between mid-day and 5:00 pm, when farmers had typically returned from farm work. The principal investigator supervised data collection and conducted daily data quality checks to ensure accuracy, consistency and completeness.
The primary outcome variable was pesticide exposure, defined as contact with pesticides through dermal, inhalation or accidental ingestion during application and handling of pesticides. The secondary outcome variable was acute health effects, defined as any illness occurring during mixing or application of pesticides or within 48 hours thereafter. Independent variables included socio-demographic variables (i.e., sex, age in completed years, marital status, and educational level) and pesticide handling practices (i.e., frequency of pesticide application, the application technology used, use of PPE, personal hygiene practices, use of farmer prepared pesticide mixtures).
Pesticide exposure was assessed using self-reported pesticide use by the farmers and a questionnaire-based deterministic algorithm from Furhimann [20]. The algorithm was modified to include direct observation of the PPE and pesticide application equipment to validate self-reports by the farmers. Acute health effects were assessed by asking respondents about symptoms experienced immediately after mixing and spraying pesticides in the last one month preceding the study. The smallholder farmers were encouraged to spontaneously mention all the symptoms they could recall.
Data analysis
Data were analyzed using STATA 14.0 (StataCorp, College Station, Texas, USA). To assess pesticide exposure levels among smallholder farmers, the prevalence of pesticide use among smallholder farmers in Mbale was determined initially. In addition, calculation of the PPE exposure intensity and cumulative monthly exposure scores in Microsoft Excel was done for the farmers who used pesticides. The pesticides exposure levels (low exposure and high exposure) were presented as frequencies and percentages.
Outcome measurement
The determinants used to estimate the pesticide exposure level included: PPE use, application and mixing of pesticides, showering and changing clothes after pesticide application, duration of spraying. The PPE scores, exposure intensity scores and the cumulative exposure score for last month prior to the study were calculated at data analysis stage (Table 1).
PPE score
The exposure scores through the use of PPE were estimated while taking into account the different inhalation and dermal exposure pathways [20]. For example, if one reports using rubber gloves (PPE-3) and a fabric overall (PPE-1) then, the PPE score = 0.4
Exposure intensity score (Exposure Intensity)
\[
\text{Exposure Intensity} =
(\text{Mix} + \text{Application}) \times
\text{PPE} \times
\text{Shower} \times
\text{Change} \; [20]
\]
Cumulative Monthly Exposure (Exposure Month)
The Cumulative monthly exposure score (Exposure Month) was estimated by multiplying the exposure intensity score (Exposure Intensity) and the duration of pesticide spraying during the month prior to the study [20].
Exposure Month = Exposure Intensity × duration of pesticide spraying during last month (hours)
In order to categorize cumulative pesticide exposure as a dichotomous variable (low exposure and high exposure), the dermal exposure ranking method (DERM) was applied. This is a task-based exposure assessment method developed specifically for use in low-income country agricultural settings. Unlike exposure assessment methods designed for high-income countries, the DERM approach is suited to smallholder farming systems in low-income countries including Uganda, where detailed biomonitoring data are often unavailable. Consistent with the DERM qualitative ranking system, a score ≤ 22.5 was considered as having low exposure, while scores >22.5 indicated high pesticide exposure[21]. In this study, the DERM was contextually adapted to reflect pesticide handling practices among Ugandan smallholder farmers while retaining the original scoring structure and cutoff to ensure comparability with existing literature.
Bivariable and multivariable analysis
Bi-variable analysis using Prevalence Ratios (PR), and their 95% confidence intervals (CI) was performed to assess the relationship between the independent variables (age, education level, sex, marital status, number of family members in the household and the pesticide handling practices) and the outcome variable (exposure to pesticides). Prevalence ratios were estimated using the Modified Poisson Regression analysis, with robust standard errors.
Multi-collinearity was tested, and collinear variables (e.g., use of sharp objects to unblock a backpack sprayer nozzle and storage practices) were excluded from the multivariable analysis. Independent variables with a p<0.2 at bi-variable analysis were included in the multivariable model. Specifically, these included sociodemographic variables e.g., sex, level of education, marital status), and pesticide handling practices (e.g., wearing gumboots for protection, cleaning application equipment, use of: brooms to apply pesticides, a mixture of pesticides, crop pesticides to control pests on domestic animals and farmers’ residences). Backward stepwise method was used in model building while monitoring the Akaike Information Criterion (AIC) of the model, until the lowest AIC of 1.577 and 1.477 were obtained for the socio-demographic factors and pesticide handling practices, respectively. Prevalence ratios and their 95% confidence intervals were used to assess the strength of association. Variables in the final model were considered statistically significant at a p-value ≤0.05.
Ethical consideration
Ethical approval to conduct the study was obtained from Makerere University, School of Public Health, Higher Degrees, Research and Ethics Committee (Approval letter dated 16th July, 2020). Permission was obtained from the Mbale District Health Office. Informed consent was obtained from the study participants before interviewing them. During data collection, interviews were conducted in private settings to ensure confidentiality. All participants were assigned unique identification codes, and no personal identifiers like names on the data collection tools. In addition, data was protected by coding the responses, and electronic data was stored on a computer with a password only known to the principal investigator.
Characteristics of study participants
A total of 576 smallholder farmers participated in the study. Majority 70.0% (403/576), of the smallholder farmers were men, married 81.4% (469/576), with more than half, 58.2% (335/576), having attained primary education. The average age was 41.78 years with a standard deviation of ±14.1. About 38.9% (224/576) and 33.2% (191/576) of the farmers were aged 17-35 and 36-49 years, respectively. The majority of smallholder farmers, 71.0% (409/576), applied pesticides on their crops, and almost half 47.7% (195/409) had been applying pesticides for a period of 1-4 years (Table 2).
The study shows that 43.0% (176/409) of the smallholder farmers experienced high levels of pesticide exposure. The socio-demographic factor that was associated with high pesticide exposure was sex. The proportion of smallholder farmers who were highly exposed to pesticides was 55% lower among females (Adjusted PR:0.45; 95% CI: 0.31-0.67) compared to their male counterparts (Table 3).
Pesticide handling practices associated with pesticide exposure among smallholder farmers in Mbale District
The proportion of smallholder farmers who experienced high pesticide exposure was 51% lower among smallholder farmers who wore rubber boots while applying pesticides (aPR 0.49; 95% CI: 0.34-0.71) compared to those who did not. The proportion of smallholder farmers who experienced high exposure to pesticides was 47% higher among those who used pesticide mixtures (aPR: 1.47; 95% CI:1.03-2.10) compared to those who did not use pesticide mixtures (Table 4).
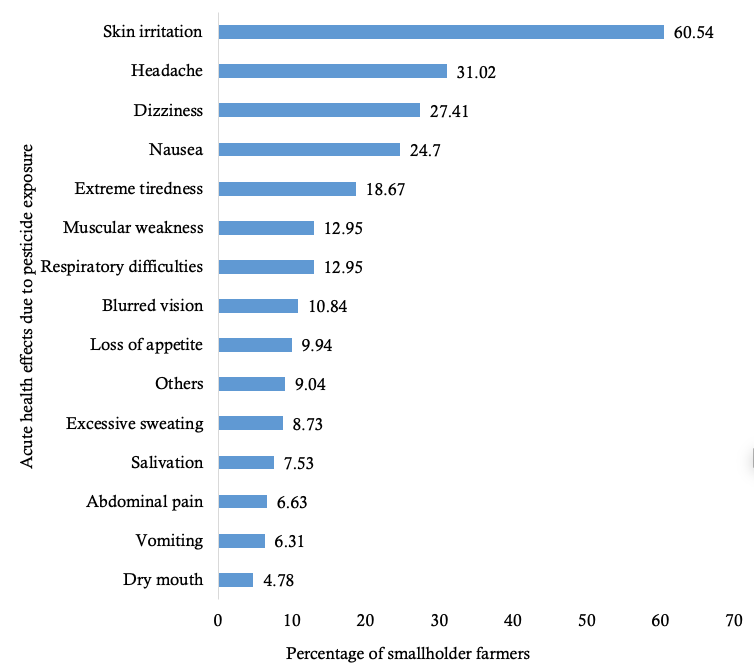
Acute health effects due to pesticide exposure
Majority 80.9% (331/409) of smallholder farmers who applied pesticides had experienced at least one acute health effect due to pesticide exposure. The common acute health effects experienced were: skin irritation, headache, nausea and dizziness (Figure 1). Most smallholder farmers, 60.2% (200/332), reported that the acute health effects lasted less than a week, 35.2% (117/332) experienced these for hours, while 4.5% (15/576) experienced them for a week or more.
This study assessed pesticide exposure and the acute health effects due to pesticide exposure among smallholder farmers in Mbale District, Eastern Uganda. The findings revealed that 43% of the smallholder farmers in Uganda, Mbale District, experienced high levels of pesticide exposure. These findings align with previous research from Tanzania and Bolivia, where most of the farmers were exposed to high levels of pesticides [22,23]. The high pesticide exposure observed among the smallholder farmers in Mbale is likely attributable to unsafe pesticide handling practices, including inadequate use of PPE, poor pesticide storage and disposal, suboptimal hygiene practices and prolonged working hours in the fields. These findings highlight a significant occupational health gap among smallholder farmers and the need for policy measures that improve access to affordable PPE, strengthen agricultural extension services on safe pesticide use and promote integrated pest management to reduce reliance on chemical pesticides.
Males in Mbale District were more likely to experience higher pesticide exposure than females, likely reflecting gendered roles in pesticide application, as men predominantly undertake spraying activities that involve direct handling of pesticides. This finding aligns with studies from Oyo state, Nigeria and Wakiso District, Uganda [11,24], although contrasting evidence by Gangemi and colleagues revealed that females had a higher level of pesticide contamination than males [25]. These variations underscore the importance of task-specific exposure assessment over gender alone. Consequently, occupational health interventions should be guided by work practices and exposure profiles to accurately identify at-risk groups. To reduce pesticide exposure, agricultural extension services in districts should be strengthened to provide targeted training on safe pesticide handling practices for both male and female farmers. These should follow standard guidelines on pesticide use as recommended by the Food and Agriculture Organization (FAO) and WHO.
The proportion of smallholder farmers with high exposure to pesticides was lower among those who wore rubber boots compared to those who did not. This is probably due to their chemical-resistant properties that reduce dermal contact during mixing, spraying and movement through sprayed fields. Similar findings were reported in Arusha, Tanzania, where wearing rubber boots during pesticide application reduced the risk of skin rash [5,22]. In addition, evidence from Thailand indicated that inadequate use of PPE, including goggles and nose masks, increased the likelihood of acute pesticide poisoning [26]. While the use of PPE alone does not eliminate exposure, it remains an important protective measure. Remittances may enhance farmers’ ability to acquire PPE by easing financial constraints, which can improve productivity and potentially generate higher household income and subsequent remittance flow. Therefore, improved access to affordable PPE, coupled with routine training through government-supported programs, farmer cooperatives, and private sector partnerships, could enhance PPE use and reduce pesticide exposure among smallholder farmers.
Smallholder farmers who reported using a mixture of pesticides were more likely to experience high exposure to pesticides than those who did not. This is probably because mixing of different pesticide formulations can alter their chemical properties, thereby increasing its detrimental effects on health and environment. This finding is consistent with previous studies in India and Ghana [27,28] where pesticide mixing was associated with elevated exposure risks and adverse health outcomes. The codes of best practices prohibit use of pesticide mixtures unless recommended by the manufacturer or inherent in the formulation [22,29]. Pesticide mixtures should therefore be strongly discouraged because these mixtures can affect plant health, reduce crop yield and result in multiple pesticide residues in the sprayed crops [30,31], which can cause various health hazards in humans as well as high production costs. Strengthening regulatory oversight on pesticide labeling and sales alongside integrating targeted training on the risk of mixing pesticides into routine agricultural extension and occupational health programs is essential.
The majority of smallholder farmers who applied pesticides had experienced at least one acute health effect, commonly skin irritation, headache, back pain and dizziness. Similar findings have been documented among farmers in Bolivia and Pakistan [23,32] and Tanzania [22]. In contrast, burning eyes, dry cough, fever, dry throat and blurred vision were most experienced by farmers in another study in Tanzania [32]. These health effects may be attributed to a lack of knowledge and the failure of the smallholder farmers to exercise proper pesticide handling practices. Smallholder farmers should therefore be cautious while applying pesticides and seek medical attention in case they experience acute health effects due to pesticide exposure. These findings highlight an occupational health gap among smallholder farmers and underscore the need for strengthened agricultural extension services, targeted training on safe pesticide use and improved enforcement of pesticide safety regulations, to reduce the related health risks. Additionally, routine health surveillance and reporting of pesticide related symptoms at primary health care facilities could support early detection and prevention.
Study limitations
Pesticide handling practices in the month preceding the study were self-reported, introducing the possibility of recall bias, which may have resulted in over or underestimation of reported pesticide exposures and their associations. However, to verify the smallholder farmers’ reports, selected pesticide handling practices, such as PPE use, application techniques used and the type of pesticides used were observed. The cross-sectional design limited causal inferences. In addition, the study used a purely quantitative approach which limited inclusion of qualitative insights to supplement the quantitative data. Furthermore, the study did not explicitly examine gender dynamics in access to agricultural mechanization, which may influence pesticide handling practices and exposure patterns differently among male and female farmers. Future research should explicitly examine these dynamics.
Although cumulative pesticide exposure cut off scores were derived using the qualitative DERM framework, alternative data-driven cut-offs (e.g., quartiles or tertiles) could further refine exposure classification and should be explored in future studies. Direct measurement of pesticide exposure using passive sampling methods (e.g., silicone wrist bands) was not feasible due to resource constraints.
Less than half of the smallholder farmers experienced high pesticide exposure levels. Majority of smallholder farmers had experienced at least one acute health effect due to pesticide exposure, with skin irritation, headache, nausea and dizziness being the most commonly reported. Being female and the use of rubber boots was associated with lower pesticide exposure, while practices such as using pesticide mixtures were linked to higher pesticide exposure levels among smallholder farmers in Mbale District. Given the cross-sectional study design and reliance on self-reported data, these findings indicate associations rather than causal relationships. Nonetheless, the findings demonstrate important occupational health gaps in pesticide handling among smallholder farmers. To reduce pesticide exposure levels and related health effects, the Ministry of Health and the Ministry of Agriculture, Animal Industry and Fisheries should strengthen enforcement of existing regulations on use of agricultural chemicals, scale up routine farmer training and certification in safe pesticide handling practices, promote extensive trainings on Integrated Pest Management (IPM) and improve access to affordable PPE through cooperatives and public private partnerships.
What is already known about the topic
What this study adds
EM conceptualized the study, implemented data acquisition, performed data analysis and wrote the original draft of the manuscript. CS Conceptualized the study, reviewed the initial study reports and manuscript. MSA and DW participated in writing original draft, reviewed and edited drafts of manuscript. AKT reviewed and edited drafts of the manuscript. DG Reviewed initial reports and provided technical guidance during the conceptualization of the study and reviewed the manuscript. All authors read and approved the final manuscript.
| Determinants | Question | Option | Score | Observation (Tick what you see) |
|---|---|---|---|---|
| PPE | What type of PPE do you wear while spraying? | PPE-0 (Never wears PPE) | 1.0 | |
| PPE-1 (Face shield/goggles, fabric/leather gloves, apron, overall, long sleeves & trousers, dust mask) | 0.8 | Yes / No | ||
| PPE-2 (Rubber boots, gas mask, disposable outer clothing – Tyvek) | 0.7 | Yes / No | ||
| PPE-3 (Chemically resistant rubber gloves) | 0.6 | Yes / No | ||
| PPE-1 and PPE-2 | 0.5 | Yes / No | ||
| PPE-1 and PPE-3 | 0.4 | Yes / No | ||
| PPE-2 and PPE-3 | 0.3 | Yes / No | ||
| PPE-1, PPE-2 and PPE-3 | 0.1 | Yes / No | ||
| MIX | Do you mix pesticides? | Yes | 9.0 | Scores adopted from (37) |
| No | 0.0 | |||
| APPLICATION | What do you use for applying pesticides? | Backpack sprayer | 8.0 | Yes / No |
| Hand sprayer | 9.0 | Yes / No | ||
| Brooms | 9.0 | Yes / No | ||
| CHANGE | How long does it take between the end of application and changing your clothes? | Immediately | 0.7 | N/A |
| Few hours later (≤ 3 hours) | 0.8 | |||
| Many hours later (> 4 hours) | 0.9 | |||
| Next day | 1.0 | |||
| SHOWER | How long does it take between the end of application and showering? | Immediately | 0.7 | N/A |
| Few hours later (≤ 3 hours) | 0.8 | |||
| Many hours later (> 4 hours) | 0.9 | |||
| Next day | 1.0 | |||
| Duration of spraying (hours) | How many times have you sprayed in the last month? | Number of times sprayed in the last month × time spent while spraying in that month | ||
| For how long do you spray every time you spray? | ||||
| *N/A: Not applicable | ||||
| Variable | Frequency (n = 576) | Percentage (%) |
|---|---|---|
| Sex | ||
| Male | 403 | 70.0 |
| Female | 173 | 30.0 |
| Age (Mean ± SD) | 41.8 (±14.1) | |
| Age groups | ||
| 17–35 | 224 | 38.9 |
| 36–49 | 191 | 33.2 |
| 50 and above | 161 | 28.0 |
| Marital status | ||
| Single | 47 | 8.2 |
| Married | 469 | 81.4 |
| Separated / Divorced / Widowed | 60 | 10.4 |
| Level of education | ||
| None | 53 | 9.2 |
| Primary | 335 | 58.2 |
| Secondary / tertiary | 188 | 32.6 |
| Number of household members | ||
| 1–5 | 260 | 45.1 |
| 6–10 | 258 | 44.8 |
| ≥11 | 58 | 10.1 |
| Use pesticides | ||
| Yes | 409 | 71.0 |
| No | 167 | 29.0 |
| Years of applying pesticides | ||
| < 1 | 76 | 18.6 |
| 1–4 | 195 | 47.7 |
| 5–9 | 86 | 21.0 |
| ≥10 | 52 | 12.7 |
| DERM score | ||
| ≤22.5 | 233 | 57.0 |
| >22.5 | 176 | 43.0 |
| Use pesticide mixtures | ||
| Yes | 215 | 52.6 |
| No | 194 | 47.4 |
| Storage practices | ||
| Bedroom | 87 | 21.3 |
| House ceiling / roof | 77 | 18.8 |
| Lockable store | 118 | 28.9 |
| Kitchen | 45 | 11.0 |
| Living room | 47 | 11.5 |
| Others | 35 | 8.6 |
| Clean PPE application containers after spraying | ||
| Yes | 367 | 89.7 |
| No | 42 | 10.3 |
| Time taken to re-enter field after spraying | ||
| ≤ 12 hours | 107 | 26.2 |
| > 12 hours | 302 | 73.8 |
| Use crop pesticides for domestic purposes | ||
| Spraying pests in the house | 170 | 85.0 |
| Preserve seeds | 37 | 18.6 |
| Treat skin infections | 13 | 6.5 |
| Use on livestock to kill pests | 44 | 22.1 |
| Others | 3 | 1.5 |
| Variable | Exposure to pesticides | Unadjusted PR (95% CI) | Adjusted PR (95% CI) | |
|---|---|---|---|---|
| High n (%) | Low n (%) | |||
| Sex | ||||
| Male | 153 (49.8) | 154 (50.2) | Ref | Ref |
| Female | 23 (22.6) | 79 (77.5) | 0.45 (0.31–0.66) *** | 0.45 (0.31–0.67) *** |
| Age group | ||||
| 17–35 | 61 (40.4) | 90 (59.6) | Ref | |
| 36–49 | 68 (44.2) | 86 (55.8) | 1.09 (0.84–1.42) | – |
| ≥50 | 47 (45.2) | 57 (54.8) | 1.12 (0.84–1.49) | – |
| Level of education | ||||
| None | 19 (50.0) | 19 (50.0) | Ref | Ref |
| Primary | 101 (43.4) | 132 (56.7) | 0.87 (0.61–1.23) | 0.93 (0.66–1.32) |
| Secondary / Tertiary | 56 (40.6) | 82 (59.4) | 0.81 (0.56–1.18) | 0.86 (0.60–1.25) |
| Marital status | ||||
| Single | 16 (48.5) | 17 (51.5) | Ref | Ref |
| Married / Cohabiting | 152 (43.3) | 199 (56.7) | 0.89 (0.62–1.30) | 0.82 (0.57–1.20) |
| Separated / Divorced / Widowed | 8 (32.0) | 17 (68.0) | 0.66 (0.34–1.29) | 0.76 (0.40–1.47) |
| Number of family members | ||||
| 1–5 | 64 (39.0) | 100 (61.0) | Ref | |
| 6–10 | 90 (46.4) | 104 (53.6) | 1.19 (0.93–1.52) | – |
| ≥11 | 22 (43.1) | 29 (56.9) | 1.11 (0.76–1.60) | – |
| Variable | Exposure to pesticides | Unadjusted PR (95% CI) | Adjusted PR (95% CI) | |
|---|---|---|---|---|
| High n (%) | Low n (%) | |||
| Use brooms to apply pesticides | ||||
| No | 168 (47.3) | 187 (52.7) | Ref | Ref |
| Yes | 8 (15.1) | 45 (84.9) | 0.32 (0.17–0.61) ** | 0.50 (0.22–1.12) |
| Use a sharp object to unblock a backpack sprayer nozzle | ||||
| No | 46 (59.7) | 31 (40.3) | Ref | |
| Yes | 127 (41.4) | 180 (58.6) | 0.69 (0.55–0.87) ** | – |
| Use pesticide mixtures | ||||
| No | 90 (41.9) | 34 (42.5) | Ref | Ref |
| Yes | 86 (44.3) | 143 (61.9) | 1.06 (0.85–1.32) | 1.47 (1.03–2.10) * |
| Wear rubber boots for protection | ||||
| No | 46 (57.5) | 34 (42.5) | Ref | Ref |
| Yes | 88 (38.1) | 143 (61.9) | 0.66 (0.52–0.85) ** | 0.49 (0.34–0.71) *** |
| Storage of pesticides | ||||
| Bedroom | 44 (50.6) | 43 (49.4) | Ref | |
| House ceiling/roof | 22 (28.6) | 55 (71.4) | 0.57 (0.38–0.85) ** | – |
| Lockable store | 56 (47.9) | 61 (52.1) | 0.95 (0.71–1.25) | – |
| Kitchen | 13 (28.9) | 32 (71.1) | 0.57 (0.35–0.95) * | – |
| Living room | 24 (51.1) | 23 (49.0) | 1.01 (0.71–1.43) | – |
| Others | 17 (48.6) | 18 (51.4) | 0.92 (0.64–1.43) | – |
| Use crop pesticides to control pests on domestic animals | ||||
| No | 68 (43.9) | 11 (36.7) | Ref | Ref |
| Yes | 8 (18.2) | 112 (65.9) | 0.41 (0.22–0.80) ** | 0.45 (0.22–0.91) * |
| Use crop pesticides to spray pests in the farmers residence | ||||
| No | 19 (63.3) | 11 (36.7) | Ref | Ref |
| Yes | 58 (34.1) | 112 (65.9) | 0.52 (0.38–0.76) *** | 0.43 (0.29–0.64) *** |
| Clean pesticide application equipment | ||||
| Wash / wipe | 154 (42.0) | 213 (58.0) | Ref | Ref |
| Do not clean | 22 (52.4) | 20 (47.6) | 1.25 (0.91–1.71) | 1.59 (0.97–2.62) |