Research | Open Access | Volume 9 (1): Article 46 | Published: 14 Mar 2026
Views: 2,864
Menu, Tables and Figures
| Production Scale | Number of Farms | Fish Samples Collected | |||
|---|---|---|---|---|---|
| Siavonga | Kafue | Kafue | Siavonga | Total | |
| Large Scale Commercial | 2 | 3 | 15 | 25 | 40 |
| Medium Scale Commercial | 1 | 1 | 20 | 20 | 40 |
| Small Scale Commercial | 2 | 2 | 20 | 18 | 38 |
| Total Collected | 5 | 6 | 55 | 63 | 118 |
Table 1: Number of fish samples collected
| Production capacity | Cage culture (n = 63), n (%) | Total (N = 118), n (%) | p-value | |
|---|---|---|---|---|
| Kafue | Siavonga | |||
| Presumptive Escherichia coli | ||||
| Large-scale commercial | 6 (50.0) | 2 (33.3) | 8 (44.4) | 0.76 |
| Medium-scale commercial | 5 (41.7) | 3 (50.0) | 8 (44.4) | |
| Small-scale commercial | 1 (8.3) | 1 (16.7) | 2 (11.1) | |
| Total positive isolates | 12 (100.0) | 6 (100.0) | 18 (100.0) | |
| Presumptive Salmonella spp. | ||||
| Large-scale commercial | 12 (63.2) | 9 (39.1) | 21 (50.0) | 0.3 |
| Medium-scale commercial | 5 (26.3) | 10 (43.5) | 15 (35.7) | |
| Small-scale commercial | 2 (10.5) | 4 (17.4) | 6 (14.3) | |
| Total positive isolates | 19 (100.0) | 23 (100.0) | 42 (100.0) | |
| Presumptive Aeromonas spp. | ||||
| Large-scale commercial | 1 (25.0) | 0 (0.0) | 1 (25.0) | NaNa |
| Medium-scale commercial | 3 (75.0) | 0 (0.0) | 3 (75.0) | |
| Small-scale commercial | 0 (0.0) | 0 (0.0) | 0 (0.0) | |
| Total positive isolates | 4 (100.0) | 0 (0.0) | 4 (100.0) | |
| Presumptive Vibrio spp. | ||||
| Large-scale commercial | 12 (100.0) | 15 (34.1) | 27 (48.2) | <0.001 |
| Medium-scale commercial | 0 (0.0) | 20 (45.5) | 20 (35.7) | |
| Small-scale commercial | 0 (0.0) | 9 (20.5) | 9 (16.1) | |
| Total positive isolates | 12 (100.0) | 44 (100.0) | 56 (100.0) | |
| Presumptive Lactococcus garvieae | ||||
| Large-scale commercial | 2 (11.1) | 12 (46.2) | 14 (31.8) | 0.016 |
| Medium-scale commercial | 10 (55.6) | 5 (19.2) | 15 (34.1) | |
| Small-scale commercial | 6 (33.3) | 9 (34.6) | 15 (34.1) | |
| Total positive isolates | 18 (100.0) | 26 (100.0) | 44 (100.0) | |
| Presumptive Streptococcus spp. | ||||
| Large-scale commercial | 0 (0.0) | 1 (25.0) | 1 (25.0) | NaNa |
| Medium-scale commercial | 0 (0.0) | 3 (75.0) | 3 (75.0) | |
| Small-scale commercial | 0 (0.0) | 0 (0.0) | 0 (0.0) | |
| Total positive isolates | 0 (0.0) | 4 (100.0) | 4 (100.0) | |
NaNa = could not be calculated – At least one row or column contains all zeros
Table 2: Prevalence of Bacterial Pathogens Across Production Systems and Farm Scales in Commercial Fish Farming in Kafue and Siavonga Districts of Zambia
| Pathogen | Pond Culture | Cage Culture | ||||
|---|---|---|---|---|---|---|
| Large Scale Commercial | Medium Scale Commercial | Small Scale Commercial | Large Scale Commercial | Medium Scale Commercial | Small Scale Commercial | |
| Presumptive Escherichia coli | 0.06 | 0.12 | 0.13 | 0.19 | 0.07 | 0.05 |
| Presumptive Lactococcus garvieae | 0.26 | 0.16 | 0.04 | 0.20 | 0.48 | 0.20 |
| Presumptive Vibrio spp | 0.05 | 0.27 | 0.14 | 0.32 | 0.08 | 0.10 |
Table 3: Antimicrobial Resistance Index of the bacteria isolated from market-ready tilapia in the different production systems
| Production Scale | Antibiotic residues in fish muscle (µg/kg) | |||||||||
|---|---|---|---|---|---|---|---|---|---|---|
| Sulfamethoxazole | Trimethoprim | Penicillin G | Ampicillin | Tetracycline | Oxytetracycline | Gentamicin | Tiamulin | Erythromycin | Tylosin | |
| Pond Culture | ||||||||||
| Large Scale | <0.1* | <0.05* | <0.7* | <0.07* | <15* | <15* | <10* | <0.1* | <0.1* | <0.4* |
| Large Scale | <0.1* | <0.05* | <0.7* | <0.07* | <15* | <15* | <10* | <0.1* | <0.1* | <0.4* |
| Large Scale | <0.1* | <0.05* | <0.7* | <0.07* | <15* | <15* | <10* | <0.1* | <0.1* | <0.4* |
| Medium Scale | <0.1* | <0.05* | <0.7* | <0.07* | <15* | <15* | <10* | <0.1* | <0.1* | <0.4* |
| Medium Scale | <0.1* | <0.05* | <0.7* | <0.07* | <15* | <15* | <10* | <0.1* | <0.1* | <0.4* |
| Medium Scale | <0.1* | <0.05* | <0.7* | <0.07* | <15* | <15* | <10* | <0.1* | <0.1* | <0.4* |
| Small Scale | <0.1* | <0.05* | <0.7* | <0.07* | <15* | <15* | <10* | <0.1* | <0.1* | <0.4* |
| Small Scale | <0.1* | <0.05* | <0.7* | <0.07* | <15* | <15* | <10* | <0.1* | <0.1* | <0.4* |
| Small Scale | <0.1* | <0.05* | <0.7* | <0.07* | <15* | <15* | <10* | <0.1* | <0.1* | <0.4* |
| Small Scale | <0.1* | <0.05* | <0.7* | <0.07* | <15* | <15* | <10* | <0.1* | <0.1* | <0.4* |
| Cage Culture | ||||||||||
| Large Scale | <0.1* | <0.05* | <0.7* | <0.07* | <15* | <15* | <10* | <0.1* | <0.1* | <0.4* |
| Large Scale | <0.1* | <0.05* | <0.7* | <0.07* | <15* | <15* | <10* | <0.1* | <0.1* | <0.4* |
| Large Scale | <0.1* | <0.05* | <0.7* | <0.07* | <15* | <15* | <10* | <0.1* | <0.1* | <0.4* |
| Large Scale | <0.1* | <0.05* | <0.7* | <0.07* | <15* | <15* | <10* | <0.1* | <0.1* | <0.4* |
| Large Scale | <0.1* | <0.05* | <0.7* | <0.07* | <15* | <15* | <10* | <0.1* | <0.1* | <0.4* |
| Medium Scale | <0.1* | <0.05* | <0.7* | <0.07* | <15* | <15* | <10* | <0.1* | <0.1* | <0.4* |
| Medium Scale | <0.1* | <0.05* | <0.7* | <0.07* | <15* | <15* | <10* | <0.1* | <0.1* | <0.4* |
| Small Scale | <0.1* | <0.05* | <0.7* | <0.07* | <15* | <15* | <10* | <0.1* | <0.1* | <0.4* |
| Small Scale | <0.1* | <0.05* | Detected | <0.07* | <15* | <15* | <10* | <0.1* | <0.1* | <0.4* |
* = Below Minimum Detection Level
Table 4: Antibiotic residues test results from fish muscle


Kunda Ndashe1,&, Geoffrey Mainda2, Chanda Chitala3, Mwaka Sinkala3, Ladslav Moonga1, Emmanuel Kabwali1, Gilbert Nchima3, Henry Kangwa3, Masuzyo Nyirenda4, Chitwambi Makungu2, Mark Caudell5, Katendi Changula1, Niwael Mtui-Malamsha2, Tabitha Kimani5, John Bwalya Muma6, Mwansa Songe3, Mwendalubi Hadunka7, Bernard Mudenda Hang’ombe1,8
1Department of Paraclinical Studies, School of Veterinary Medicine, The University of Zambia, Lusaka, Zambia, 2Food and Agriculture Organisation of the United Nations, Lusaka, Zambia, 3Central Veterinary Research Institute, Department of Veterinary Services, Ministry of Fisheries and Livestock Development, Lusaka P.O. Box 33980, Zambia, 4Department of Fisheries, Ministry of Fisheries and Livestock Development, Chilanga, Zambia, 5Food and Agriculture Organisation of the United Nations, Nairobi, Kenya, 6Department of Disease Control, School of Veterinary Medicine, The University of Zambia, Lusaka, Zambia, 7Department of Animal Health, Centre for Infectious Disease Research in Zambia (CIDRZ), Lusaka, Zambia, 8Directorate of Research and Innovation, Copperbelt University, Jambo Drive, P. O Box 21692, Kitwe, Zambia
&Corresponding author: Kunda Ndashe, Department of Paraclinical Studies, School of Veterinary Medicine, The University of Zambia, Lusaka, Zambia. Email: ndashe.kunda@gmail.com, ORCID: https://orcid.org/0000-0003-0478-0174
Received: 01 Aug 2025, Accepted: 13 Mar 2026, Published: 14 Mar 2026
Domain: Antimicrobial Resistance
Keywords: Aquaculture, antimicrobial resistance, antibiotic residues, Nile tilapia, Zambia
©Kunda Ndashe et al. Journal of Interventional Epidemiology and Public Health (ISSN: 2664-2824). This is an Open Access article distributed under the terms of the Creative Commons Attribution International 4.0 License (https://creativecommons.org/licenses/by/4.0/), which permits unrestricted use, distribution, and reproduction in any medium, provided the original work is properly cited.
Cite this article: Kunda Ndashe et al., Microbial profiling, antibiotic susceptibility, and residue detection in market-ready tilapia from key aquaculture regions in Zambia. Journal of Interventional Epidemiology and Public Health. 2026; 9(1):46. https://doi.org/10.37432/jieph-d-25-00168
Introduction: Aquaculture contributes substantially to food and nutrition security in Zambia, but bacterial contamination, antimicrobial resistance (AMR), and antimicrobial residues threaten fish safety and production sustainability. This study investigated bacterial profiles, antibiotic susceptibility patterns, and antimicrobial residues in market-ready Oreochromis niloticus (Nile tilapia) from Kafue and Siavonga, two major aquaculture districts in Zambia.
Methods: A cross-sectional study was conducted on 118 apparently healthy market-ready Nile tilapia collected from 11 farms representing small-, medium-, and large-scale pond and cage culture systems. Bacterial isolation and presumptive identification were performed using selective culture media, Gram staining, and biochemical tests. Antibiotic susceptibility testing was conducted using the disk diffusion method following Clinical and Laboratory Standards Institute guidelines. Antimicrobial residues in fish muscle were analysed using ultra-high-performance liquid chromatography tandem mass spectrometry.
Results: Bacterial occurrence varied by production system and farm scale. Presumptive Vibrio spp. (47.5%), Lactococcus garvieae (37.3%), Salmonella spp. (35.6%), and Escherichia coli (15.3%) were the most frequently detected bacteria. Vibrio spp. was significantly more prevalent in pond culture (p<0.001), while L. garvieae was also significantly associated with production system (p=0.016). E. coli showed 100% resistance to ampicillin, while L. garvieae exhibited complete resistance to tested antibiotics in cage culture. The multiple antibiotic resistance index ranged from 0.04 to 0.48. Only one sample tested positive for penicillin G residue.
Conclusion: Market-ready Nile tilapia in Zambia harbour potentially important foodborne and multidrug-resistant bacteria. Strengthened biosecurity, antimicrobial stewardship, and routine AMR and residue surveillance are needed to support safe and sustainable aquaculture production.
Globally, aquaculture production reached an unprecedented 130.9 million tonnes in 2022, for the first time surpassing wild-caught fisheries and accounting for 51% of the world’s aquatic animal food supply [1]. However, this rapid expansion has also brought food safety challenges. Intensive fish farming often relies on antibiotics to treat diseases, which can lead to antimicrobial residues remaining in fish products destined for human consumption [2]. These residues pose direct public health risks and contribute to the emergence of antimicrobial-resistant (AMR) bacteria in aquaculture environments [2]. Therefore, vigilant monitoring and prudent use of antimicrobials are essential to ensure the safety of aquaculture fish products.
Aquaculture production and fish consumption in Southern Africa have shown marked growth across countries. Zambia leads the region with production reaching about 65,000 tonnes in 2021, supporting a per capita fish consumption of 13.1 kg/year and a fish protein share of 30.6% of total animal protein intake [3]. In contrast, Zimbabwe’s production declined to roughly 5,000 tonnes, with the lowest consumption (2.0 kg/year) and fish share (3.5%) [4]. Moderate producers such as Malawi (10,000 tonnes) and Mozambique (3,000–4,000 tonnes) record relatively high consumption levels (10.1 kg and 13.9 kg/person/year) and high dietary dependence on fish (23.2% and 53.7%, respectively) [4]. Angola also shows high reliance (14.2 kg/year; 29.8%) despite modest output (5,000 tonnes), while South Africa and Namibia, though having higher total animal protein intake (41.1 g and 25.9 g/person/day), exhibit lower fish consumption (6.6 kg and 11.7 kg/year) [4-6]. The lowest figures are recorded in Botswana (2.4 kg), Lesotho (2.9 kg), and Eswatini (4.2 kg) [4]. Overall, these patterns highlight that while Zambia’s aquaculture expansion is driving regional growth, variations in production capacity, market systems, and dietary preferences continue to influence the contribution of aquaculture to food and nutrition security in Southern Africa. However, the intensification of tilapia farming has been accompanied by emerging challenges related to fish health, food safety, and public health.
The growth of the aquaculture sector is affected by disease outbreaks, and among these challenges, bacterial infections caused by opportunistic pathogens such as Aeromonas, Pseudomonas, and Vibrio spp. remain a major constraint to aquaculture productivity, leading to significant economic losses [7]. To mitigate these infections, antibiotics are commonly used in aquaculture systems [8]. While antibiotics play a vital role in controlling disease outbreaks and reducing mortality, their misuse or overuse contributes to the development of AMR, a serious concern for both aquatic animal health and human health [9]. Furthermore, the presence of antibiotic residues in fish destined for human consumption raises additional public health risks, including allergic reactions, chronic exposure to drug residues, and the selection of resistant pathogens in consumers [10]. Given that tilapia is one of the most widely consumed fish in Zambia, ensuring the microbiological safety of market-ready fish is crucial [11]. Microbial profiling of aquaculture products provides critical insights into the bacterial communities present in fish, while antibiotic susceptibility testing of bacterial isolates helps to identify emerging resistance trends. Complementing these efforts with antibiotic residue detection offers a comprehensive assessment of food safety and informs the development of evidence-based policies and best management practices for the aquaculture sector [12].
Despite the rapid expansion of aquaculture in Zambia, there is limited scientific data on the microbiological quality of farmed fish, antibiotic resistance profiles of associated bacteria, and the prevalence of antibiotic residues in market-ready tilapia. This knowledge gap poses a challenge for effective regulation and consumer protection. Therefore, this study profiled the microbial communities associated with market-ready tilapia from key aquaculture regions in Zambia, determined the antibiotic susceptibility patterns of bacterial isolates, and detected the presence of antibiotic residues in fish intended for human consumption. The findings offer valuable insights into the safety and quality of farmed tilapia in Zambia, identify critical risks associated with antibiotic misuse, and inform strategies for sustainable aquaculture production and food safety assurance.
Study design and study area
The study adopted a cross-sectional design, systematically sampling market-ready fish from selected farms to capture representative data across varied aquaculture systems. Conducted in Kafue (15.7700° S, 28.1830° E) and Siavonga (16.5380° S, 28.7180° E)—two major aquaculture hubs in Zambia—the study compared fish from pond and cage culture systems to evaluate their influence on fish health, growth, and productivity.
Pond culture systems, predominant in Kafue, are typically earthen in type and offer greater control over environmental conditions such as water quality, feeding, and disease management. This controlled environment can enhance fish health and reduce stress, leading to consistent growth rates; however, ponds are limited by smaller production volumes and higher land and water management requirements. In contrast, cage culture systems, common in Siavonga on Lake Kariba, enable high-density production in open water bodies, benefiting from natural water exchange and lower infrastructure costs per unit biomass. Nonetheless, cage systems expose fish to fluctuating environmental conditions, higher pathogen transmission risks, and occasional stress from crowding, which can affect health and survival.
The study classified aquaculture farms following the Department of Fisheries (Ministry of Fisheries and Livestock, Zambia) criteria, based on production scale and system type, to evaluate capacity and market orientation. Large-scale farms comprised ponds exceeding 1 hectare or cage units with over 40 cages, producing more than 12 metric tonnes (MT) and 20 MT annually, respectively, mainly supplying commercial and export markets. Medium-scale farms operated ponds of 2,400 m²–1 hectare or 5–40 cages, yielding 3–12 MT and 12–20 MT per year, typically serving regional markets. Small-scale farms managed 600–2,400 m² ponds or 1–5 cages, producing below 3 MT and 12 MT annually, respectively, and primarily targeted local markets with modest infrastructure and limited management capacity.
Sample size estimation
This diverse representation enhanced the robustness of the findings and their applicability to the broader aquaculture industry. A two-stage sampling methodology was employed in Siavonga and Kafue districts to ensure a representative selection of farms and fish samples.
Stage 1: Selection of farms
The first stage involved developing a sampling frame in collaboration with district fisheries officers, identifying fish farms based on production capacity, geographical location, and culture system (cage, pond, or tank). A proportional allocation method was then applied to determine the number of farms to be sampled, ensuring representative coverage across farm sizes and production systems. The number of farms selected (nf) was calculated as:
$$
nf = \left(\frac{N_f}{N}\right) \times ns
$$
where:
Nf = total number of farms in the selected district [Siavonga (25) and Kafue (30)]
N = total number of registered farms in both districts (55)
ns = total number of farms required for the study (determined based on logistical feasibility and study objectives) (11)
Farms were then selected randomly within each district, ensuring proportional representation based on production capacity and system type. Five and six fish farms were selected in Siavonga and Kafue districts, respectively.
Stage 2: Collection of fish samples
Once the farms were selected, the second stage involved collecting fish samples from each farm. The number of fish sampled per farm was determined using Cochran’s formula [13] to ensure an adequate sample size:
$$
n = \frac{Z^{2} P (1 – P)}{d^{2}}
$$
where:
n = sample size,
Z is the Z statistic for a level of confidence (95%) = 1.96
P is the expected prevalence = 8.4% [14]
d is the precision =0.05
The sample size (n) was estimated at 118.
Sample collection
Apparently healthy Nile tilapia were sampled from selected farms for bacterial isolation, antimicrobial susceptibility testing, and antibiotic residue analysis. Target bacteria included Vibrio spp., Lactococcus garvieae, Streptococcus spp., Aeromonas spp., Escherichia coli, and Salmonella spp. Fish were humanely euthanised with clove oil (100–200 mg/L) following ethical guidelines, and bacteriological swabs from the liver and cloaca were aseptically collected. Samples were inoculated onto Blood agar (HiMedia, India) and MacConkey agar (HiMedia, India), with additional enrichment in alkaline peptone water (3% NaCl, pH 8) (HiMedia, India) for 24 hours. All samples were kept in cooler boxes at 4°C during transport to preserve viability and integrity for subsequent bacterial and antimicrobial residue analyses.
Isolation and idenfication of bacterial
Bacterial isolation involved incubating media plates (Blood and MacConkey agar) at 24–28°C for 24 hours upon arrival at the University of Zambia, School of Veterinary Medicine, Bacteriology Laboratory.
A loopfuls from each previously cultured APW tube (liver and cloacal tissue) were innoculated onto Thiosulfate-citrate-bile salts-sucrose (TCBS) agar (HiMedia, India) and incubated at 24–28°C for 24 hours. To purify the Vibrio suspect colonies, a single green and yellow colony from each grown type was streaked onto fresh TCBS agar plates and incubated overnight at 24–28°C. This procedure was repeated until pure, consistent colonies were obtained. Identification was accomplished based on the results of microscopic observation of stained smears using Gram staining and biochemical examination were carried by using the indole test, citrate utilization test, triple sugar iron test and salt tolerance test to detect growth of Vibrio species on 0%, 3% and 6% NaCl [15].
The isolation and identification of Aeromonas spp., Escherichia coli, and Salmonella spp. were preceded by inspecting and selecting colonies on previously inoculated MacConkey agar (HiMedia, India) to facilitate differentiation based on lactose fermentation. The selected isolates were subcultured on MacConkey agar (HiMedia, India) at 24–28°C for 24 hours. Following incubation, colony morphology was recorded, and suspected isolates were subjected to Gram staining for preliminary characterization. Biochemical identification was conducted using oxidase, triple sugar iron (TSI), citrate, and urease tests [15].
Isolation of Streptococcus spp. and L. garvieae was performed by selecting suspect colonies from previously inoculated Blood agar (HiMedia, India), which were subcultured on the same media and incubated at 24–28°C for 24–48 hours under facultative anaerobic conditions. Colony morphology and hemolytic patterns were recorded to differentiate species. Suspected isolates were subjected to Gram staining, catalase testing, and biochemical assays. Sugar fermentation tests, including lactose, mannitol, and trehalose utilization, were performed to further characterize isolates [16].
The isolates of Vibrio spp., Aeromonas spp., L. garvieae., Streptococcus spp., Salmonella spp., and Escherichia coli were stored in glycerol (Tryptone Soya Broth with 50% glycerol at −40 °C) for further antimicrobial susceptibility testing.
Determination of antibiotic susceptibility of selected bacteria
Antibiotic susceptibility testing (AST) was conducted using the disk diffusion method in accordance with the Clinical and Laboratory Standards Institute (CLSI) guidelines to evaluate bacterial resistance profiles [17]. Mueller-Hinton agar (HiMedia, India) plates were inoculated with bacterial suspensions standardized to 0.5 McFarland and incubated at 35–37°C for 16–18 hours. Zones of inhibition surrounding antibiotic disks were measured and interpreted based on CLSI breakpoints to classify isolates as susceptibile, intermediate or resistant. Target bacteria included Vibrio spp., L. garvieae, and Escherichia coli, tested against a panel of antimicrobials comprising Ampicillin (10 µg), Erythromycin (15 µg), Sulfamethoxazole (25 µg), Florfenicol (30 µg), Tetracycline (30 µg), Ceftazidime (30 µg), Ciprofloxacin (5 µg), Gentamicin (10 µg), Meropenem (10 µg), Imipenem (10 µg), Chloramphenicol (30 µg), Co-trimoxazole (25 µg), Amoxicillin-Clavulanic acid (20/10 µg), and Cefoxitin (30 µg).
Evaluation of antimicrobial residues in fish muscle
High-purity antibiotic standards (≥98%) for Sulfamethoxazole, Trimethoprim, Penicillin G, Ampicillin, Tetracycline, Oxytetracycline, Gentamicin, Tiamulin, Erythromycin and Tylosin were procured from Sigma-Aldrich (Germany), along with isotopically labeled internal standards for accurate quantification. High-Performance Liquid Chromatography (HPLC)-grade solvents were sourced from Merck (Germany), and ultrapure water was generated using a Pure Lab Ultra system (UK). Stock solutions (1 mg/mL) were prepared in methanol and stored at -20°C. Working standards (0.5–200 µg/L) were freshly prepared for calibration before each analytical batch.
Fish sample collection and processing
All collected fish samples were analyzed for antibiotic residues. Approximately 0.5 g of fish muscle was homogenized, and antibiotic residues were extracted using ethyl acetate as the extraction solvent, with EDTA added as a chelating agent to minimize interference in Fluoroquinolone detection. The extraction process involved vortexing, sonication, and centrifugation, after which the supernatant was subjected to solid-phase extraction (SPE) for purification using Oasis HLB cartridges (Waters, USA). The purified antibiotic extracts were then evaporated, reconstituted in 500 µL of mobile phase, filtered through a 0.2 µm nylon membrane, and analyzed using UHPLC–MS/MS.
UHPLC-MS/MS analysis and method validation
Samples were analyzed using a Shimadzu Nexera X2 UPLC system with a Hypersil Gold C18 column (30 mm, 1.9 µm) under gradient elution (ethanol and 0.1% formic acid in water) at a flow rate of 500 µL/min. The UPLC system was coupled to a triple quadrupole mass spectrometer (Shimadzu 8050), operated in positive ionization mode using multiple reaction monitoring (MRM) for precise quantification. Calibration curves (0.5–200 µg/L) were established using matrix-matched calibration, with internal standards for accuracy. Method validation included linearity (R² > 0.99), recovery (1, 10, 100 µg/kg), intra-/inter-day precision (RSD <15%), and limits of detection (LOD) and quantification (LOQ) based on ICH guidelines. This validated analytical method ensured high sensitivity, accuracy, and reproducibility for detecting antibiotic residues in fish, supporting reliable residue monitoring and food safety assessments.
Data analysis
Data were organized in Microsoft Excel 2013 and analyzed using DATAtab software [18]. Descriptive statistics (means, frequencies, and percentages) were applied to summarize bacterial prevalence and antibiotic resistance patterns. Associations between production systems and bacterial occurrence were evaluated using the Chi-square (χ²) test with a significance level of p < 0.05. The Multiple Antibiotic Resistance (MAR) index was calculated as a/b, where a represents the number of antibiotics to which an isolate was resistant and b represents the total number of antibiotics tested, to assess the intensity of antimicrobial resistance. Antibiotic residue levels were then compared with established Maximum Residue Limits (MRLs) to evaluate food safety.
Ethical consideration
Ethical approval was obtained from ERES Converge Institutional Review Board (IRB), reference number 2024-Oct-006, before commencement of the study. Written consent was also obtained from participating farmers through the Department of Fisheries before sampling.
A total of 118 fish samples were collected from 11 farms in Siavonga and Kafue districts, covering small-, medium-, and large-scale operations (Table 1). Large-scale farms contributed 40 samples (15 from Kafue, 25 from Siavonga), medium-scale farms also provided 40 samples (20 from each district), and small-scale farms accounted for 38 samples (20 from Kafue, 18 from Siavonga). Siavonga contributed slightly more samples (63) than Kafue (55), ensuring balanced representation across both districts and production scales (Table 1).
Prevalence of bacteria
The prevalence of bacterial pathogens varied notably across production systems and farm scales. Presumptive E. coli was slightly more prevalent in cage culture, detected in 50.0% of large-scale, 41.7% of medium-scale, and 8.3% of small-scale farms, compared to lower rates in pond systems (p=0.76). Presumptive Salmonella spp. showed the highest prevalence in large-scale cage farms (63.2%), while medium- and small-scale farms recorded higher detection rates in pond systems (p=0.30). Presumptive Aeromonas spp. occurred only in cage systems, primarily among medium-scale farms (75.0%). In contrast, presumptive Vibrio spp. showed significantly higher prevalence in pond culture (p<0.001), with medium-scale farms exhibiting the highest occurrence (45.5%) compared to cage systems. Presumptive L. garvieae was also significantly associated with production system (p=0.016), showing higher prevalence in large-scale pond farms (46.2%) and in medium-scale cage farms (55.6%). Presumptive Streptococcus spp. was detected exclusively in pond culture, particularly in medium-scale farms (75.0%). Overall, these findings indicate that the distribution of bacterial pathogens in aquaculture environments is influenced by production systems, farm scale, and associated management practices (Table 2).
Antibiotic susceptibility testing
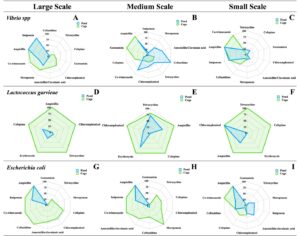
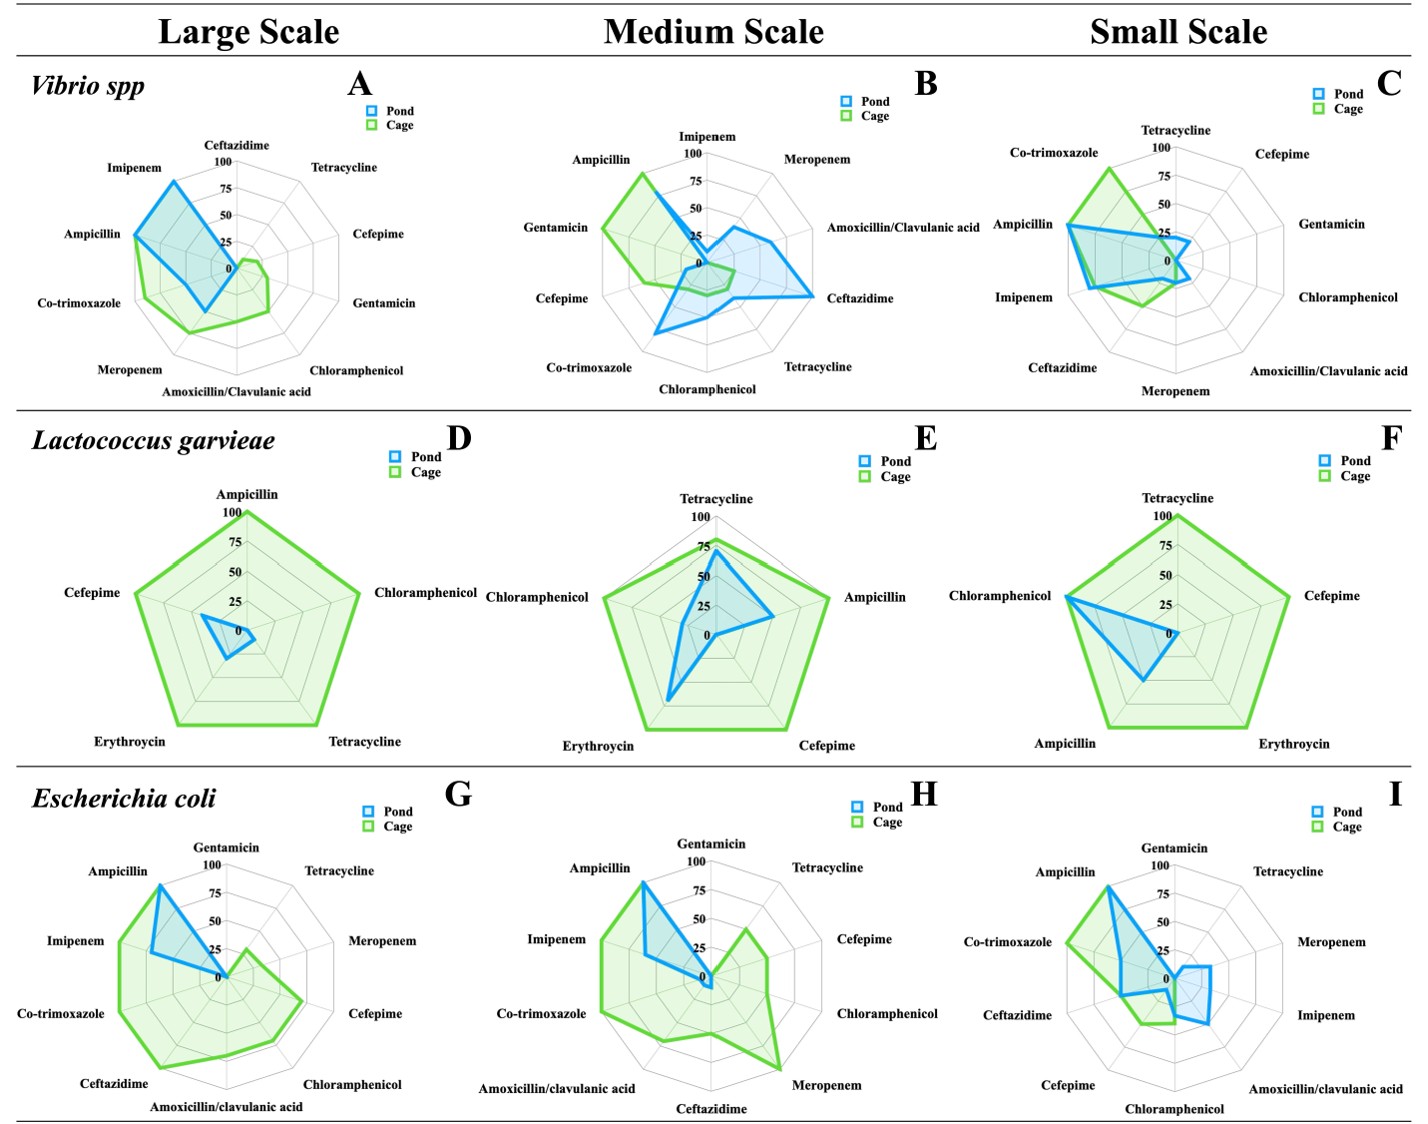
Antibiotic resistance varied significantly across production scales and culture systems (Figure 2). Presumptive Vibrio spp. showed consistently higher resistance in pond culture, with 100% resistance to ampicillin and ceftazidime in medium-scale ponds, and 75–100% resistance to imipenem and ampicillin in small-scale systems, while cage culture remained more susceptible (up to 70% to tetracycline and cefepime). Presumptive L. garvieae exhibited 100% resistance to all antibiotics in cage culture across all scales, whereas pond culture showed partial susceptibility to chloramphenicol (70%) and ampicillin (50%) in medium-scale farms. Presumptive E. coli displayed widespread resistance, including 100% resistance to ampicillin in all systems, with partial susceptibility to meropenem (70%) and amoxicillin–clavulanic acid (50%) in large-scale ponds. The Multiple Antibiotic Resistance (MAR) index ranged from 0.04 to 0.48, with the highest values in L. garvieae (0.48) and Vibrio spp. (0.32) from medium- and large-scale cage farms, indicating substantial antimicrobial exposure and elevated resistance pressure in these production environments (Table 3).
Antibiotic residue detection
The results of antibiotic residue testing in fish muscle samples from pond and cage culture systems across large-, medium-, and small-scale commercial farms revealed minimal detection of antibiotic residues. In pond culture systems, no antibiotic residues were detected for any of the tested antibiotics, including sulfamethoxazole, trimethoprim, penicillin G, ampicillin, tetracycline, oxytetracycline, gentamicin, tiamulin, erythromycin, and tylosin, across all production scales (Table 4). Similarly, in cage culture systems, no residues were detected in large- and medium-scale farms. However, a single positive result for penicillin G was observed in small-scale cage culture farms, indicating the presence of antibiotic residue in fish muscle from this system.
This study provides critical insights into the microbial composition, antibiotic susceptibility profiles, and antimicrobial residue detection in market-ready Nile tilapia from key aquaculture production regions in Zambia. The study identified the presence of Presumptive E. coli, Presumptive Salmonella spp., Presumptive Aeromonas spp., and Presumptive L. garvieae in sampled fish, with significant variations in pathogen prevalence across different aquaculture systems. Bacterial prevalence was notably higher in cage culture systems compared to pond-based systems, likely due to increased stocking densities, lower dissolved oxygen levels, and organic waste accumulation—factors that promote bacterial proliferation. Similar trends have been reported in Chilean salmon aquaculture, where intensive farming practices facilitate pathogen transmission and elevate disease incidence [19] .
The prevalence of bacterial pathogens varied across different aquaculture systems and farm scales, indicating the role of environmental and management factors in microbial distribution [20]. Presumptive E. coli was predominantly found in large-scale cage culture systems, whereas Presumptive Salmonella spp. had a higher prevalence in both large-scale cage and medium-scale pond cultures. A similar study conducted in Malaysia reported E. coli in fish and pond water across tilapia and Asian seabass farms using earthen ponds and floating cages, while Salmonella spp. were detected at lower rates with no clear association to production scale [21]. Furthermore, the detection of Presumptive Aeromonas spp. exclusively in cage systems suggests that the high organic matter accumulation and reduced water exchange in these environments favor its proliferation [22]. This finding aligns with studies from Malaysian and Nigerian aquaculture systems, where earthen ponds showed a low prevalence of bacteria because they benefited from natural filtration processes and reduced microbial stress [23, 24]. However, in the present study, Vibrio spp. was more prevalent in pond culture systems, particularly in medium-scale farms, likely due to stagnant water conditions and higher nutrient loads. The persistence of food safety pathogens like E. coli and Salmonella spp. in aquaculture systems remains a concern, particularly when linked to agricultural runoff, untreated sewage, and interactions with wildlife [25, 26]. Interestingly, Presumptive L. garvieae exhibited a higher prevalence in pond culture systems, with the highest detection rates observed in large-scale farms. However, in previous studies conducted in Zambia, there are no documented cases of Lactococcus infections among pond culture farmers compared to those in cage culture, which may be attributed to the higher stocking densities and elevated water temperatures commonly observed in cage culture systems [14,27].
The antibiotic susceptibility results revealed widespread resistance among bacterial isolates, with distinct patterns between cage and pond culture systems. High resistance was observed against imipenem, ampicillin, co-trimoxazole, cefepime, erythromycin, chloramphenicol, and tetracycline across all production scales. Presumptive Vibrio spp. exhibited higher resistance levels in pond systems—particularly to imipenem and ampicillin in large-scale farms—while cage-cultured isolates were comparatively more susceptible to tetracycline and cefepime. Similar resistance profiles were reported by Haifa-Haryani et al. (2022), who found universal ampicillin resistance among Vibrio isolates from shrimp aquaculture in Malaysia [28]. Presumptive L. garvieae isolates in this study showed complete resistance to all tested antibiotics in cage systems, whereas pond isolates displayed moderate susceptibility to chloramphenicol and ampicillin, consistent with findings by Sezgin et al. (2023) and Xu et al. (2024), who reported multi-drug resistance in L. garvieae from trout and pufferfish but retained sensitivity to chloramphenicol and ampicillin [29, 30]. Presumptive E. coli isolates exhibited 100% resistance to ampicillin across all systems, with partial susceptibility to meropenem and amoxicillin–clavulanic acid in large-scale ponds, aligning with Alu et al. (2021), who found similar resistance patterns in E. coli from fish in Nigeria [31].
The observed AMR in both culture systems may be attributed to environmental and management-related factors as reflected by the antibiotic resistance index, which ranged from 0.04 to 0.48. In pond systems in Zambia, fish farmers frequently use poultry manure as organic fertilizer during pond preparation which can introduce resistant bacteria and residual antibiotics, creating selective pressure for AMR development [32, 33]. Additionally, runoff and wash-off of fecal matter from terrestrial animals such as cattle, goats, and poultry into nearby aquatic systems can introduce resistant enteric bacteria and resistance genes. In cage culture systems, lake water contamination from upstream agricultural and livestock activities may similarly serve as a reservoir for AMR pathogens [14]. These findings underscore the complex interactions between aquaculture practices, environmental contamination, and antimicrobial resistance dissemination in aquatic environments.
The complexity of these external contamination pathways underscores the challenges of managing antibiotic resistance in aquaculture systems. For instance, the interconnected nature of water bodies allows contaminants to spread widely, impacting multiple aquaculture facilities and even communities that rely on these water sources [34]. This is exacerbated by the limited capacity for effective wastewater treatment in many low- and middle-income countries, where effluents are often discharged directly into natural water bodies without adequate processing [35]. Consequently, aquaculture operations in such regions are particularly vulnerable to the infiltration of resistant bacteria and antibiotic residues, even when farmers do not use antibiotics directly [34]. Therefore, understanding these contamination pathways is essential for developing targeted mitigation strategies and ensuring the sustainability of aquaculture practices in Zambia.
The antibiotic residue analysis revealed minimal detection in fish muscle samples, with no residues identified in pond culture systems or most cage culture farms. However, a single detection of penicillin residue in small-scale cage culture raises concerns about indirect exposure pathways. Similar observations were made in Danish and Chilean aquaculture, where residual antibiotics persisted in sediments and water due to feed contamination and effluent discharge [19, 36]. The non-detection of antibiotic residues in fish muscle may support the claim that Zambian farmers do not directly medicate their fish [27]. To achieve minimal to zero antibiotic use in Zambia, strengthening regulatory frameworks and promoting best practices in antibiotic stewardship will be essential to mitigate risks and ensure the safety of farmed fish for consumers.
The findings of this study highlight the critical need for enhanced biosecurity measures, continuous monitoring of water quality, and stringent surveillance of antimicrobial residues in Zambia’s aquaculture industry. The high prevalence of bacterial pathogens, particularly in cage culture systems, underscores the importance of water quality management, stocking density control, and regular health assessments to mitigate disease outbreaks. Moreover, the observed antibiotic resistance patterns call for the implementation of alternative disease management strategies, such as probiotics, vaccines, and improved husbandry practices. Integrating antimicrobial resistance surveillance into routine aquaculture monitoring programs can provide valuable data for guiding policy decisions and promoting sustainable fish farming practices.
This study provides the first integrated assessment of microbial contamination, antibiotic resistance, and antimicrobial residues in market-ready Nile tilapia from Zambia’s major aquaculture production zones. The findings reveal significant variation in bacterial prevalence and resistance patterns across culture systems and production scales, underscoring the influence of farm management and environmental factors on microbial ecology. E. coli, Salmonella spp., Vibrio spp., and L. garvieae were the most frequently isolated bacteria, with E. coli exhibiting 100% resistance to ampicillin across all systems—indicating extensive environmental exposure to β-lactam antibiotics or resistance gene reservoirs. L. garvieae and Vibrio spp. demonstrated high multiple antibiotic resistance (MAR ≥ 0.2), particularly in medium- and large-scale operations, suggesting intensified antimicrobial pressure associated with production intensity and water contamination.
The minimal detection of antibiotic residues—limited to a single penicillin G occurrence in small-scale cage culture—suggests limited direct antibiotic use but highlights the potential for indirect exposure through contaminated feed, poultry manure application, or livestock runoff. Collectively, these findings confirm the presence of multidrug-resistant bacterial populations within aquaculture environments and signal an emerging public health and food safety concern.
Strengthening biosecurity and residue surveillance programs is therefore essential to curb the dissemination of resistant bacteria through the aquatic food chain. Future work should integrate molecular resistance gene profiling and longitudinal surveillance to trace transmission pathways and support the development of science-based policies for sustainable and safe aquaculture in Zambia.
What is already known about the topic
What this study adds
We would like to express our sincere gratitude to the fish farmers in the study areas for their cooperation and support in permitting our team to collect samples from their fish farms, which was crucial for the successful completion of this research. We also extend our heartfelt appreciation to the Food and Agriculture Organization (FAO) Zambia for their financial and logistical support. Additionally, we are grateful for the facilitation provided by the Ministry of Fisheries and Livestock through the Department of Fisheries and the Department of Veterinary Services, whose assistance was essential in ensuring the smooth execution of this study.
KN conceptualized and designed the study, coordinated sample collection, performed data analysis, and drafted the manuscript. GM contributed to the study design, facilitated fieldwork, and assisted with manuscript writing. CC, MS1, GN, HK, LM, and EK handled field data collection and sample processing. KN, GM, CM, and MC provided technical support and contributed to result interpretation. CM assisted with data management and coordination. KC, NMM, MMS and TK provided input and reviewed the manuscript, while JBM assisted with statistical analysis. BMH supervised the study and reviewed the manuscript. All authors approved the final manuscript.
| Production Scale | Number of Farms | Fish Samples Collected | |||
|---|---|---|---|---|---|
| Siavonga | Kafue | Kafue | Siavonga | Total | |
| Large Scale Commercial | 2 | 3 | 15 | 25 | 40 |
| Medium Scale Commercial | 1 | 1 | 20 | 20 | 40 |
| Small Scale Commercial | 2 | 2 | 20 | 18 | 38 |
| Total Collected | 5 | 6 | 55 | 63 | 118 |
| Production capacity | Cage culture (n = 63), n (%) | Total (N = 118), n (%) | p-value | |
|---|---|---|---|---|
| Kafue | Siavonga | |||
| Presumptive Escherichia coli | ||||
| Large-scale commercial | 6 (50.0) | 2 (33.3) | 8 (44.4) | 0.76 |
| Medium-scale commercial | 5 (41.7) | 3 (50.0) | 8 (44.4) | |
| Small-scale commercial | 1 (8.3) | 1 (16.7) | 2 (11.2) | |
| Total positive isolates | 12 (100.0) | 6 (100.0) | 18 (100.0) | |
| Presumptive Salmonella spp. | ||||
| Large-scale commercial | 12 (63.2) | 9 (39.1) | 21 (50.0) | 0.3 |
| Medium-scale commercial | 5 (26.3) | 10 (43.5) | 15 (35.7) | |
| Small-scale commercial | 2 (10.5) | 4 (17.4) | 6 (14.3) | |
| Total positive isolates | 19 (100.0) | 23 (100.0) | 42 (100.0) | |
| Presumptive Aeromonas spp. | ||||
| Large-scale commercial | 1 (25.0) | 0 (0.0) | 1 (25.0) | NaNa |
| Medium-scale commercial | 3 (75.0) | 0 (0.0) | 3 (75.0) | |
| Small-scale commercial | 0 (0.0) | 0 (0.0) | 0 (0.0) | |
| Total positive isolates | 4 (100.0) | 0 (0.0) | 4 (100.0) | |
| Presumptive Vibrio spp. | ||||
| Large-scale commercial | 12 (100.0) | 15 (34.1) | 27 (48.2) | <0.001 |
| Medium-scale commercial | 0 (0.0) | 20 (45.5) | 20 (35.7) | |
| Small-scale commercial | 0 (0.0) | 9 (20.5) | 9 (16.1) | |
| Total positive isolates | 12 (100.0) | 44 (100.0) | 56 (100.0) | |
| Presumptive Lactococcus garvieae | ||||
| Large-scale commercial | 2 (11.1) | 12 (46.2) | 14 (31.8) | 0.016 |
| Medium-scale commercial | 10 (55.6) | 5 (19.2) | 15 (34.1) | |
| Small-scale commercial | 6 (33.3) | 9 (34.6) | 15 (34.1) | |
| Total positive isolates | 18 (100.0) | 26 (100.0) | 44 (100.0) | |
| Presumptive Streptococcus spp. | ||||
| Large-scale commercial | 0 (0.0) | 1 (25.0) | 1 (25.0) | NaNa |
| Medium-scale commercial | 0 (0.0) | 3 (75.0) | 3 (75.0) | |
| Small-scale commercial | 0 (0.0) | 0 (0.0) | 0 (0.0) | |
| Total positive isolates | 0 (0.0) | 4 (100.0) | 4 (100.0) | |
NaNa = could not be calculated – At least one row or column contains all zeros
| Pathogen | Pond Culture | Cage Culture | ||||
|---|---|---|---|---|---|---|
| Large Scale Commercial | Medium Scale Commercial | Small Scale Commercial | Large Scale Commercial | Medium Scale Commercial | Small Scale Commercial | |
| Presumptive Escherichia coli | 0.06 | 0.12 | 0.13 | 0.19 | 0.07 | 0.05 |
| Presumptive Lactococcus garvieae | 0.26 | 0.16 | 0.04 | 0.20 | 0.48 | 0.20 |
| Presumptive Vibrio spp | 0.05 | 0.27 | 0.14 | 0.32 | 0.08 | 0.10 |
| Production Scale | Antibiotic residues in fish muscle (µg/kg) | |||||||||
|---|---|---|---|---|---|---|---|---|---|---|
| Sulfamethoxazole | Trimethoprim | Penicillin G | Ampicillin | Tetracycline | Oxytetracycline | Gentamicin | Tiamulin | Erythromycin | Tylosin | |
| Pond Culture | ||||||||||
| Large Scale | <0.1* | <0.05* | <0.7* | <0.07* | <15* | <15* | <10* | <0.1* | <0.1* | <0.4* |
| Large Scale | <0.1* | <0.05* | <0.7* | <0.07* | <15* | <15* | <10* | <0.1* | <0.1* | <0.4* |
| Large Scale | <0.1* | <0.05* | <0.7* | <0.07* | <15* | <15* | <10* | <0.1* | <0.1* | <0.4* |
| Medium Scale | <0.1* | <0.05* | <0.7* | <0.07* | <15* | <15* | <10* | <0.1* | <0.1* | <0.4* |
| Medium Scale | <0.1* | <0.05* | <0.7* | <0.07* | <15* | <15* | <10* | <0.1* | <0.1* | <0.4* |
| Medium Scale | <0.1* | <0.05* | <0.7* | <0.07* | <15* | <15* | <10* | <0.1* | <0.1* | <0.4* |
| Small Scale | <0.1* | <0.05* | <0.7* | <0.07* | <15* | <15* | <10* | <0.1* | <0.1* | <0.4* |
| Small Scale | <0.1* | <0.05* | <0.7* | <0.07* | <15* | <15* | <10* | <0.1* | <0.1* | <0.4* |
| Small Scale | <0.1* | <0.05* | <0.7* | <0.07* | <15* | <15* | <10* | <0.1* | <0.1* | <0.4* |
| Small Scale | <0.1* | <0.05* | <0.7* | <0.07* | <15* | <15* | <10* | <0.1* | <0.1* | <0.4* |
| Cage Culture | ||||||||||
| Large Scale | <0.1* | <0.05* | <0.7* | <0.07* | <15* | <15* | <10* | <0.1* | <0.1* | <0.4* |
| Large Scale | <0.1* | <0.05* | <0.7* | <0.07* | <15* | <15* | <10* | <0.1* | <0.1* | <0.4* |
| Large Scale | <0.1* | <0.05* | <0.7* | <0.07* | <15* | <15* | <10* | <0.1* | <0.1* | <0.4* |
| Large Scale | <0.1* | <0.05* | <0.7* | <0.07* | <15* | <15* | <10* | <0.1* | <0.1* | <0.4* |
| Large Scale | <0.1* | <0.05* | <0.7* | <0.07* | <15* | <15* | <10* | <0.1* | <0.1* | <0.4* |
| Medium Scale | <0.1* | <0.05* | <0.7* | <0.07* | <15* | <15* | <10* | <0.1* | <0.1* | <0.4* |
| Medium Scale | <0.1* | <0.05* | <0.7* | <0.07* | <15* | <15* | <10* | <0.1* | <0.1* | <0.4* |
| Small Scale | <0.1* | <0.05* | <0.7* | <0.07* | <15* | <15* | <10* | <0.1* | <0.1* | <0.4* |
| Small Scale | <0.1* | <0.05* | Detected | <0.07* | <15* | <15* | <10* | <0.1* | <0.1* | <0.4* |