Research | Open Access | Volume 9 (2): Article 60 | Published: 13 Apr 2026
Views: 2,271
Menu, Tables and Figures
| SN | Source | Data | Use | Format |
|---|---|---|---|---|
| 1 | TerraClimate | Rainfall | Analyzing temporal trends | NetCDF, CSV |
| Temperature | ||||
| 2 | Ministry of Health | Malaria incidence | Analyzing trends of malaria incidence | CSV |
Table 1: Summarize Datasets and Sources.
| Metric | Value |
|---|---|
| Pearson Correlation (r) | 0.91 |
| R-squared (R²) | 0.83 |
| RMSE (mm) | 128.21 |
| MAE (mm) | 122.88 |
Table 2 : Statistical Validation of TerraClimate Rainfall Estimates Against Ground Observations (2020–2023)
| Method | Temperature | Rainfall | Malaria |
|---|---|---|---|
| Linear Regression | P-value = 0.260 Slope = 0.022 R-squared = 17.7% | P-value = 0.480 Slope = 1.566 R-squared = 7.4% | P-value = 0.00003 Slope = -5.299 R-squared = 92.7% |
| Kendall Test | P-value = 0.295 Tau = 0.31 | P-value = 0.348 Tau = 0.278 | P-value = 0.00026 Tau = -1 |
| Sen’s Slope | P-value = 0.295 Slope = 0.015 | P-value = 0.348 Slope = 2.595 | P-value = 0.00026 Slope = -4.779 |
Table 3 : Summary of Trend Analysis Results for Temperature, Rainfall, and Malaria Incidence (2015–2023)
| District | Mean_Gi_Z | P-value |
|---|---|---|
| Temeke MC | -0.838 | 0.460 |
| Kinondoni MC | -0.752 | 0.461 |
| Ilala MC | -0.578 | 0.477 |
| Ubungo MC | -0.519 | 0.631 |
| Kigamboni MC | -0.018 | 0.725 |
| District | Mean_Gi_Z | Mean_P_value |
|---|---|---|
| Kigamboni MC | -0.948 | 0.361 |
| Ubungo MC | 0.778 | 0.445 |
| Temeke MC | -0.460 | 0.596 |
| Kinondoni MC | -0.171 | 0.672 |
| Ilala MC | -0.376 | 0.711 |
Table 5: Statistical Result of Temperature Hotspot Analysis in Each District in Dar es Salaam (2015–2023)
| District | Mean_Gi_Z | P-value |
|---|---|---|
| Kigamboni MC | 1.471 | 0.147 |
| Ilala MC | 1.331 | 0.186 |
| Temeke MC | -0.305 | 0.718 |
| Kinondoni MC | 0.196 | 0.804 |
| Ubungo MC | 0.215 | 0.813 |
Table 6: Statistical Result of Malaria Hotspot Analysis in Each District in Dar es Salaam (2015–2023)
| Parameter | Malaria vs. Temperature | Malaria vs. Rainfall |
|---|---|---|
| Regression Equation | y = -31.95x + 884.72 | y = -0.348x + 64.02 |
| Regression Coefficient (Slope) | -31.95 | -0.348 |
| R-squared (R²) | 9.2% | 13.4% |
| P-value (Regression) | 0.427 | 0.334 |
| Pearson Correlation (r) | -0.304 | -0.365 |
| P-value (Correlation) | 0.427 | 0.334 |
| Correlation Strength | Weak Negative | Moderate Negative |
Table 7: Summary of Key Statistical Indicators for the Relationship Between Malaria Incidence and Climate Variables (2015–2023)


Edgar Fulgence Temu1,&, Dorothea Deus1
1Department of Geospatial Sciences and Technology, School of Earth Sciences, Real Estates, Business studies and Informatics, Ardhi University, P. O. Box 35176, Dar es Salaam, Tanzania
&Corresponding author: Edgar Fulgence Temu, Department of Geospatial Sciences and Technology, School of Earth Sciences, Real Estates, Business studies and Informatics, Ardhi University, P. O. Box 35176, Dar es Salaam, Tanzania, Email: edmoal.f.temu@gmail.com
Received: 11 Oct 2025, Accepted: 10 Apr 2026, Published: 13 Apr 2026
Domain: Malaria and Climate Change
Keywords: Malaria, climate change, urban health, GIS and remote sensing
©Edgar Fulgence Temu et al. Journal of Interventional Epidemiology and Public Health (ISSN: 2664-2824). This is an Open Access article distributed under the terms of the Creative Commons Attribution International 4.0 License (https://creativecommons.org/licenses/by/4.0/), which permits unrestricted use, distribution, and reproduction in any medium, provided the original work is properly cited.
Cite this article: Edgar Fulgence Temu et al., Spatiotemporal analysis of malaria declines in an urban African setting: Limited association with climate variability in Dar es Salaam. Journal of Interventional Epidemiology and Public Health. 2026; 9(2):60. https://doi.org/10.37432/jieph-d-25-00229
Introduction: Urban malaria continues to be a significant public health problem in rapidly developing cities such as Dar es Salaam, where climate variation interacts with urban socio-environmental factors. It is crucial to understand these dynamics for efficient disease control measures.
Methods: Using geospatial methods, this study looked at how changes in climate affected the number of malaria cases in the Dar es Salaam Region from 2015 to 2023, utilising climate data from the TerraClimate geoportal and malaria incidence data from the Ministry of Health. Mann-Kendall trend test, Sen’s slope estimator, Getis-Ord Gi* hotspot analysis, Pearson correlation, and regression models were employed in the study. Remote sensing and GIS software were used to examine spatial-temporal trends and malaria hotspots.
Results: Validation of satellite rainfall data with ground-based data showed high agreement (r = 0.80, R² = 0.64). There were statistically insignificant rising trends in temperature and rainfall. Ubungo had temperature hotspots that were consistent, while Temeke and Ilala had cold spots that were consistent. Malaria cases decreased by more than 70%, with a strong monotonic decreasing trend (p < 0.001), and Ilala and Kigamboni were found to be consistent hotspots.
Conclusion: The results show that non-climatic factors, like city infrastructure and public health measures, are becoming more important in how malaria spreads in Dar es Salaam. Geospatial tools can help us figure out where to focus our malaria control policies.
Malaria is a life-threatening vector-borne disease caused by Plasmodium parasites transmitted to humans through the bites of infected female Anopheles mosquitoes [1, 2]. Malaria originated and remains highly prevalent in tropical and subtropical regions like Dar es Salaam, where environmental conditions are conducive to vector survival and parasite development. The persistence of malaria remains influenced by a complex interaction of climatic and non-climatic factors. Climate variability, including changes in temperature and rainfall patterns, can alter mosquito breeding habitats and parasite development rates[3, 4]. At the same time, non-climatic factors, including urban land-use dynamics, housing quality, water and sanitation infrastructure, socio-economic conditions, population mobility, and the effectiveness of public health interventions, play a critical role in determining malaria transmission patterns, especially in urban settings. If left untreated, malaria can lead to severe illness and death, particularly among pregnant women and young children [5]. Malaria control strategies such as insecticide-treated mosquito nets (ITNs), indoor residual spraying (IRS), and effective antimalarial treatment have contributed to significant reductions in disease burden over recent decades [6, 7].
In recent years, global malaria cases have remained high, with over 263 million cases and approximately 597,000 deaths reported in 2023 [8]. Africa continues to account for more than 90% of the global malaria burden [9]. Tanzania is classified by the World Health Organization as a high-burden, high-impact country, contributing significantly to malaria cases in the region [10]. Although national malaria prevalence has declined over the past decade [11], urban centres such as Dar es Salaam continue to face challenges associated with rapid population growth, informal settlement expansion, inadequate drainage systems, and uneven access to vector control interventions.
In Dar es Salaam, densely populated neighbourhoods, coupled with stagnant water, poor sanitation, and rapid infrastructure development, create favourable conditions for mosquito breeding and human vector contact [12, 13]. The interaction between ongoing urbanisation and variable climatic conditions further complicates malaria control efforts, highlighting the need for spatially targeted interventions [14].
The individual effects of climate variability on urban malaria transmission are inadequately documented, which constrains the design of location-specific control measures [10,15]. This study aims to address this gap by assessing the spatio-temporal relationship between climate variability and malaria incidence in Dar es Salaam using geospatial and statistical techniques.
Specifically, this study analysed the temporal trends in climate variables (temperature and rainfall) and malaria incidence from 2015–2023, assessed the spatial patterns and hotspots of climate conditions and malaria incidence across the municipal councils of Dar es Salaam, and evaluated the relationship between climate variability and malaria incidence using correlation and regression analysis. This research contributes directly to the Sustainable Development Goals (SDGs). It aligns with SDG 3 (Good Health and Well-Being), particularly Target 3.3, which seeks to end the malaria epidemic. In addition, the application of geospatial hotspot analysis supports SDG 3 to ensure good health and well-being, while SDG 13 for climate action. To enable evidence-based identification of high-risk areas and guide the efficient allocation of public health and urban management resources to create safer, more resilient cities.
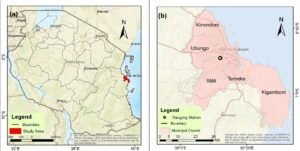
Study area
Dar es Salaam, Tanzania’s largest and busiest city, lies on the shores of the Indian Ocean (Figure 1). The city is becoming one of Africa’s fastest-expanding urban centres [16]. Dar es Salaam lies between latitudes 6°36′ and 7°00′ South and longitudes 39°00′ and 39°33′ East [17]. It is bordered by the Indian Ocean to the east and encircled by coastal lowlands and wetlands [18]. The city’s land area is approximately 1,393 square kilometres [19]. The city is divided into five districts: Kinondoni, Ilala, Temeke, Ubungo, and Kigamboni, with each having its own mix of residential, commercial, and industrial areas [20]. It has a tropical climate with hot temperatures ranging from 25°C to 32°C and high humidity throughout the year [21]. Rainfall is seasonal, with heavier rains from March to May and lighter rains from October to December [17]. Malaria is a health concern in Dar es Salaam, fueled by its climate variability impact and urban challenges [22]. As the city continues to grow and weather patterns shift due to climate variability, understanding how these factors contribute to malaria is critical [23]. Dar es Salaam provides a unique setting to explore the links between climate variability impact and Malaria, with lessons that could apply to other cities facing similar issues [24].
Dataset
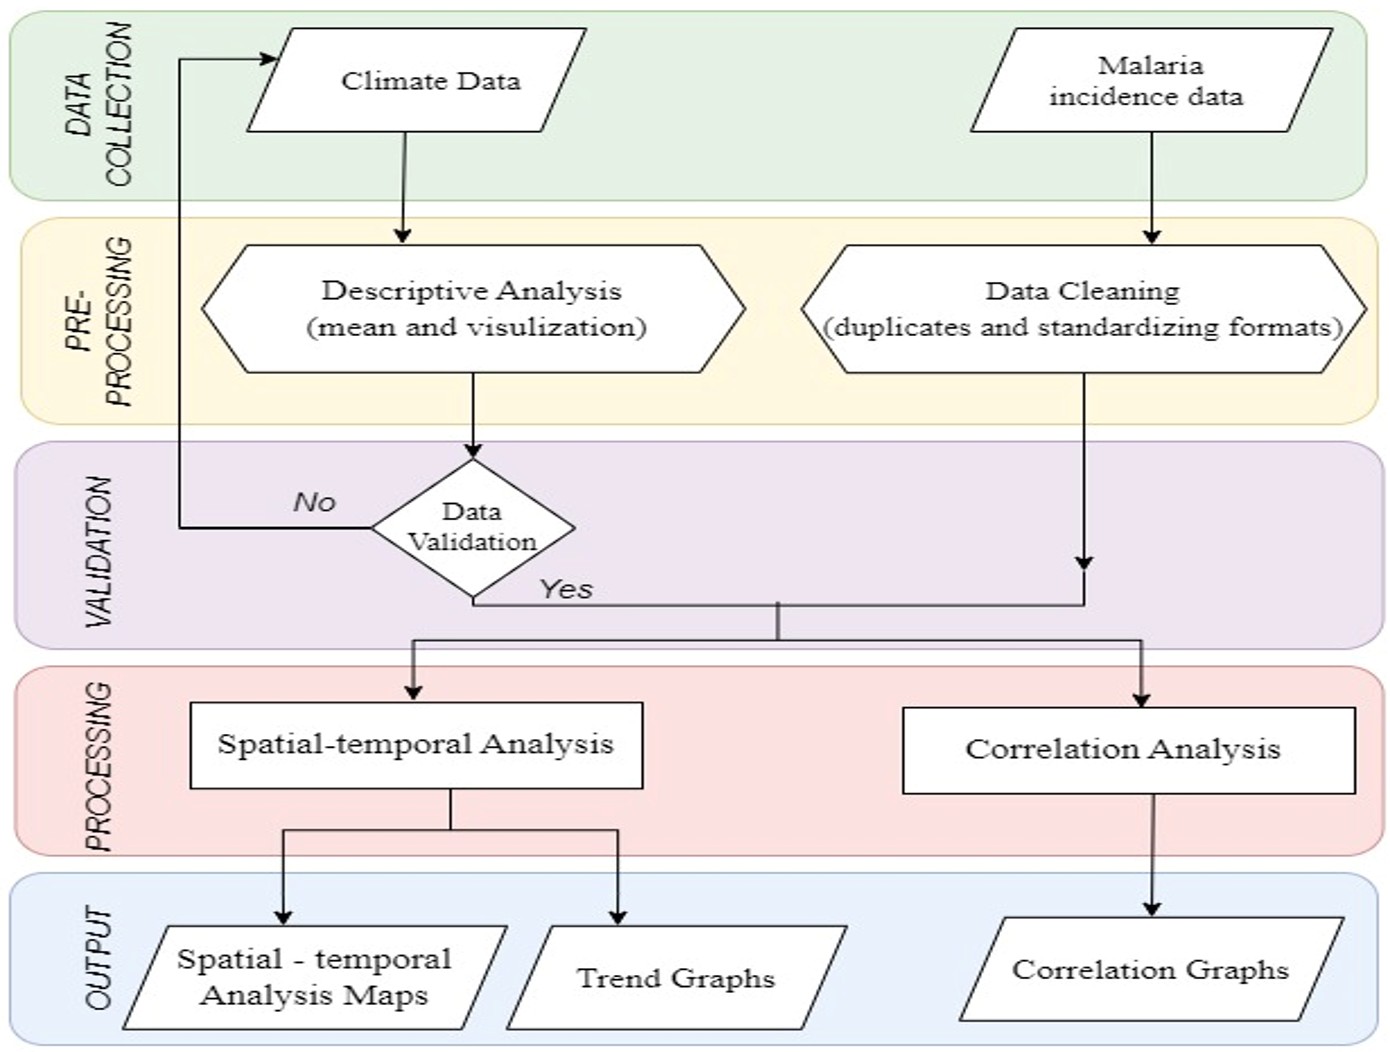
Records of malaria incidence and climate were compiled for the period 2015–2023. Climate variables were obtained from the TerraClimate dataset, which provides high-resolution (~4 km, ~1/24°) monthly gridded climate data suitable for regional trend analysis. Monthly NetCDF files were converted into CSV format for analysis. TerraClimate was selected because of its temporal consistency, spatial precision, and suitability for regional climate variability assessments. In this study, two primary variables known to influence malaria transmission, mean annual air temperature (°C) and total annual precipitation (mm), were extracted. Monthly TerraClimate layers were aggregated into annual values (mean for temperature; sum for rainfall) and then summarised for each municipality using zonal statistics, after which they were exported for statistical analysis in RStudio and spatial processing in GIS software. Climate data summaries are presented in Table 1.
Annual malaria cases data (confirmed, notified cases) for each municipality were obtained from the DHIS2 platform at the facility level, showing the number of cases for the period 2015–2023. The dataset underwent cleaning procedures, including harmonising municipality names, removing duplicate entries, checking completeness, and converting all files to CSV format to ensure compatibility with climate data. After cleaning, malaria and climate datasets were merged by year and municipality to create the analytical dataset used in trend, correlation, regression, and hotspot analyses. Validation of TerraClimate rainfall against ground rainfall observations (2020–2023) is summarised in Table 2, supporting the reliability of this dataset for local climate analysis. A visual summary of the methodological steps is provided in Figure 2.
Descriptive analysis
Both climate and malaria incidence datasets underwent descriptive analysis during pre-processing. Measures of central tendency, specifically the mean, were used to summarize each variable. The mean was computed using equation (1) [25]:
Where:
\( \bar{X} \) is Mean
\( \sum X_i \) is Summation of data values
\( n \) is Number of observations.
Correlation analysis
Correlation analysis was used to explore the linear relationship between climate variables and malaria incidence. The Pearson correlation coefficient quantified the strength and direction of these relationships for each climate parameter (temperature and rainfall). Pearson’s ranges from −1 to +1, with values near ±1 indicating strong linear relationships and values near 0 indicating weak or no linear association. Pearson’s coefficient was computed using equation (2) [26].
Where:
“\( X_i \)” is climate variable (e.g., temperature, rainfall)
“\( Y_i \)” is Malaria cases
“\( \bar{X} \)” is Mean of climate variable
“\( \bar{Y} \)” is Mean of malaria cases
“\( \sum \)” is Summation over all data points
“\( r \)” is Pearson Correlation Coefficient
Temporal trend
Trend analysis was performed during the data processing step to look for long-term trends between the occurrence of malaria and climatic patterns like rainfall and temperature. Both linear regression, Mann-Kendall and Sen’s Estimator were utilized to check whether parameters show an increasing or decreasing pattern over the years (equations 3-5) [27, 28] . The positive slope (m) represents a rising trend and the negative a falling trend. This helps determine the nature of the relationship between malaria incidence and climatic variability.
\[ y = mx + c \quad \text{(3)} \]
Where:
\( y \) is a dependent variable,
\( x \) is an independent variable
\( m \) represents the slope of the regression line
\( c \) represents the y-intercept.
In these regression models, the dependent variable was the annual number of reported malaria cases, while the independent variables were the mean annual temperature, total annual rainfall, and time. The time variable (x) was coded as 0 for 2015, 1 for 2016, up to 8 for 2023 to represent the number of years since the baseline year.
Mann-Kendall and Sen’s Estimator
The Mann-Kendall test was employed with Sen’s Slope Estimator to identify temporal trends in climate variables and malaria occurrence. The Mann-Kendall test is a standard non-parametric statistical test that detects the presence of monotonic trends in time series data without requiring normality of data. It is particularly suitable for environmental and epidemiological data because it is insensitive to outliers and missing values. After detecting a significant trend, as shown in equation 5 [29], the magnitude of the trend is estimated through Sen’s Slope Estimator
\[ S = \sum_{i=1}^{n-1} \sum_{j=i+1}^{n} \operatorname{sgn}(x_j – x_i) \quad (4) \]
Where:
\[
\operatorname{sgn}(x_j – x_i) =
\begin{cases}
+1 & \text{if } x_j – x_i > 0 \\
0 & \text{if } x_j – x_i = 0 \\
-1 & \text{if } x_j – x_i < 0
\end{cases}
\]
\( x_j – x_i \) is data value at time \( i \) and \( j \)
\( n \) is the number of observations
This estimator provides an estimate of the median of all the possible pairwise slopes and offers a robust estimate of the rate of change over time, as shown in equation 5 Click or tap here to enter text.[30, 31]. Together, these methods provide an integrated framework to detect and quantify trends in climatic variables (rainfall and temperature) and malaria cases, thus allowing for evidence-based inferences regarding the effects of climate variability in the study area.
\[ Q = median\left( \frac{x_j – x_i}{j – i} \right), \quad \text{for all } i < j \quad (5) \]
Where:
(x_j – x_i\) are data values at time j and i, respectively
(j – i\) is the time interval between the observations
Q is the Sen’s Slope, representing the median rate of change of time
Hot spot analysis
The Getis-Ord Gi* statistic was utilized to examine the spatial clustering of both malaria prevalence and climate variability. The method identifies statistically significant clusters by assessing whether high or low values are spatially concentrated. The interpretation of these spatial clusters is based on the Gi* statistic, which produces a z-score calculated as shown in equation 6 [32, 33]. It was employed in this study to obtain hot spots and cold spots of malaria prevalence and climate variables (temperature and rainfall) across different districts in Dar es Salaam.
Spatial weights generated using a K-Nearest Neighbour (KNN) conceptualisation with K = 5. This ensures consistent hotspot detection across municipalities.
\[ G_i^* = \frac{ \sum_{j=1}^{n} w_{i,j} x_j – \bar{X} \sum_{j=1}^{n} w_{i,j} }{ s \sqrt{ \frac{ n \sum_{j=1}^{n} w_{i,j}^2 – \left( \sum_{j=1}^{n} w_{i,j} \right)^2 }{ n-1 } } } \quad (6) \]
Where:
\( x_j \) is attribute value at location j
\( w_{i,j} \) is the spatial weight between features i and j
\( n \) is the total number of features
\( \bar{X} \) is the mean of the attribute values
\( s \) is the standard deviation of the attribute values
Ethical considerations
This study utilized aggregated malaria surveillance data obtained from the Ministry of Health under official permission. The dataset contained no personal identifiers, and all analyses were conducted at the municipal level. In accordance with national policies, secondary analysis of anonymised routine surveillance data does not require individual informed consent.
Validation of TerraClimate Satellite Rainfall Data (2020–2023)
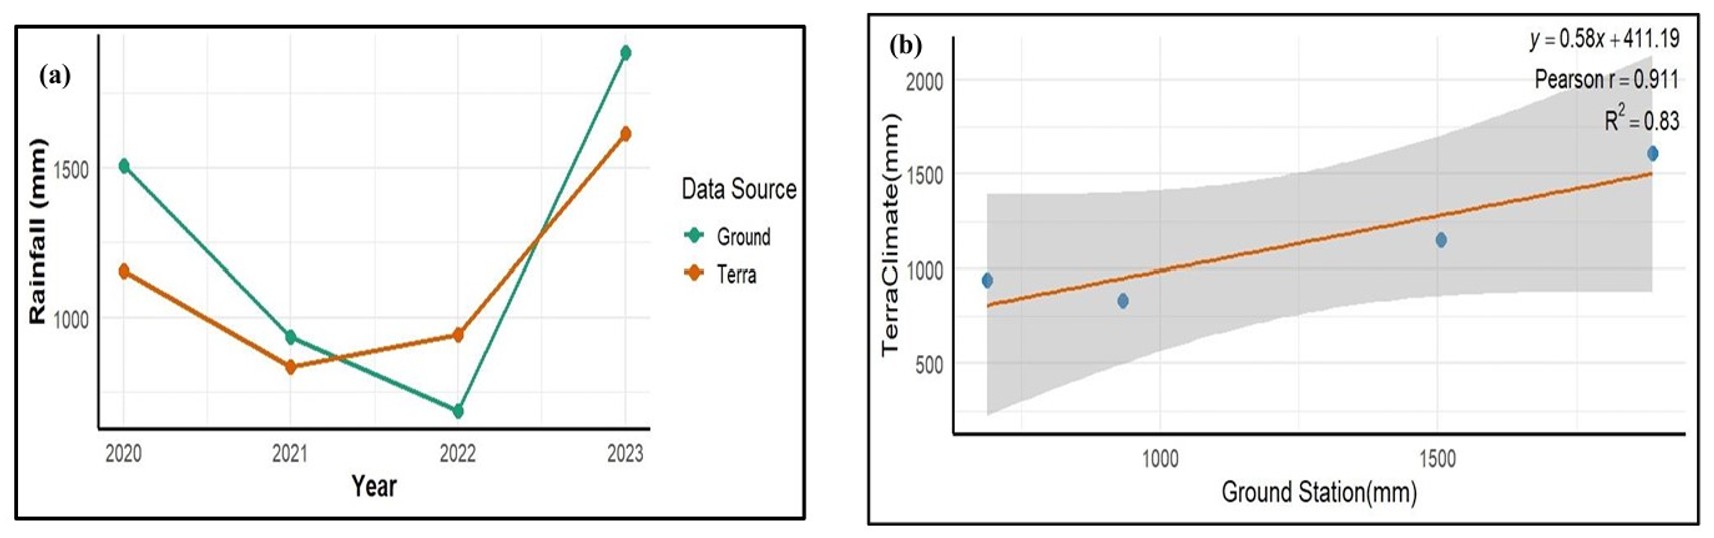
This section presents the validation of annual TerraClimate rainfall estimates against ground-based gauge observations in Dar es Salaam from 2020 to 2023. A very strong, statistically significant positive correlation was observed between the two datasets, with a Pearson correlation coefficient of r = 0.91 and a regression equation of y = 0.58x + 411.19. The coefficient of determination (R² = 0.83) indicates that 83% of the variability in satellite-derived rainfall corresponds to that measured at ground stations, demonstrating strong agreement.
Error statistics show a Root Mean Square Error (RMSE) of 128.21 mm and a Mean Absolute Error (MAE) of 122.88 mm, suggesting moderate deviations between the two rainfall records. These validation outputs confirm that TerraClimate data are reliable for regional climate variability assessment in Dar es Salaam, especially for trend analysis. A summary of the statistical results is provided in Table 2. Year-to-year variations in annual rainfall between TerraClimate and gauge data are compared in Figure 3(a), while Figure 3(b) visualizes the correlation strength and linear relationship between the two datasets.
Trend analysis
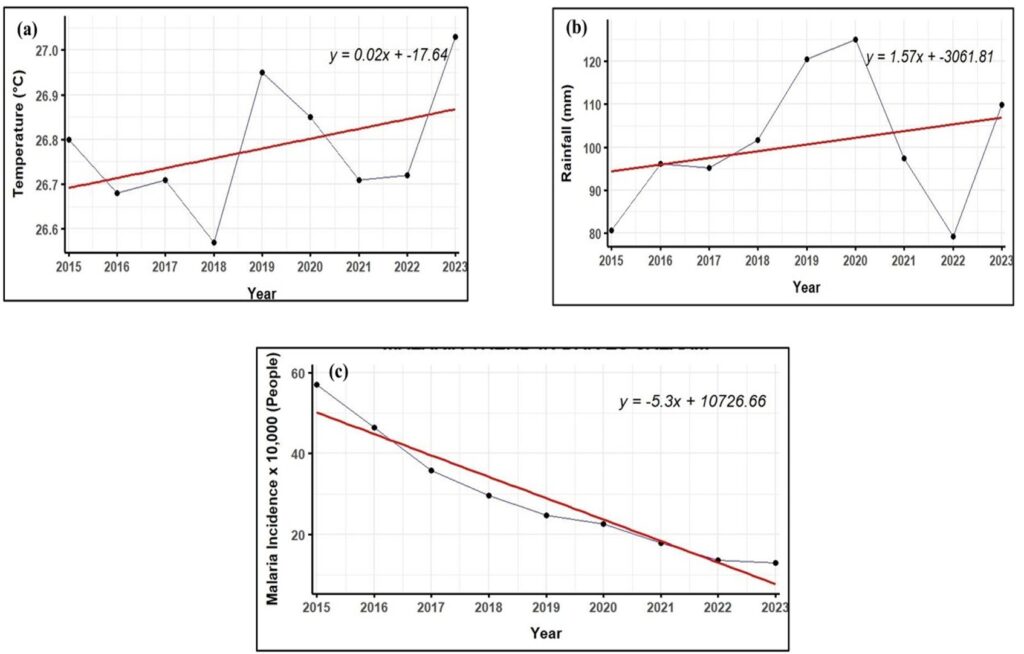
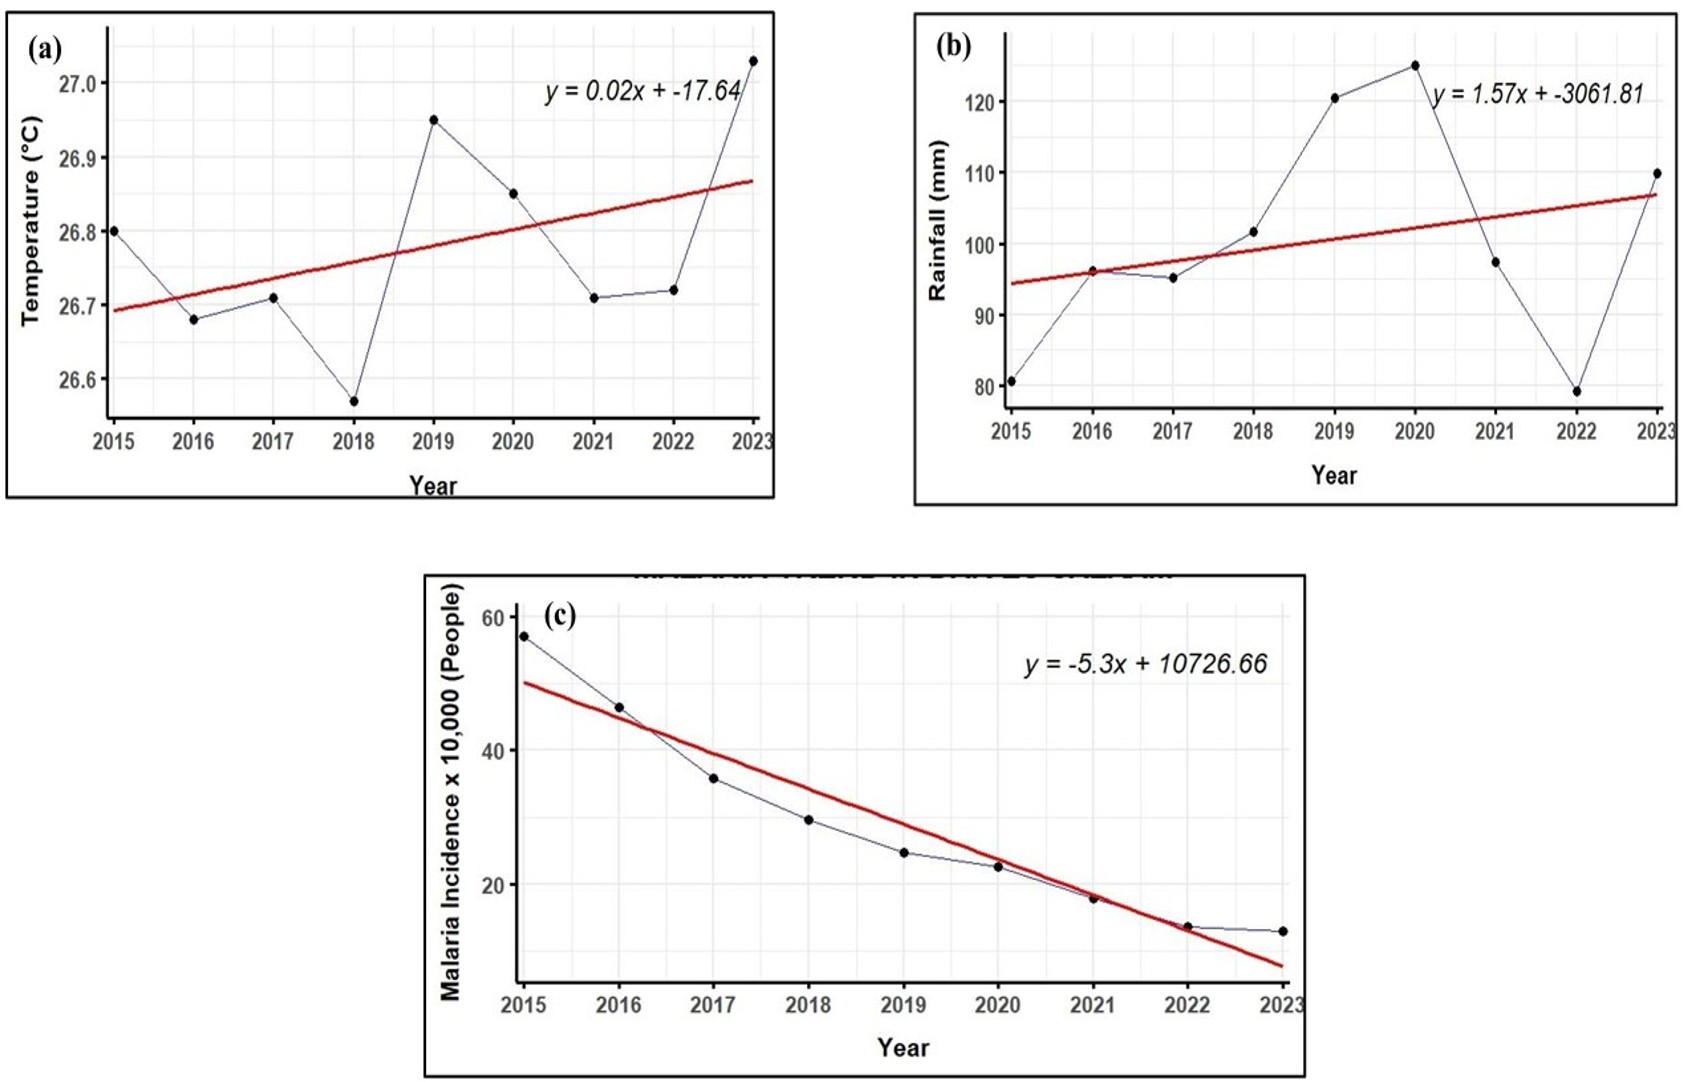
This section presents the temporal trends of annual climate variables (temperature and rainfall) and malaria incidence from 2015 to 2023. The analysis used both linear regression and nonparametric tests to determine whether statistically significant changes occurred over time. A summary of all trend results is provided in Table 3.
Trend in climate variables
Temperature trends in Dar es Salaam from 2015 to 2023 were assessed using both linear regression and the Mann–Kendall test (Figure 4a). Linear regression produced the equation y = 0.022x − 17.638, indicating a very small positive slope of 0.022°C per year, equivalent to an increase of only 0.18°C over nine years. However, the low R² value of 0.177 suggests that less than 18% of temperature variation is explained by time. The p-value of 0.260 confirms that this trend is not statistically significant.
The Mann–Kendall test supported these findings, yielding tau = 0.31 and p-value = 0.295, indicating no significant monotonic trend. Sen’s slope estimator returned a rate of 0.015°C/year with a 95% confidence interval: −0.055 to 0.053°C, reinforcing that the observed warming signal is extremely weak and not statistically meaningful. Overall, temperature remained relatively stable over the study period.
Rainfall exhibited high inter-annual variability but no significant long-term change (Figure 4b). Linear regression produced y = 1.566x − 3061.807, representing a minimal positive slope of 1.566 mm/year. The very low R² value of 0.0736 implies that time explains less than 8% of rainfall variation, and the p-value of 0.480 confirms that the trend is not statistically significant.
The Mann–Kendall test produced tau = 0.278 and p-value = 0.348, while Sen’s slope returned 2.595 mm/year with a 95% confidence interval: −2.83 to 8.13 mm, further confirming no significant increase or decrease in rainfall over the study period. Although some years experienced higher rainfall totals, these fluctuations do not constitute a meaningful climatic trend.
Trend in malaria cases
Malaria incidence in Dar es Salaam experienced a substantial decline over the period 2015–2023 (Figure 4(c)). Reported annual cases dropped from more than 55,000 in 2015 to fewer than 15,000 in 2023, representing a reduction of over 70% in notified cases. The linear regression analysis yielded y = -53,000x + 10,726.66, indicating a strong downward trend equivalent to an average annual decrease of approximately 53,000 cases.
The regression model produced an R² value of 0.927, meaning that more than 92% of the variability in malaria occurrence is explained by year, demonstrating an excellent model fit. The p-value < 0.001 (p = 0.00003) confirms that the decline is highly statistically significant. Consistent with this, the Mann-Kendall test returned tau = -1.00 with p = 0.00026, indicating a strong and perfectly consistent monotonic downward trend. Sen’s slope estimated a median rate of change of -47,800 cases per year (p = 0.00026), reinforcing the robustness and magnitude of the decline observed. These results collectively demonstrate a dramatic and statistically significant reduction in malaria incidence, strongly suggesting the influence of non-climatic public health interventions and urban development improvements during the study period.
Hotspot analysis
Climate variables
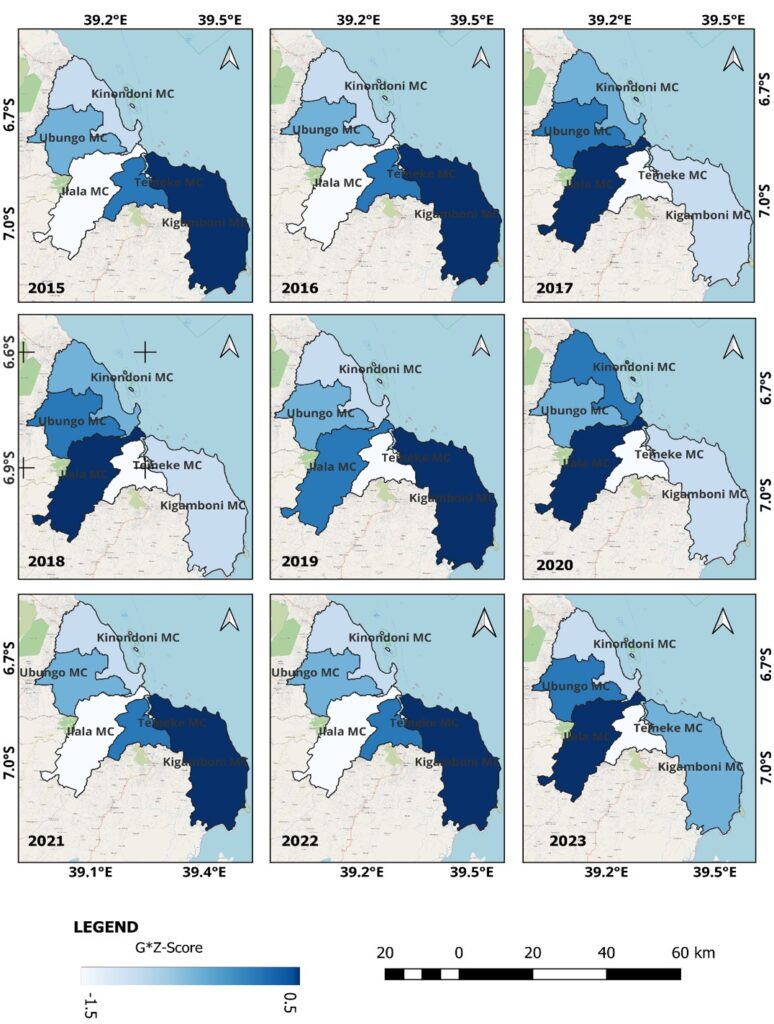
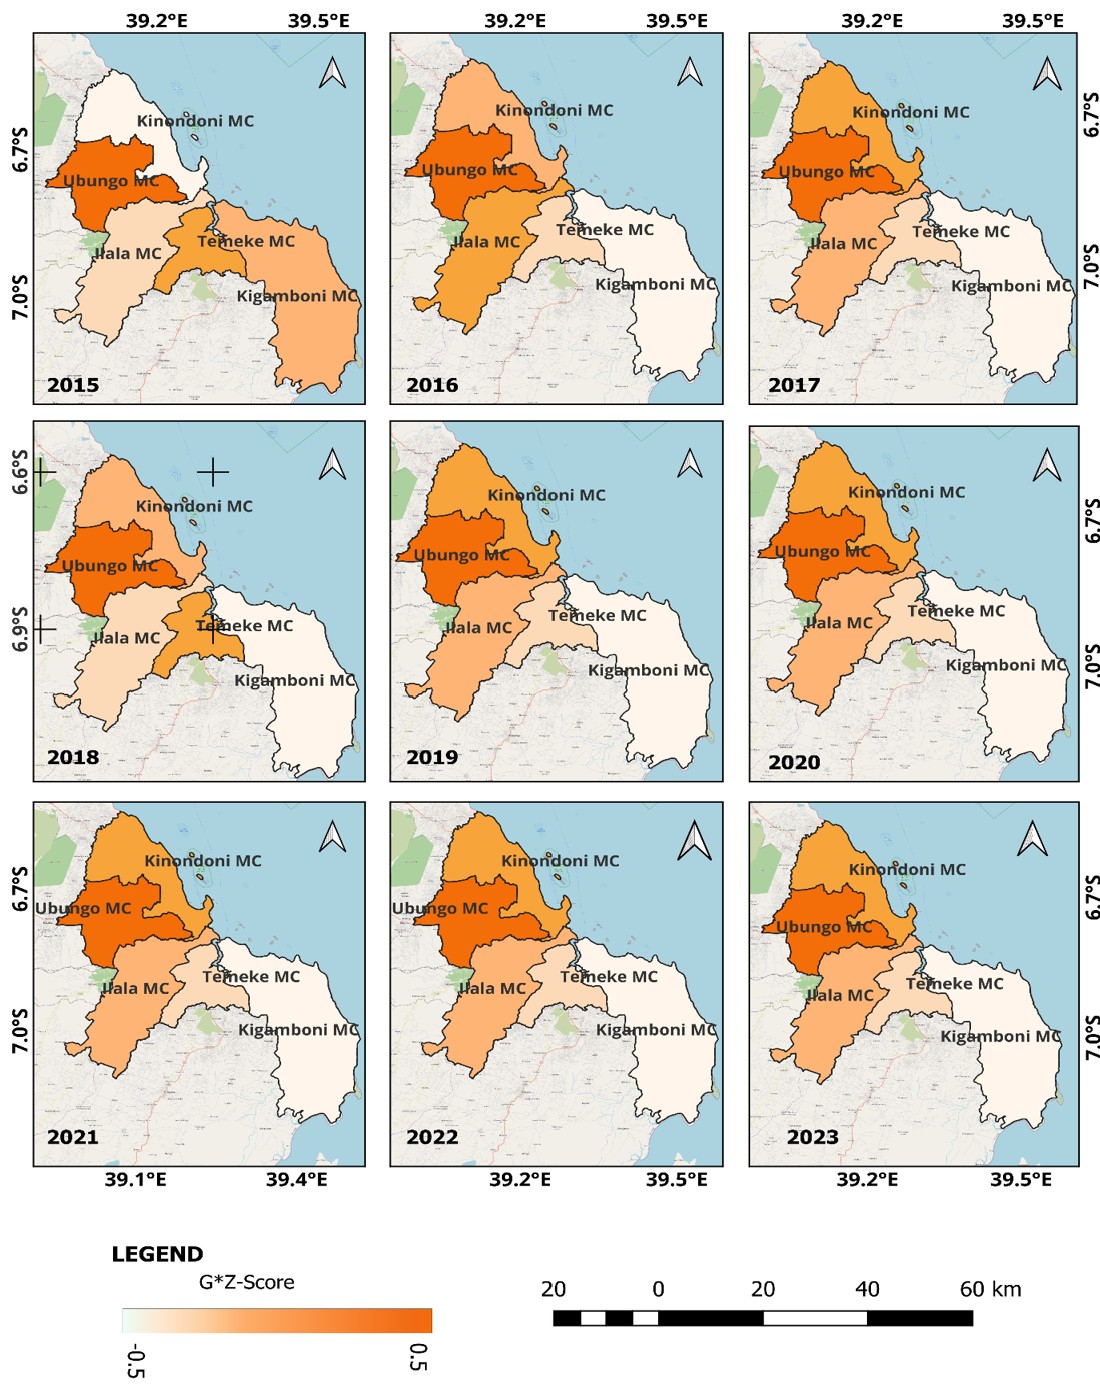
Rainfall hotspot analysis using the Getis-Ord Gi* Z-score method for 2015-2023 (Figure 5) revealed spatial variability in rainfall clustering across Dar es Salaam. Ilala MC and Temeke MC consistently appeared as cold-spot areas, indicating that rainfall was relatively lower and less spatially concentrated within these municipalities compared to others. This pattern is supported by their negative mean Gi* Z-scores of -0.838 and -0.578, respectively (Table 4). These districts are characterised by highly urbanised surfaces and drainage systems that likely reduce water accumulation, which may explain their recurrent rainfall cold-spot behaviour.
Kigamboni MC exhibited mostly neutral spatial clustering with occasional weak hotspot years, reflecting its coastal location with mixed settlement development and variability in localised rainfall systems. Northern municipalities such as Ubungo MC and Kinondoni MC demonstrated irregular and shifting clustering patterns, alternating between weak cold spots and near-random distributions. This further supports the finding of high inter-annual rainfall variability without a strong spatially dominant cluster.
Figure 5 also illustrates large year-to-year variability in rainfall, with no consistent increasing or decreasing trend. This observation aligns with the Mann-Kendall and Sen’s slope results that confirmed no statistically significant temporal trend in rainfall across all municipalities. Overall, rainfall patterns in Dar es Salaam appear to be driven by short-term weather dynamics rather than a long-term climatic shift.
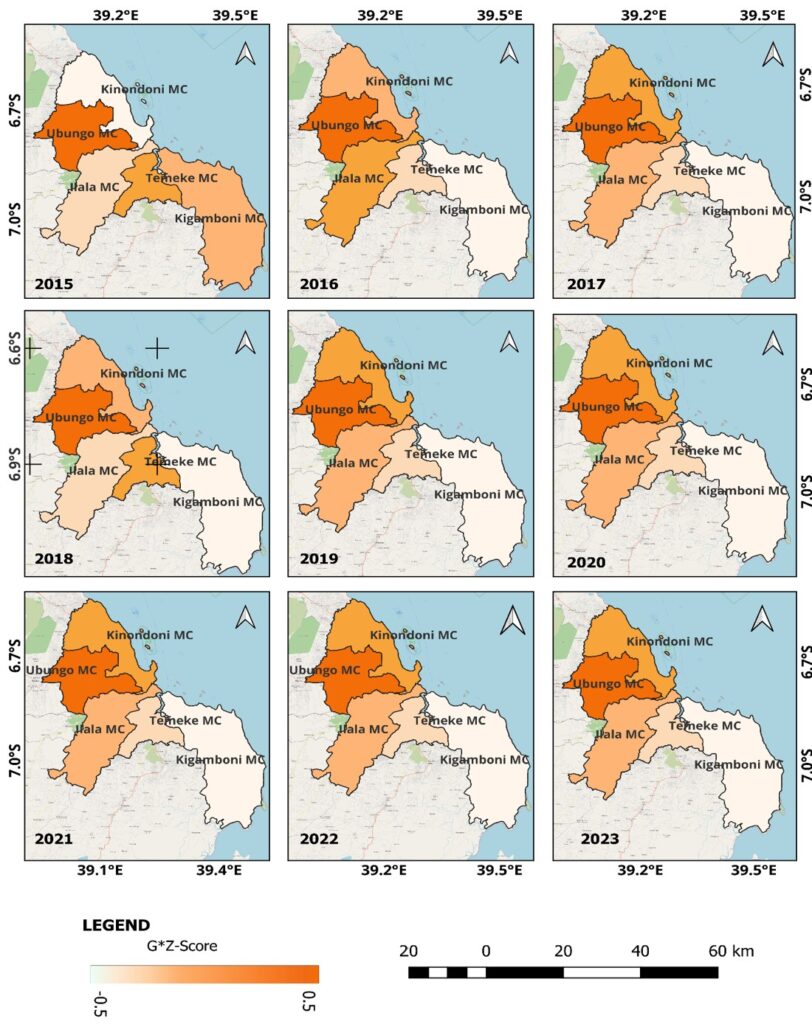
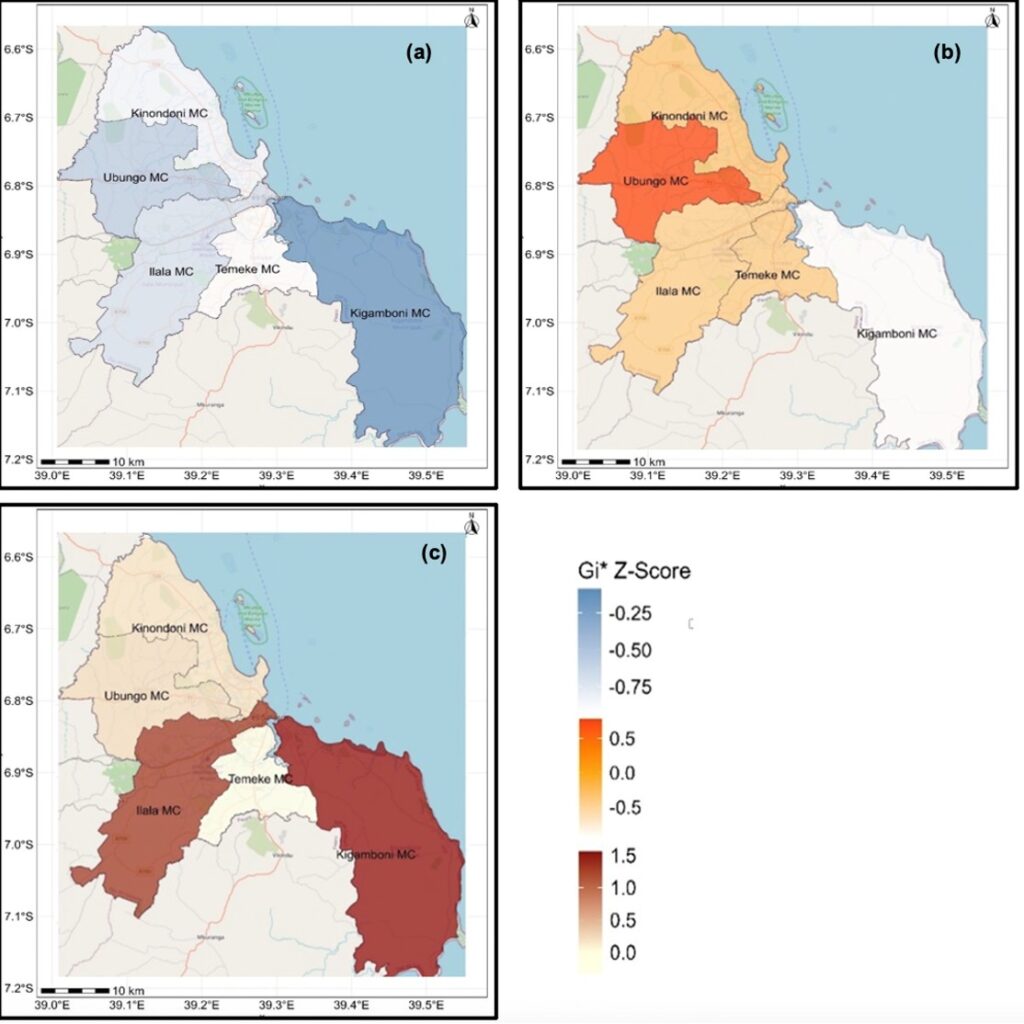
Temperature hotspot analysis (Figure 6) showed clearer spatial clustering patterns than rainfall. Ubungo MC consistently appeared as a hotspot, reflected by its highest mean Gi* Z-score (0.778) (Table 4). This municipality features dense built-up areas and heat-retaining infrastructure, contributing to a persistent “urban heat island” effect. In contrast, Kigamboni MC maintained a strong cold-spot pattern with an extremely negative mean Gi* Z-score (−0.948), likely associated with its coastal environment, lower building density, and greater vegetation coverage, which enhance cooling.
Temeke MC also demonstrated moderate cold-spot clustering, whereas Kinondoni MC and Ilala MC displayed fluctuating clustering over time, transitioning between weak cold-spot and near-neutral patterns. Figure 7(b) suggests a very slight warming signal in Ubungo and Ilala MC, consistent with urban expansion in these areas. However, trend tests returned non-significant results for all municipalities (Table 5), confirming that temperature changes remain minimal and not statistically conclusive.
Malaria incidences
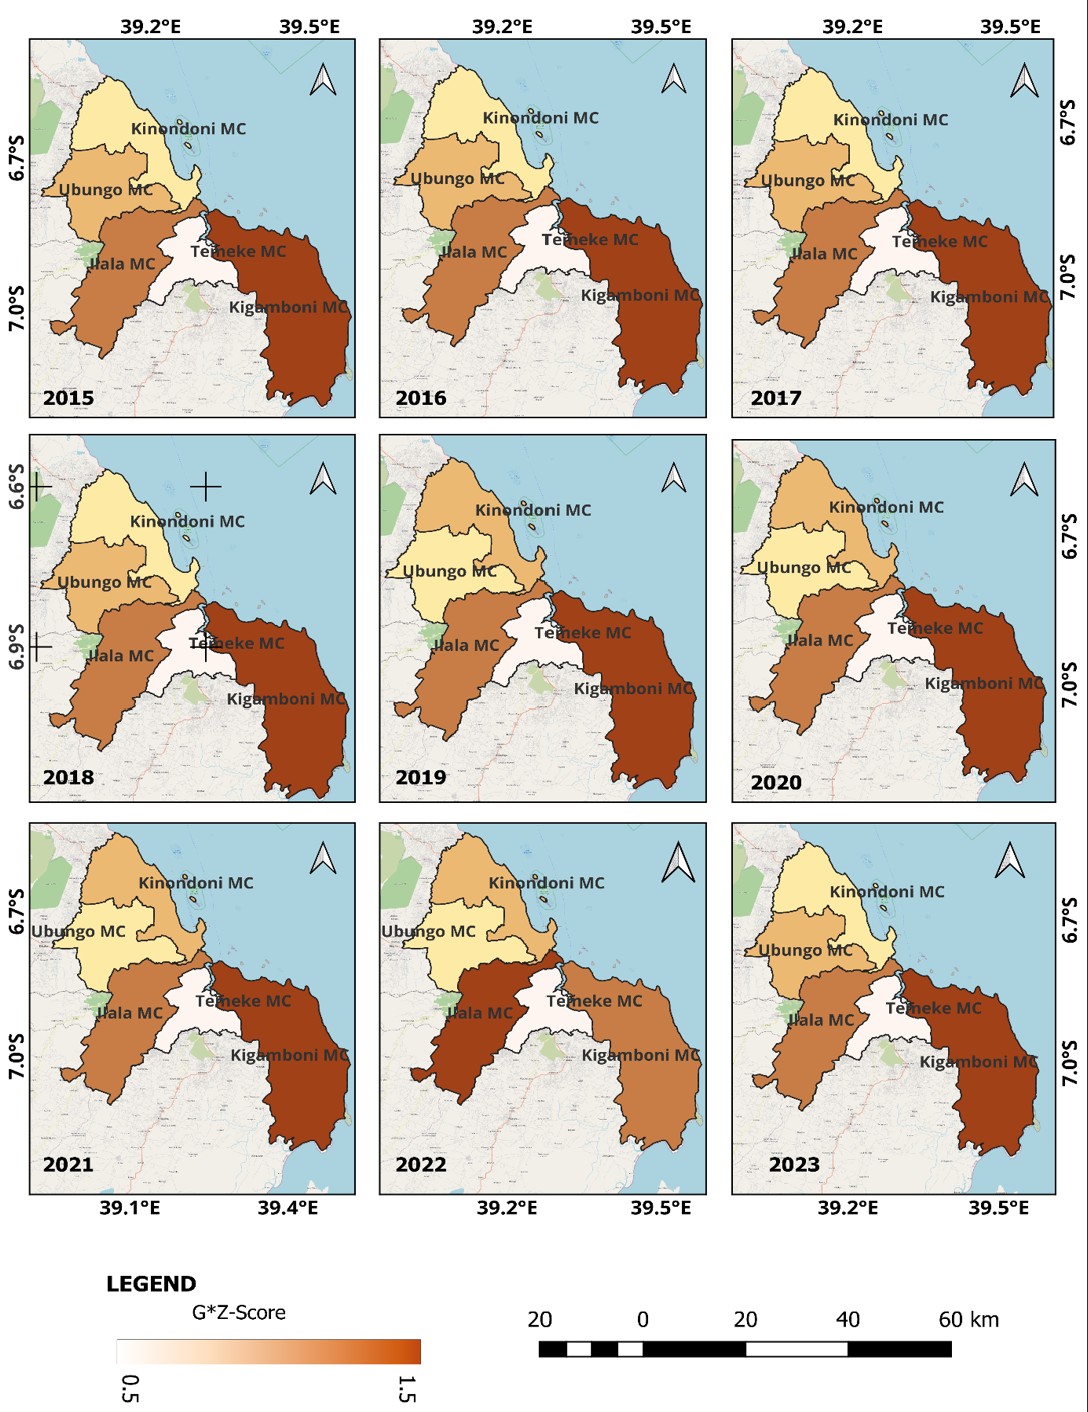
The spatial pattern of malaria incidence between 2015 and 2023, computed using the Getis-Ord Gi* Z-score and presented in Figure 8, shows clear spatial clustering across the five municipal councils of Dar es Salaam. Kigamboni MC and Ilala MC consistently appear as malaria hotspots, with repeated clustering of high incidence values in most years. This pattern is statistically supported by their strong positive mean Gi* Z-scores of 1.471 and 1.331, respectively (Table 6). These persistent hotspots may reflect a combination of environmental and socio-economic conditions, including coastal wetlands and informal settlements in Kigamboni, and high-density housing, markets, and drainage challenges in Ilala, which can sustain mosquito breeding sites and human vector contact.
Despite their persistent hotspot status, both municipalities show a declining intensity of hotspot clustering over time, as indicated by their negative temporal correlation coefficients (r = −0.669 for Kigamboni and r = −0.652 for Ilala). This suggests that, although these districts remain high-burden areas, the strength of clustering is gradually weakening, potentially reflecting the impact of intensified malaria control interventions and improvements in health services and urban infrastructure over the study period.
In contrast, Temeke MC demonstrates a clear shift from a weak cold-spot pattern towards an emerging hotspot in the later years. This transition is reflected by its strong positive temporal correlation (r = 0.845) despite a negative mean Gi* Z-score (−0.305), indicating that areas of elevated malaria incidence are becoming more spatially concentrated over time. This emerging hotspot pattern in Temeke may be linked to rapid urban expansion, uneven drainage, and growing informal settlements, which can create new favourable habitats for malaria vectors.
Kinondoni MC and Ubungo MC exhibit relatively neutral clustering, with mean Gi* Z-scores of 0.196 and 0.215, respectively, oscillating between weak hotspot and near-random patterns and indicating no consistently dominant spatial cluster during the study period. Year-to-year fluctuations in malaria incidence across all municipalities are illustrated in Figure 8(c), which shows intermittent peaks and declines without a simple uniform pattern. However, the overall direction remains downward, in line with the strong regional decline in malaria incidence reported earlier.
The generally non-significant p-values associated with temporal changes in Gi* scores (Table 6) indicate that, while hotspot intensity varies from year to year, these changes are not statistically strong enough to define clear temporal trends in clustering. Instead, the results emphasize persistent spatial heterogeneity, with some municipalities (Ilala and Kigamboni) remaining priority areas and others, such as Temeke, emerging as new areas of concern.
Relationship analysis
The statistical associations between climate variables (rainfall and temperature) and malaria incidence in Dar es Salaam from 2015 to 2023 were assessed using both Pearson correlation and simple linear regression models, which were applied to assess the strength and direction of the climate–malaria relationship. A summary of these results is presented in Table 7.
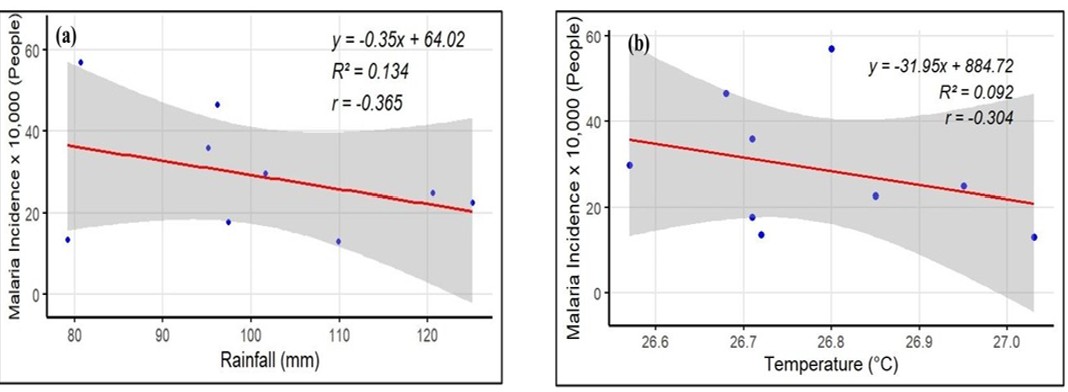
Malaria and rainfall
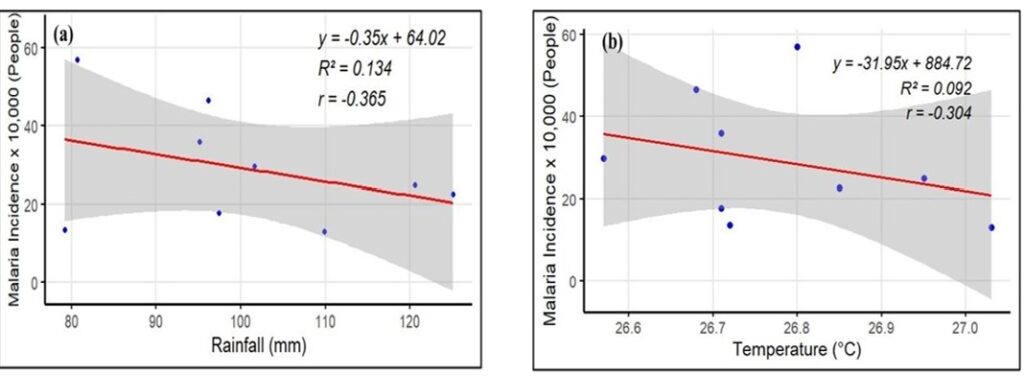
The association between annual rainfall and malaria incidence was assessed using Pearson correlation and linear regression (Figure 9(a)). The Pearson correlation coefficient was −0.365 (p = 0.334), indicating a weak and statistically insignificant negative relationship. This suggests that years with slightly higher rainfall did not correspond to increased malaria cases. Linear regression yielded y = -0.348x + 64.02 with an R² value of only 0.134, indicating that rainfall explains less than 14% of malaria variation, while the adjusted R² (< 1%) confirms the very low explanatory power of rainfall in this relationship. The regression coefficient for rainfall was -0.348 (SE = 0.335, p = 0.334), further supporting the absence of a meaningful statistical association. The F-statistic = 1.079 (df = 1,7) and residual standard error = 14.99 also indicate that the regression model does not provide a significant fit. Residual values ranging from -22.89 to 21.11 show considerable variability not accounted for by rainfall. Generally, these findings demonstrate that rainfall had no detectable linear influence on malaria incidence during the study period, reinforcing the conclusion that non-climatic drivers played a far more influential role in the observed malaria decline.
Malaria and temperature
The association between annual temperature and malaria incidence from 2015 to 2023 was assessed using linear regression and Pearson correlation (Figure 9(b)). The regression model produced y = −31.95x + 884.72, with an R² value of 0.092, indicating that temperature explains less than 10% of the variability in malaria incidence. The adjusted R² was negative (−0.037), further demonstrating that the model does not provide a meaningful explanatory fit.
The regression coefficient for temperature was −31.95 (SE = 37.87, p = 0.427), confirming that the relationship is not statistically significant. The F-statistic = 0.712 (df = 1,7) and residual standard error = 15.35 also indicate a poor model performance with substantial unexplained variance. The Pearson correlation coefficient was -0.304 (p = 0.427), revealing a weak and statistically insignificant negative association between temperature and malaria incidence.
Together, these results confirm that temperature had no detectable linear influence on malaria incidence during the study period, reinforcing the conclusion that the major drivers of malaria decline in Dar es Salaam are non-climatic factors such as public health interventions and improved living conditions.
Performance evaluation of satellite-derived rainfall data
Annual TerraClimate rainfall estimates demonstrated strong agreement with ground-based rainfall observations in Dar es Salaam, confirming the suitability of this dataset for regional climate assessment. The strong correlation and high coefficient of determination indicate that TerraClimate captures approximately 83% of the temporal variability observed in rainfall measurements from local gauges. Although the regression line suggests that the satellite dataset slightly underestimates higher rainfall values, the RMSE and MAE remain within acceptable ranges for large-scale environmental studies, supporting its reliability for climatological analyses in coastal urban regions such as Dar es Salaam.
These findings align with earlier validation studies by Abatzoglou et al. (2018), who reported high performance metrics (median ρ = 0.90) and demonstrated that TerraClimate improves spatial accuracy and rainfall representation relative to lower-resolution products [34]. However, performance can vary geographically, as reported by Abubakar (2024), who found slight overestimation in certain regions of South Africa while still noting favorable RMSE compared with other datasets like CHIRPS [35]. Therefore, while TerraClimate is robust for regional rainfall trend analysis, local calibration is recommended when a precise, site-specific hydrological assessment is required.
Spatial-temporal trends in climate variables
Spatial-temporal analysis revealed weak and statistically insignificant trends in both temperature and rainfall from 2015 to 2023, confirming that climate variability did not follow a clear directional change over the study period. However, distinct spatial clustering patterns occurred across municipalities, pointing to localized environmental and urban influences on micro-climate variations within the city.
For temperature, a weak, non-significant increasing tendency was detected from linear regression (R² = 17.7%, p = 0.260) and confirmed by Mann-Kendall and Sen’s slope tests. Spatially, Ubungo MC consistently emerged as a temperature hotspot, supported by its highest mean Gi* Z-score (0.778), likely due to dense built-up surfaces, reduced vegetation, and resulting urban heat island effects. Conversely, Kigamboni MC and Temeke MC persisted as temperature cold spots, reflecting coastal cooling influence and comparatively lower urban density. Kinondoni and Ilala MC showed fluctuating clustering, alternating between weak cold spots and neutral patterns.
Rainfall trends also demonstrated no statistically significant temporal change (linear regression R² = 7.36%, p = 0.480), with high inter-annual variability indicative of short-term weather influences rather than long-term climate shifts. Spatial clustering identified Temeke MC and Ilala MC as recurrent rainfall cold spots, whereas Kigamboni MC occasionally shifted into hotspot conditions, reflecting its exposure to localized coastal rainfall events. Ubungo and Kinondoni MC demonstrated no consistent spatial pattern over time (Figure 5; Table 4).
Collectively, these findings suggest that although climate conditions vary across Dar es Salaam, there is no clear evidence of a long-term climatic trend during the study period. Rather, the spatial differences observed appear to reflect the influence of urban expansion, land use change, vegetation loss and coastal environmental gradients in shaping local climatic conditions. From a public health perspective, these micro-climatic differences are important because local variation in temperature and humidity can influence mosquito survival, biting activity and the rate of plasmodium development thereby affecting malaria transmission potential [36, 37]. In urban setting malaria risk is often heterogeneous and strongly conditioned by local ecology and environmental conditions, meaning that transmission may persist in localised hotspots even where broader city-wide climatic trends are weak or absent [24]. These findings therefore have practical implications for malaria control and vector management in Dar es Salaam. They suggest that surveillance and intervention efforts may be more effective when spatially targeted toward neighbourhoods where environmental conditions favour vector breeding and persistence. This is particularly relevant in urban areas, where larval habitats are often relatively identifiable and manageable, making environmental management and larval source management useful complements to core interventions such as insecticide-treated nets and indoor spraying [38, 39]. Generally, integrating micro-climatic and land use information into urban planning, public health surveillance and vector control strategies could help improve the efficiency and precision of malaria prevention in rapidly growing municipalities.
These results are consistent with Simon et al. (2023), who showed that rapid urban expansion and limited vegetation cover contribute to localised warming in densely populated areas such as Ubungo MC, with urbanisation identified as a major driver of spatial temperature clustering in Dar es Salaam rather than broader regional climate change forces [40].
Spatial-temporal trends in malaria incidences
This study found a remarkable and sustained decline in reported malaria cases in Dar es Salaam between 2015 and 2023, representing a major public health achievement. Linear regression analysis showed a strong negative trend, with the model indicating an average annual reduction of approximately 53,000 cases. The high coefficient of determination and very small p-value confirm that this declining pattern is statistically robust. This is further supported by the Mann-Kendall test, and Sen’s slope estimate further confirms a strong monotonic decrease in malaria incidence over the nine-year period. These findings are consistent with the possibility that non-climatic factors such as intensified malaria control interventions, improved access to diagnosis and treatment, better housing and enhanced urban infrastructure may have supported malaria reduction in Dar es Salaam. However, since these factors were not explicitly evaluated in the present study, no direct causal inference can be made regarding their relative contribution [38, 41-43].
Despite this overall success, the spatial hotspot analysis revealed substantial heterogeneity between municipalities. As shown in Figure 8 and Table 6, Kigamboni MC and Ilala MC consistently appeared as malaria hotspots, with high mean Gi* Z-scores indicating persistent clustering of elevated incidence. However, the negative temporal correlation coefficients for Kigamboni and Ilala indicate that the intensity of these hotspots is gradually weakening over time, suggesting that malaria control efforts are beginning to reduce transmission intensity in these historically high-burden districts. The persistence of hotspot status in these areas is likely linked to a combination of environmental and socio-economic conditions, including informal settlements, inadequate drainage, standing water, and substandard housing, which create and maintain suitable mosquito breeding habitats and high human-vector contact. These areas, therefore, require sustained, targeted interventions to consolidate the gains already achieved.
In contrast, Temeke MC emerged as a growing area of concern. Initially characterized as a cold spot (mean Gi* Z-score), Temeke showed a strong positive temporal correlation in hotspot intensity indicating a transition towards an emerging hotspot in the later years of the study. This shift may be associated with rapid urban expansion, increasing informal settlements, clogged drainage systems, and possible gaps in intervention coverage, which can create new favourable conditions for malaria transmission. Although these factors were not directly measured in this analysis, they are consistent with known urban malaria risk drivers and warrant further investigation.
Kinondoni MC and Ubungo MC exhibited relatively unstable and low-intensity clustering patterns, with mean Gi* Z-scores and no clear temporal trend in hotspot intensity. This instability may reflect short-term changes in local environmental conditions for example, construction activities, small-scale land-use changes, or localized water management practices rather than sustained structural risk factors. These findings highlight the dynamic nature of malaria transmission in urban settings, where risk can shift over relatively short time scales.
Overall, while Dar es Salaam has made substantial progress in reducing malaria incidence, the spatial inequities documented in this study highlight the need for localized and adaptive control strategies. Persistent hotspots (Ilala and Kigamboni) and emerging risk areas such as Temeke should remain priority targets for intensified surveillance and intervention in order to sustain gains and prevent resurgence. These observations are consistent with national trends from Mainland Tanzania, where school-age malaria prevalence declined from 21.6% in 2015 to 11.3% in 2023, reflecting the impact of long-term public health interventions and strengthened malaria control at the national level [44].
Relationship between climate variables and malaria incidence
Statistical regression and correlation analyses showed that malaria trends in Dar es Salaam from 2015 to 2023 cannot be explained by climate variability alone. Both temperature and rainfall exhibited weak, non-significant associations with malaria incidence, suggesting that climatic factors were not major determinants of the observed malaria reduction.
For temperature, the relationship with malaria incidence was weak and statistically insignificant, with a negative regression coefficient and very low explanatory power, indicating that temperature explained little to none of the year-to-year variation in malaria cases. The Pearson correlation coefficient reinforces this finding of no meaningful linear association. Similarly, the analysis suggest that rainfall alone is not sufficient to explain the observed variation in malaria cases. The relationship was weak, indicating that other factors are likely to have a stronger influence on malaria transmission. This shows that changes in malaria incidence are shaped by multiple drivers, not rainfall alone.
These findings align with multiple recent studies, including Filho et al. (2023), who also reported no significant climate-malaria relationship in nine sub-Saharan African settings and attributed malaria decline primarily to scaling up of public health interventions, improved housing, and urbanization rather than climate trends [45]. A recent study by Ekechi (2023) similarly emphasised that health system capacity and community-level socio-environmental factors exert far greater influence on malaria transmission dynamics than temperature variability [46].
Therefore, while climate remains a contextual element in malaria epidemiology, its independent contribution appears too limited to explain either the substantial decline or the spatial heterogeneity of malaria observed in Dar es Salaam. These results reinforce the importance of multi-factorial approaches that integrate socio-economic data, land-use changes, vector ecology, infrastructure conditions, and targeted intervention coverage to fully understand and effectively manage malaria risk in rapidly urbanizing environments like Dar es Salaam.
Furthermore, the observed decline aligns with national malaria control efforts implemented during this period, including large-scale distribution of insecticide-treated nets (ITNs) through mass campaigns and the School Net Programme, expanded access to rapid diagnostic tests (RDTs), and increased coverage of artemisinin-based combination therapies (ACTs) [47].
Tanzania also enhanced routine surveillance, vector monitoring, and stratified deployment of interventions under the National Malaria Strategic Plan and its subsequent revisions, with high-burden and densely populated councils including Dar es Salaam receiving priority attention for vector control and case management [48].
These targeted intervention packages likely played a central role in suppressing malaria transmission despite relatively stable climate conditions, supporting the interpretation that non-climatic factors were the dominant drivers of the observed decline in this urban setting [49].
Study limitations
This study assessed the temporal and spatial relationship between climate variability, which is represented by mean temperature and rainfall, and malaria incidence in Dar es Salaam from 2015 to 2023. Annual trends and spatial clustering patterns were examined to determine whether climate variability could explain malaria transmission in this rapidly urbanising setting. However, several important non-climatic drivers of urban malaria were not included. These include population density, land use change, housing quality, water and sanitation infrastructure, vector control interventions and socio-economic differences between communities. Although these factors are widely recognized as important determinant transmissions, they were beyond the scope of the present analysis. In addition, formal regression diagnostics, including tests for residual normality and heteroskedasticity were not conducted which limits evaluation of model assumptions. Lagged relationships between climate variables and malaria incidence were also not assessed. Potentially reducing the ability to detect delayed effects on vector abundance and disease transmission. Furthermore, while the nine-year study period was adequate for assessing recent patterns, it may be insufficient to capture longer-term climatic influences. These findings should therefore be interpreted cautiously as reflecting only the limited and context-specific role of climate variability. Future studies should integrate socio-environmental determinants and apply lag-based modelling approaches to provide a more comprehensive understanding of Malaria dynamics in urban setting.
This study demonstrates a substantial and statistically significant decline in malaria incidence in Dar es Salaam from 2015 to 2023, with more than a 70% reduction in reported cases. This downward trend, confirmed through both linear regression and non-parametric trend tests, highlights the major progress achieved through strengthened malaria control interventions and improvements in urban health and living conditions. However, spatial hotspot analysis revealed persistent high-risk clusters in Ilala and Kigamboni MC and an emerging hotspot in Temeke MC, indicating that malaria risk remains unevenly distributed across the city and requires locally targeted intervention strategies to sustain gains and prevent resurgence.
In contrast, climate variables (temperature and rainfall) exhibited only weak linear correlation and statistically insignificant temporal trends over the study period. Although distinct spatial clustering of climate conditions was observed such as persistent temperature hotspots in Ubungo MC and rainfall cold spots in Temeke and Ilala MC these did not translate into measurable effects on malaria transmission patterns. Regression and correlation analyses confirmed that temperature and rainfall explained very little of the year-to-year variation in malaria incidence, suggesting that climate acted only as a contextual factor rather than a primary driver of malaria dynamics in urban environment.
Overall, the findings indicate that non-climatic factors such as land-use patterns, drainage infrastructure, socio-economic conditions, housing quality, and the effectiveness and coverage of public health interventions play a more influential role in shaping malaria outcomes in Dar es Salaam. Understanding and addressing these spatial and socio-environmental disparities will be essential to guide future malaria surveillance and control efforts, particularly in persistent and emerging hotspots such as Ilala, Kigamboni, and Temeke.
Recommendations
Based on the study findings, the following actions are recommended to sustain malaria reduction and address remaining spatial disparities in Dar es Salaam:
What is already known about the topic
What this study adds
EFT, conceptualized, collected the data, analysed and discussed the results, and wrote the draft manuscript. DD supervised the research, checked on the suitability of the results, edited and did proofreading of the manuscript. All authors have read and agreed to the published version of the manuscript.
List of Abbreviations
GIS Geographic Information System
RS Remote Sensing
WHO World Health Organization
SST Sea Surface Temperature
LULC Land Use and Land Cover
SRTM Shuttle Radar Topography Mission
CSV Comma-Separated Values
R-squared / R² Coefficient of Determination
NDVI Normalized Difference Vegetation Index
DHS Demographic and Health Survey
MC Municipal Council
IPCC Intergovernmental Panel on Climate Change
ARC GIS Aeronautical Reconnaissance Coverage Geographic Information System)
LMICs Low- and Middle-Income Countries
EPA Environmental Protection Agency
MOHCDGEC Ministry of Health, Community Development, Gender, Elderly and Children (Tanzania)
TMA Tanzania Meteorological Authority
NDMI Normalized Difference Moisture Index
DHIS2 District Health Information Software 2
SDG Sustainable Development Goals
NetCDF Network Common Data Form
| SN | Source | Data | Use | Format |
|---|---|---|---|---|
| 1 | TerraClimate | Rainfall | Analyzing temporal trends | NetCDF, CSV |
| Temperature | ||||
| 2 | Ministry of Health | Malaria incidence | Analyzing trends of malaria incidence | CSV |
| Metric | Value |
|---|---|
| Pearson Correlation (r) | 0.91 |
| R-squared (R²) | 0.83 |
| RMSE (mm) | 128.21 |
| MAE (mm) | 122.88 |
| Method | Temperature | Rainfall | Malaria |
|---|---|---|---|
| Linear Regression | P-value = 0.260 Slope = 0.022 R-squared = 17.7% | P-value = 0.480 Slope = 1.566 R-squared = 7.4% | P-value = 0.00003 Slope = -5.299 R-squared = 92.7% |
| Kendall Test | P-value = 0.295 Tau = 0.31 | P-value = 0.348 Tau = 0.278 | P-value = 0.00026 Tau = -1 |
| Sen’s Slope | P-value = 0.295 Slope = 0.015 | P-value = 0.348 Slope = 2.595 | P-value = 0.00026 Slope = -4.779 |
| District | Mean_Gi_Z | P-value |
|---|---|---|
| Temeke MC | -0.838 | 0.460 |
| Kinondoni MC | -0.752 | 0.461 |
| Ilala MC | -0.578 | 0.477 |
| Ubungo MC | -0.519 | 0.631 |
| Kigamboni MC | -0.018 | 0.725 |
| District | Mean_Gi_Z | Mean_P_value |
|---|---|---|
| Kigamboni MC | -0.948 | 0.361 |
| Ubungo MC | 0.778 | 0.445 |
| Temeke MC | -0.460 | 0.596 |
| Kinondoni MC | -0.171 | 0.672 |
| Ilala MC | -0.376 | 0.711 |
| District | Mean_Gi_Z | P-value |
|---|---|---|
| Kigamboni MC | 1.471 | 0.147 |
| Ilala MC | 1.331 | 0.186 |
| Temeke MC | -0.305 | 0.718 |
| Kinondoni MC | 0.196 | 0.804 |
| Ubungo MC | 0.215 | 0.813 |
| Parameter | Malaria vs. Temperature | Malaria vs. Rainfall |
|---|---|---|
| Regression Equation | y = -31.95x + 884.72 | y = -0.348x + 64.02 |
| Regression Coefficient (Slope) | -31.95 | -0.348 |
| R-squared (R²) | 9.2% | 13.4% |
| P-value (Regression) | 0.427 | 0.334 |
| Pearson Correlation (r) | -0.304 | -0.365 |
| P-value (Correlation) | 0.427 | 0.334 |
| Correlation Strength | Weak Negative | Moderate Negative |