Research | Open Access | Volume 8 (4): Article 103 | Published: 13 Dec 2025
Views: 1,245
Menu, Tables and Figures
Table 1. Sociodemographic characteristics of study participants (n=401)
| Characteristics | Frequency | Percentage (%) |
|---|---|---|
| Mean age ± SD | 21.9 ± 1.5 | |
| Sex | ||
| Male | 161 | 40.1 |
| Female | 240 | 59.9 |
| Residence | ||
| Urban | 242 | 60.3 |
| Rural | 159 | 39.7 |
| Marital Status | ||
| Married | 28 | 7.0 |
| Unmarried | 373 | 93.0 |
| Year of Study | ||
| 1st | 56 | 14.0 |
| 2nd | 127 | 31.7 |
| 3rd | 139 | 34.7 |
| 4th / Intern | 79 | 19.7 |
| Family Type | ||
| Nuclear | 292 | 72.8 |
| Joint / Other | 109 | 27.2 |
| Father’s Education | ||
| Degree | 133 | 33.2 |
| Postgraduate | 135 | 33.7 |
| Other | 133 | 33.1 |
| Mother’s Education | ||
| Postgraduate | 148 | 36.9 |
| Degree | 143 | 35.7 |
| Other | 110 | 27.4 |
| Father’s Occupation | ||
| Government | 136 | 33.9 |
| Private | 138 | 34.4 |
| Self-employed | 86 | 21.4 |
| Other | 41 | 10.3 |
| Mother’s Occupation | ||
| Unemployed | 145 | 36.2 |
| Government | 119 | 29.7 |
| Private | 88 | 21.9 |
| Other | 49 | 12.2 |
| Socioeconomic Class | ||
| Class I | 370 | 92.2 |
| Other classes | 31 | 7.8 |
| Diet | ||
| Non-vegetarian | 296 | 73.8 |
| Vegetarian | 105 | 26.2 |
Table 1. Sociodemographic characteristics of study participants (n=401)
Table 2. Associations between sociodemographic variables and KAP categories regarding carbonated beverages
| Variable | Good / Positive n (%) | Poor / Negative n (%) | Crude OR (95% CI) | p-value (crude) | AOR* (95% CI) | Adjusted p-value* |
|---|---|---|---|---|---|---|
| Knowledge | ||||||
| Sex | ||||||
| Female | 100 (41.7%) | 140 (58.3%) | 1.91 (1.26–2.89) | 0.003 | 1.82 (1.15–2.87) | 0.01 |
| Male | 51 (31.7%) | 110 (68.3%) | Ref | Ref | Ref | Ref |
| Residence | ||||||
| Rural | 70 (44.0%) | 89 (56.0%) | 1.56 (1.05–2.32) | 0.048 | 1.45 (1.02–2.06) | 0.038 |
| Urban | 81 (33.5%) | 161 (66.5%) | Ref | Ref | Ref | Ref |
| Marital Status | ||||||
| Unmarried | 135 (36.2%) | 238 (63.8%) | 1.42 (0.66–3.06) | 0.368 | 1.31 (0.59–2.91) | 0.502 |
| Married | 8 (28.6%) | 20 (71.4%) | Ref | Ref | Ref | Ref |
| Attitude | ||||||
| Sex | ||||||
| Female | 160 (66.7%) | 80 (33.3%) | 1.78 (1.18–2.68) | 0.02 | 1.67 (1.09–2.55) | 0.018 |
| Male | 88 (54.7%) | 73 (45.3%) | Ref | Ref | Ref | Ref |
| Residence | ||||||
| Rural | 103 (64.8%) | 56 (35.2%) | 1.17 (0.79–1.73) | 0.436 | 1.12 (0.74–1.69) | 0.589 |
| Urban | 148 (61.2%) | 94 (38.8%) | Ref | Ref | Ref | Ref |
| Marital Status | ||||||
| Unmarried | 238 (63.8%) | 135 (36.2%) | 3.18 (1.45–6.98) | 0.006 | 2.12 (1.23–3.65) | 0.007 |
| Married | 10 (35.7%) | 18 (64.3%) | Ref | Ref | Ref | Ref |
| Practice | ||||||
| Sex | ||||||
| Female | 60 (25.0%) | 180 (75.0%) | 1.29 (0.83–2.01) | 0.255 | 1.24 (0.78–1.97) | 0.361 |
| Male | 33 (20.5%) | 128 (79.5%) | Ref | Ref | Ref | Ref |
| Residence | ||||||
| Rural | 41 (25.8%) | 118 (74.2%) | 1.24 (0.81–1.90) | 0.321 | 1.19 (0.76–1.86) | 0.447 |
| Urban | 53 (21.9%) | 189 (78.1%) | Ref | Ref | Ref | Ref |
| Marital Status | ||||||
| Unmarried | 88 (23.6%) | 285 (76.4%) | 1.13 (0.47–2.73) | 0.783 | 1.08 (0.43–2.69) | 0.872 |
| Married | 6 (21.4%) | 22 (78.6%) | Ref | Ref | Ref | Ref |
*AOR = adjusted odds ratio; adjusted for socioeconomic status and academic year. Bonferroni-corrected p-values reported.
Table 2. Associations between sociodemographic variables and KAP categories regarding carbonated beverages

Ajas Shihabudeen Noorjahan1,& Asha Raby Nazarulla2
1Department of Community Medicine, Mount Zion Medical College, Adoor, Pathanamthitta, Kerala, India, 2Department of Pathology, Muthoot College of Allied Health Sciences, Kozhencherry, Kerala, India
&Corresponding author: Ajas Shihabudeen Noorjahan, Department of Community Medicine, Mount Zion Medical College, Adoor, Pathanamthitta, Kerala, India, Email: shihabajas@gmail.com ORCID: https://orcid.org/0000-0002-6409-9818
Received: 06 Jun 2025, Accepted: 13 Dec 2025, Published: 13 Dec 2025
Domain: Non-Communicable Disease
Keywords: Carbonated beverages, KAP, medical students, South Kerala, NCDs
©Ajas Shihabudeen Noorjahan et al. Journal of Interventional Epidemiology and Public Health (ISSN: 2664-2824). This is an Open Access article distributed under the terms of the Creative Commons Attribution International 4.0 License (https://creativecommons.org/licenses/by/4.0/), which permits unrestricted use, distribution, and reproduction in any medium, provided the original work is properly cited.
Cite this article: Ajas Shihabudeen Noorjahan et al., Knowledge, attitude and practice regarding carbonated beverages among undergraduate students of a medical college in South Kerala. Journal of Interventional Epidemiology and Public Health. 2025;8(4):103. https://doi.org/10.37432/jieph-d-25-00137
Introduction: Carbonated beverages, high in sugar and acidity, contribute to non-communicable diseases (NCDs) such as obesity, diabetes, and dental caries. In India, 12–15% of adolescents consume sugar-sweetened beverages daily, exacerbating the NCD burden, with 65 million diabetes cases reported in 2023. Medical students, as future health advocates, are a critical population for studying knowledge, attitude, and practices (KAP) to inform public health strategies. We assessed KAP regarding carbonated beverages among undergraduate medical students in South Kerala and examined sociodemographic influences on KAP.
Methods: A cross-sectional study was conducted among 401 MBBS students at Dr Somervell Memorial CSI Medical College, Karakonam, Kerala (July–September 2024), using universal sampling. A validated questionnaire (Cronbach’s α=0.75–0.82) assessed KAP, with scores categorized using Bloom’s cut-offs (≥80% good/positive, 60–79% average/neutral, <60% poor/n). Multivariable logistic regression analysed associations with gender, residence, and marital status, adjusting for socioeconomic status (SES) and academic year.
Results: Of the participants, 35.2% had good knowledge, 63.1% had positive attitudes, and 23.4% followed good practices towards consumption of carbonated beverages. Good knowledge was associated with female (adjusted odds ratios (aOR)=1.82, 95% confidence intervals (CI): 1.15–2.87, p=0.010) and urban residence (aOR=1.45, 95%CI: 1.02–2.06, p=0.038). Positive attitude towards consumption of carbonated beverages was associated with female gender (aOR=1.67, 95% CI: 1.09–2.55, p=0.018) and being unmarried (aOR=2.12, 95% CI: 1.23–3.65, p=0.007). Good practices showed no significant associations (p>0.05).
Conclusion: Medical students showed positive attitudes but inadequate knowledge and practices regarding carbonated beverages. Sociodemographic factors influenced knowledge and attitude, indicating the need for targeted interventions to improve healthy beverage behaviours.
Carbonated beverages, including sodas, colas, and sparkling waters, are popular for their sweet taste and carbonation but are linked to non-communicable diseases (NCDs) such as obesity, type 2 diabetes, cardiovascular diseases, and dental caries, as noted by the World Health Organization (WHO) [1,2]. Globally, sugar-sweetened beverages contribute to 7.4% of obesity cases and 5.6% of type 2 diabetes cases among adults [3]. In India, the NCD burden is rising, with 65 million diabetes cases reported in 2023 and 12–15% of adolescents consuming sugar-sweetened beverages daily, driven by urbanization and aggressive marketing [4,5]. South India has seen a 20% increase in carbonated beverage consumption over the past decade, replacing traditional drinks like lassi and exacerbating lifestyle-related health issues [6]. The WHO recommends limiting free sugar intake to less than 10% of daily energy intake, a threshold frequently exceeded by carbonated beverage consumption [3]. Excessive intake may displace nutrient-rich beverages like milk, reducing calcium intake and affecting bone health [7].
Medical students, as future healthcare providers, are a critical population for studying KAP due to their role in promoting healthy behaviours and their access to health education, which should theoretically influence consumption patterns [8]. Their behaviours may shape peer and patient perceptions, making their KAP relevant for public health interventions [9]. Overconsumption among students is linked to weight gain, dental issues, and mental health disturbances, potentially impacting academic performance [8]. A 2023 Malaysian study reported high consumption despite awareness of health risks, underscoring the need for region-specific data [10]. A 2022 study among dental students noted moderate knowledge but poor practices, indicating a gap between awareness and behaviour [2]. We therefore assessed the knowledge, attitude, and practices (KAP) regarding carbonated beverages among undergraduate medical students in South Kerala and examined the factors influencing KAP, including associations with sociodemographic variables such as gender, residence, and marital status.
Study design, setting, and population
This cross-sectional study was conducted at Dr Somervell Memorial CSI Medical College, Karakonam, Kerala (a private medical college affiliated to Kerala University of Health Science, which trains 150 MBBS students every year, along with 32 postgraduate students), targeting undergraduate MBBS students (Phase I–III) from July to September 2024. The study was approved by the Institutional Ethics Committee (IEC) (SMCSIMCH/EC(PHARM)/05/15/26, dated June 15, 2024). All eligible MBBS students who provided consent were included, minimising selection bias. Eligibility included enrolled MBBS students, with no exclusion based on gender, residence, or academic year.
Sample size calculation and sampling
Universal sampling was done to include all 420 eligible students; however sample size was calculated using the formula
$$ n = \frac{Z^2 \times P \times (1 – P)}{d^2} $$
(Z = 1.96 for 95% confidence, P = 0.40 based on prior study[8] for anticipated proportion of good knowledge, d = 0.05 for precision), yielding 369. After adding 10% for non-response, the minimum target was 410 to ensure statistical power. Ultimately, 401 students participated (response rate 95.5%).
Data collection tools and techniques
A structured, self-administered questionnaire consisting of 24 items was developed to assess sociodemographic details and KAP regarding carbonated beverages. It comprised 10 knowledge items (e.g., health risks, sugar content, WHO sugar guidelines), 8 Likert-scale attitude items (e.g., perceptions of health risks and consumption preferences), and six practice items (e.g., frequency of consumption, portion sizes, and use of healthier alternatives). Content validity was established through expert review by two public health specialists and one nutritionist (Content Validity Index = 0.92). The questionnaire was pilot-tested on 50 undergraduate MBBS students from the same who were not part of the final study sample. Their feedback was used to refine ambiguous wording and improve clarity. Reliability was confirmed with Cronbach’s alpha values of 0.78 for knowledge, 0.82 for attitude, and 0.75 for practice, along with test-retest reliability (Cohen’s kappa = 0.71, n=30, 2-week interval). The final version was distributed via Google Forms through official class WhatsApp groups, using unique links to prevent multiple submissions. Anonymity was maintained by excluding all identifiable information
Variables assessed
Dependent variables
Knowledge: Ten items assessing awareness of health risks of carbonated beverages (obesity, type 2 diabetes, dental caries), sugar content, and WHO recommendations on free sugars (<10% of total energy intake, ideally <5%) [3,4]. Responses were scored as correct or incorrect. Using Bloom’s original cut off criteria [14], scores were categorized as good (≥80%), average (60–79%), or poor (<60%).
Attitude: Eight 5-point Likert-scale items on perceptions of health risks and acceptability of consumption. Total score was converted to percentage of maximum possible score and categorized as positive (≥80%), neutral (60–79%), or negative (<60%) using Bloom’s original cut off criteria [14].
Practice: Six items on frequency of consumption, usual portion size, and preference for healthier alternatives. Healthy behaviours were scored positively; total score was converted to percentage and categorized as good (≥80%), neutral (60–79%), or poor (<60%) using Bloom’s original cut off criteria [14].
Independent variables
Included gender, residence (urban/rural), marital status, socioeconomic status (Modified BG Prasad scale), and academic year. Bloom’s original cut off was used without modification to categorize knowledge, attitude, and practice scores, and pilot testing confirmed that these categories yielded meaningful and well-balanced groups.
Data analysis
Data were entered into Microsoft Excel and analysed using SPSS (version 28.0, trial). Descriptive statistics included percentages for categorical variables (e.g., KAP categories) and means ± standard deviations (SD) for continuous variables (e.g., age, KAP scores). Pearson chi-square tests assessed associations between KAP categories and independent variables (gender, residence, marital status), with expected cell frequencies verified (>5). Effect sizes were reported using Cramer’s V. Multivariable binary logistic regression was performed to adjust for potential confounders, socioeconomic status (SES), and academic year because higher SES is known to increase affordability and access to carbonated beverages [11,12]. Senior students receive more formal teaching on nutrition and non-communicable diseases, which may influence knowledge and attitudes [7,8,10]. Adjusted odds ratios (aORs) with 95% confidence interval (CI) were reported. Bonferroni correction was applied for multiple comparisons to reduce type I errors. A p-value <0.05 was considered statistically significant
Ethical considerations
Ethical clearance was obtained from the IEC (SMCSIMCH/EC(PHARM)/05/15/26, June 15, 2024). Informed consent was secured electronically via Google Forms, with participants (all ≥18 years, mean age=21.88, SD=1.53) informed of the study’s purpose, voluntary nature, and right to withdraw. Anonymity was maintained by excluding personal identifiers, and data were stored on a password-protected server accessible only to the research team, per Indian Council of Medical Research (ICMR) guidelines (2017) [15].
The study included 401 participants (59.9% female, n=240; 40.1% male, n=161) with a mean age of 21.9 years (SD = 1.5). Most participants (93%) were unmarried, 60.3% resided in urban areas, and 39.7% in rural areas. Students were distributed as follows: 14.0% first-year, 31.7% second-year, 34.7% third-year, and 19.7% fourth-year/interns. The vast majority (92.2%) belonged to the upper socioeconomic class (Class I, Modified BG Prasad scale), and 73.8% followed a non-vegetarian diet (Table 1).
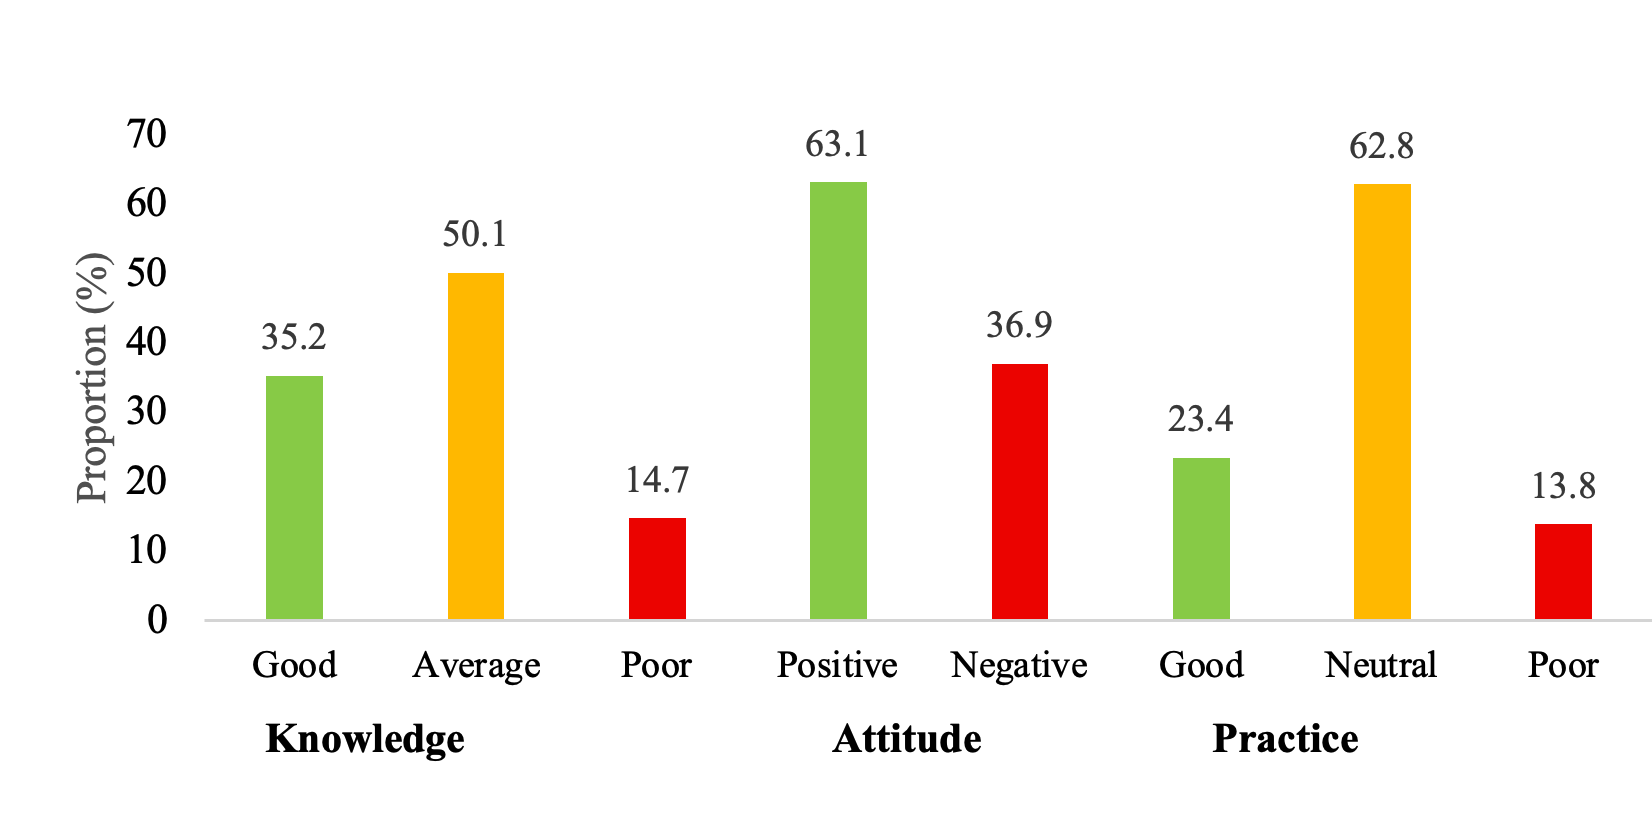
About 35.2%(141/401) had good knowledge (e.g., 82% identified obesity and diabetes risks, 45% knew WHO sugar guidelines), 50.1% (201/401)had average knowledge, and 14.7% (59/401) had poor knowledge. About the attitude towards consumption of carbonated beverages, 63.1%(253/401) had a positive attitude (e.g., 75% agreed carbonated beverages pose health risks, 40% viewed them as socially acceptable), and 36.9% (148/401)had a negative attitude (Figure 1). Whereas, 23.4% (94/401)followed good practices (e.g., 30% consumed <1 serving/week, 20% preferred healthier alternatives), 62.8% (252/401)neutral, and 13.8% (55/401)poor (e.g., 15% consumed >3 servings/week) (Figure 1)
Chi-square tests and multivariable logistic regression showed that good knowledge was significantly associated with female gender (AOR = 1.82, 95% CI 1.15–2.87, p = 0.010) and rural residence (AOR = 1.45, 95% CI 1.02–2.06, p = 0.038). Good knowledge was higher among females (41.7%) than males (31.7%), and was mostly recorded among students from rural areas (44.0%) compared with urban students (33.5%).
Positive attitude was significantly associated with gender (AOR = 1.67, 95% CI 1.09–2.55, p = 0.018) and marital status (AOR = 2.12, 95% CI: 1.23–3.65, p = 0.007). Females (66.7%) and unmarried students (63.8%) exhibited more positive attitudes than males (54.7%) and married students (35.7%). No sociodemographic variable was significantly associated with good practice (Table 2),
This study revealed moderate knowledge (good: 35.2%), positive attitudes (63.1%), and poor practices (good: only 23.4%) among 401 medical students in South Kerala. Significant associations between knowledge and gender (p=0.010) and residence (p=0.038), and between attitude and gender (p=0.018) and marital status (p=0.007), align with prior studies [8,10]. Females and rural students showed better knowledge, possibly due to greater health education exposure or cultural dietary norms [8].
The lack of significant associations for practices suggests a knowledge-practice gap, potentially driven by habit, peer influence, or limited access to healthier alternatives, as supported by the Theory of Planned Behaviour [13]. Cheah et al. (2023) reported similar positive attitudes (88.4%) but poorer practices (40.5%) among Malaysian students [10]. High SES (92.2% Class I) may increase access to carbonated beverages, contributing to this gap [11]. Unadjusted confounders (e.g., peer influence, marketing) and the cross-sectional design limit causal inferences. Qualitative studies could explore contextual barriers like campus vending machine availability.
Limitations
Self-reported data may introduce recall or social desirability biases. The cross-sectional design limits causal inferences, and the single-centre setting restricts generalizability. Residual confounding (e.g., peer influence, marketing) may affect results.
Undergraduate medical students in South Kerala showed moderate knowledge, positive attitude, and poor practices regarding carbonated beverage consumption. Significant sociodemographic influences were observed for knowledge and attitude but not practices, highlighting a knowledge-practice gap. Targeted interventions, such as curriculum-based education and policy changes (e.g., limiting vending machine access), are needed to bridge this gap, particularly among male and urban students.
Recommendations
We recommend integrating educational programmes into the medical curriculum to enhance awareness and promote healthier alternatives. Workshops targeting male and urban students could address KAP gaps. Policy changes, such as restricting campus vending machine access, are recommended. Longitudinal and qualitative studies should explore social and cultural influences on consumption.
What is already known about the topic
What this study adds
| Characteristics | Frequency | Percentage (%) |
|---|---|---|
| Mean age ± SD | 21.9 ± 1.5 | |
| Sex | ||
| Male | 161 | 40.1 |
| Female | 240 | 59.9 |
| Residence | ||
| Urban | 242 | 60.3 |
| Rural | 159 | 39.7 |
| Marital Status | ||
| Married | 28 | 7.0 |
| Unmarried | 373 | 93.0 |
| Year of Study | ||
| 1st | 56 | 14.0 |
| 2nd | 127 | 31.7 |
| 3rd | 139 | 34.7 |
| 4th / Intern | 79 | 19.7 |
| Family Type | ||
| Nuclear | 292 | 72.8 |
| Joint / Other | 109 | 27.2 |
| Father’s Education | ||
| Degree | 133 | 33.2 |
| Postgraduate | 135 | 33.7 |
| Other | 133 | 33.1 |
| Mother’s Education | ||
| Postgraduate | 148 | 36.9 |
| Degree | 143 | 35.7 |
| Other | 110 | 27.4 |
| Father’s Occupation | ||
| Government | 136 | 33.9 |
| Private | 138 | 34.4 |
| Self-employed | 86 | 21.4 |
| Other | 41 | 10.3 |
| Mother’s Occupation | ||
| Unemployed | 145 | 36.2 |
| Government | 119 | 29.7 |
| Private | 88 | 21.9 |
| Other | 49 | 12.2 |
| Socioeconomic Class | ||
| Class I | 370 | 92.2 |
| Other classes | 31 | 7.8 |
| Diet | ||
| Non-vegetarian | 296 | 73.8 |
| Vegetarian | 105 | 26.2 |
| Variable | Good / Positive n (%) | Poor / Negative n (%) | Crude OR (95% CI) | p-value (crude) | AOR* (95% CI) | Adjusted p-value* |
|---|---|---|---|---|---|---|
| Knowledge | ||||||
| Sex | ||||||
| Female | 100 (41.7%) | 140 (58.3%) | 1.91 (1.26–2.89) | 0.003 | 1.82 (1.15–2.87) | 0.01 |
| Male | 51 (31.7%) | 110 (68.3%) | Ref | Ref | Ref | Ref |
| Residence | ||||||
| Rural | 70 (44.0%) | 89 (56.0%) | 1.56 (1.05–2.32) | 0.048 | 1.45 (1.02–2.06) | 0.038 |
| Urban | 81 (33.5%) | 161 (66.5%) | Ref | Ref | Ref | Ref |
| Marital Status | ||||||
| Unmarried | 135 (36.2%) | 238 (63.8%) | 1.42 (0.66–3.06) | 0.368 | 1.31 (0.59–2.91) | 0.502 |
| Married | 8 (28.6%) | 20 (71.4%) | Ref | Ref | Ref | Ref |
| Attitude | ||||||
| Sex | ||||||
| Female | 160 (66.7%) | 80 (33.3%) | 1.78 (1.18–2.68) | 0.02 | 1.67 (1.09–2.55) | 0.018 |
| Male | 88 (54.7%) | 73 (45.3%) | Ref | Ref | Ref | Ref |
| Residence | ||||||
| Rural | 103 (64.8%) | 56 (35.2%) | 1.17 (0.79–1.73) | 0.436 | 1.12 (0.74–1.69) | 0.589 |
| Urban | 148 (61.2%) | 94 (38.8%) | Ref | Ref | Ref | Ref |
| Marital Status | ||||||
| Unmarried | 238 (63.8%) | 135 (36.2%) | 3.18 (1.45–6.98) | 0.006 | 2.12 (1.23–3.65) | 0.007 |
| Married | 10 (35.7%) | 18 (64.3%) | Ref | Ref | Ref | Ref |
| Practice | ||||||
| Sex | ||||||
| Female | 60 (25.0%) | 180 (75.0%) | 1.29 (0.83–2.01) | 0.255 | 1.24 (0.78–1.97) | 0.361 |
| Male | 33 (20.5%) | 128 (79.5%) | Ref | Ref | Ref | Ref |
| Residence | ||||||
| Rural | 41 (25.8%) | 118 (74.2%) | 1.24 (0.81–1.90) | 0.321 | 1.19 (0.76–1.86) | 0.447 |
| Urban | 53 (21.9%) | 189 (78.1%) | Ref | Ref | Ref | Ref |
| Marital Status | ||||||
| Unmarried | 88 (23.6%) | 285 (76.4%) | 1.13 (0.47–2.73) | 0.783 | 1.08 (0.43–2.69) | 0.872 |
| Married | 6 (21.4%) | 22 (78.6%) | Ref | Ref | Ref | Ref |