Research | Open Access | Volume 8 (3): Article 58 | Published: 28 Jul 2025
Views: 2,753
Menu, Tables and Figures
| Cluster | Cluster Type | Province | Dog Population | Cases | RR (95% CI) | Incidence (per 100,000) | p-value |
|---|---|---|---|---|---|---|---|
| 1 | High | Central Copperbelt Luapula Lusaka | 349,711 | 136 | 2.7 (2.07–3.53) | 38.9 | <0.001 |
| 2 | Low | North-Western Southern Western | 388,830 | 52 | 0.93 (0.71–1.22) | 13.3 | 0.602* |
| 3 | Low | Eastern | 122,079 | 14 | 0.80 (0.47–1.36) | 11.4 | 0.411* |
| 4 & 5 | Low | Northern Muchinga | 107,752 | 23 | 1.48 (0.93–2.36) | 21.3 | 0.099* |
*p = Not statistically significant (p > 0.05)
RR: Relative Risk 95% CI: 95% confidence interval
Table 1: Summary of Spatial Clusters for Dog Rabies Cases and Relative Risk in Zambia (2013–2022)
| Cluster | Cluster Type | Province | LLR | p-value |
|---|---|---|---|---|
| 1 | High | Central Copperbelt Luapula Lusaka | 27.38 | <0.001 |
| 2 | Low | North-Western Southern Western | 14.62 | 0.001 |
| 3 | Low | Eastern | 4.99 | 0.028 |
| 4 & 5 | Low (NS) | Northern Muchinga | 0.15 | 0.800 |
NS: Not statistically significant (p > 0.05)
LLR: Log Likelihood Ratio
Table 2: Summary of Cluster Statistics for Dog Rabies Cases and the Relative Risk in Zambia (2013–2022)
| Variable | Coefficient | Incidence Rate Ratio (95% CI) | p-value |
|---|---|---|---|
| Intercept | 109.1623 | ~1.94×10⁴⁷ | — |
| Vaccinations per month | 0.9999 | ≈1.00 | Not sig. |
| February | 0.5664 | 1.77 (1.01 – 3.12) | 0.044 |
| March | 0.8323 | 2.32 (1.19 – 4.49) | 0.014 |
| April | 0.688 | 1.99 (0.58 – 6.86) | 0.258 |
| May | 0.9657 | 2.63 (0.99 – 6.96) | 0.052 |
| June | -0.0036 | ≈1.00 (0.56 – 1.78) | 0.991 |
| July | 0.4532 | 1.57 (0.72 – 3.44) | 0.253 |
| August | 1.3454 | 3.84 (0.81 – 18.3) | 0.086 |
| September | 0.5739 | 1.77 (0.67 – 4.69) | 0.245 |
| October | 0.0255 | 1.03 (0.42 – 2.51) | 0.946 |
| November | 0.8966 | 2.45 (1.55 – 3.86) | <0.001 |
| December | NA | — | — |
Table 3: Poisson Regression Model Results for Monthly Rabies Incidence Rate Ratio in Zambia (2013–2022)
Humphrey Banda1,2,3,&, Amos Hamukale1, Chitwambi Makungu2, Wezi Kachinda2,, Masuzyo Ngoma2, Liywalii Mataa2, James Blazer Banda2, Walter Muleya4, Dabwitso Banda1,3, Nyambe Sinyange1,3
1Zambia Field Epidemiology Training Program, Lusaka, Zambia, 2Ministry of Fisheries and Livestock, Lusaka, Zambia, 3Zambia National Public Health Institute, Lusaka, Zambia, 4University of Zambia, Lusaka, Zambia
&Corresponding author: Humphrey Banda, Ministry of Fisheries and Livestock, Lusaka, Zambia, Email: drbanda28@gmail.com
Received: 23 Feb 2025, Accepted: 25 Jul 2025, Published: 28 Jul 2025
Domain: Rabies Control, One Health
Keywords: Epidemiology, Spatial Analysis, Time Factors, Rabies, Zambia
©Humphrey Banda et al Journal of Interventional Epidemiology and Public Health (ISSN: 2664-2824). This is an Open Access article distributed under the terms of the Creative Commons Attribution International 4.0 License (https://creativecommons.org/licenses/by/4.0/), which permits unrestricted use, distribution, and reproduction in any medium, provided the original work is properly cited.
Cite this article: Humphrey Banda et al Spatiotemporal analysis of dog-mediated rabies in Zambia: A retrospective study, 2013–2022. Journal of Interventional Epidemiology and Public Health. 2025;8(3):58. https://doi.org/10.37432/jieph-d-25-00057
Introduction: Rabies remains a significant public health threat in Zambia, particularly dog-mediated rabies. Despite national control efforts through vaccination, the disease persists, especially in rural regions with weak surveillance systems. This study aimed to analyse the spatial and temporal distribution of rabies cases in Zambia from 2013 to 2022 to identify high-risk areas and support targeted interventions.
Methods: This retrospective study utilized secondary data obtained from the National Livestock Epidemiological Information Centre (NALEIC) and the Central Veterinary Research Institute (CVRI), comprising all reported canine rabies cases from January 2013 to December 2022. A purely spatial cluster analysis using the Discrete Poisson model in SaTScan v10.3 was conducted to detect rabies clusters across 10 provinces of Zambia. A Poisson regression was used to assess seasonal trends in rabies incidence.
Results: A total of 225 rabies cases were reported between 2013 and 2022. The cumulative incidence rate was 23.2 cases per 100,000 dogs. A high-risk cluster was identified encompassing Central, Copperbelt, Luapula, and Lusaka provinces, with an incidence rate of 38.9 cases per 100,000 dogs and a statistically significant relative risk (RR) of 2.7 and 95% confidence interval (CI)= 2.07 – 3.53, indicating dogs in this cluster were 2.7 times more likely to be reported rabid than those outside. Two statistically significant low-risk clusters were identified: one covering North-Western, Southern, and Western province with incidence of 13.3/100,000, RR of 0.93 (95%CI= 0.71-1.22), and another in Eastern Province (incidence of 11.4/100,000, RR =0.80, 95%CI= 0.47-1.36) though their relative risks were not statistically significant. Northern and Muchinga provinces were non-statistically significant low-risk clusters. Seasonal trends showed increased rabies cases during February, March, and November, suggesting temporal peaks.
Conclusions: This study underscores significant regional and seasonal variation in rabies incidence in Zambia. High-risk areas, especially those with dense dog populations and limited vaccination coverage, should be prioritized for intensified rabies control efforts, including mass vaccination and enhanced surveillance. The presence of low-risk clusters may reflect underreporting, necessitating improved community engagement and diagnostic capacity. These findings are crucial for informing Zambia’s strategy to eliminate dog-mediated human rabies by 2030.
Rabies is a public health concern and a viral zoonotic disease [1]. It is an RNA lyssavirus of the Rhabdoviridae family [2] and can be transmitted between all warm-blooded species including man. Several domestic and wild mammals such as dogs, cats, livestock, wolves, foxes, jackals, and bats are susceptible to rabies viruses [2]. These animals can transmit the disease to humans through bites or scratches [2]. Most human rabies cases result from bites by rabid dogs [3].
Rabies disease is endemic on all continents except Antarctica [4] and causes approximately 59,000 human deaths annually, equivalent to one death every 10 minutes [5]. This disease is most prevalent in low and middle-income countries with poor or lack of management and control strategies [6]. Rabies occurrence in Zambia has been sporadic in various parts of the country [7,8]. The country reported an accumulative total of 1,004 rabies cases from 1985 to 2003 [8], and 463 cases from 2004 to 2014 [7]. These studies reported that Lusaka province had more confirmed cases among all provinces [7,8]. In Zambia, rabies infects a wide range of species such as dogs, cats, cattle, goats, sheep, and humans; also wild animals such as jackals, foxes, monkeys, and baboons [7,8].
The World Health Organization (WHO) recommends mass dog vaccination campaigns of 70% vaccine coverage and strict dog population control via restricted breeding, restricted movements, and stray dog cropping [9]. Rabies post-exposure prophylaxis (PEP) prevents rabies in humans exposed to the rabies virus if administered timeously [10,11]. Thus, PEP is the cornerstone for rabies prevention in humans, and it is against this background that it is recommended for all people that have been or are suspected of having been exposed to the rabies virus. Despite rabies being a preventable disease with available effective vaccines, most countries are still experiencing outbreaks due to low vaccination coverage and poor dog population management and ownership [9]. The aim of the study was to analyze the spatial and temporal distribution of reported canine rabies cases in Zambia from 2013 to 2022 to guide evidence-based prevention and control strategies.
Study design
This study used a retrospective cross-sectional design, analyzing secondary data obtained from the National Livestock Epidemiological Information Centre (NALEIC) and the Central Veterinary Research Institute (CVRI) under the Department of Veterinary Services (DVS) in Zambia.
Study setting
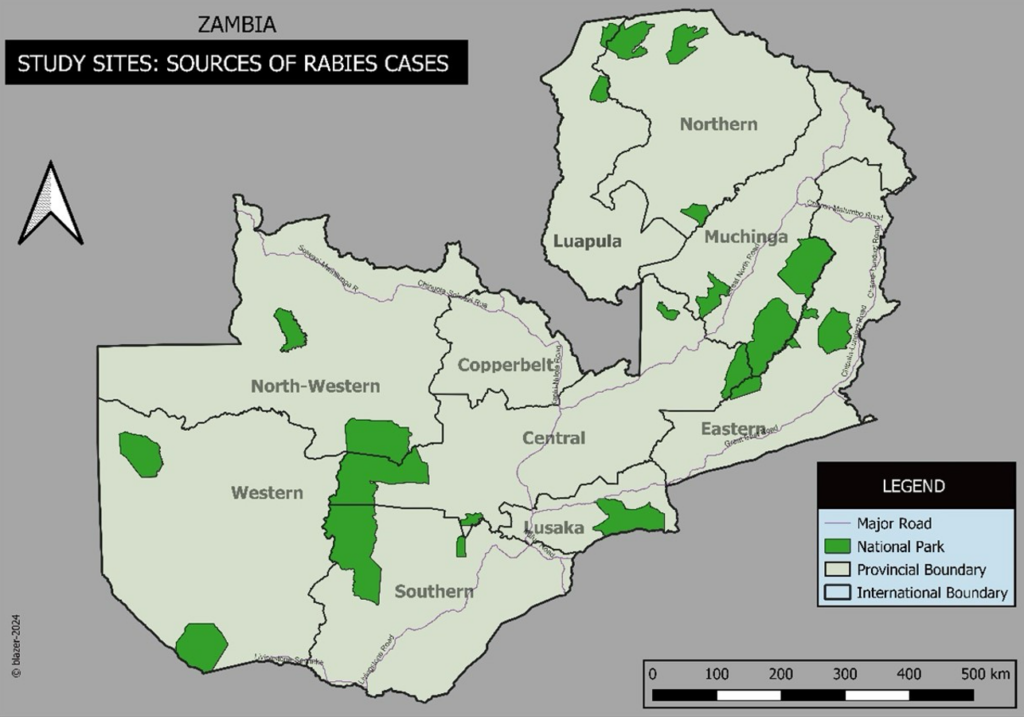
The study included secondary data of all rabies cases found in the NALEIC and CVRI databases from January 2013 to December 2022. These cases were reported from veterinary camps. A veterinary camp is a subdivision of the district, which is manned by a Veterinary Assistant. The cases included were recorded from all the 10 provinces of Zambia (Figure 1).
Data collection
The data were collected from all reported cases of rabies in Zambia (2013 to 2022) from NALEIC and CVRI databases. All rabies cases from 2013 to 2022 were extracted from the databases using a data collection tool in Excel. The population of dogs was extracted from the Livestock Survey Report [12].
Data analysis
A spatial and temporal analysis was conducted on all rabies cases over the years (2013-2022) and across the provinces of Zambia. The cumulative incidence rate was calculated using the following formula:
\[
\text{Cumulative Incidence Rate} =
\frac{\text{Total number of canine rabies cases}}{\text{Average dog population in Zambia (2018–2022)}} \times 100{,}000 \text{ dogs}
\]
Since Zambia has had only two animal censuses so far, ie. the 2018 and the 2022 census, this was the data source for the denominator in computing the rabies cumulate incidence rate.
A purely spatial cluster analysis using the Discrete Poisson model in SaTScan v10.3 was conducted to detect areas with unusually high disease rates from 2013 to 2022 across 10 provinces of Zambia. The input data included the number of reported rabies cases in dogs, the estimated dog population per province, and geographic coordinates of each provincial center. The maximum spatial cluster size was set at 50% of the population at risk to detect broad clusters. To detect low-rate areas, a separate analysis used a reduced radius limit of 10%. The analysis considered both population at risk and observed cases, scanning for statistically significant high-rate clusters using circular windows and Monte Carlo simulation [13].
A Poisson regression was used to determine seasonal trends of rabies cases in Zambia. Dispersion was determined by Pearson Chi-Square based dispersion test at p value ≤ 0.05. A Poisson regression model was fitted and assessed its goodness of fit by calculating the Pearson chi-square test in R. In addition, a ggplot2 R package was used to visualize the observed vs predicted rabies cases.
Ethical considerations
This study did not require ethical approval as it involved only anonymized secondary data, with no involvement of human participants, animals, or sensitive information. Approval of the use of the data was obtained from the Ministry of Fisheries and Livestock. The data extracted was only the number of cases per province, which are reported in the ministerial annual reports for policy and decision-making. The utilization of the data did not cause any maleficence for animals or humans.
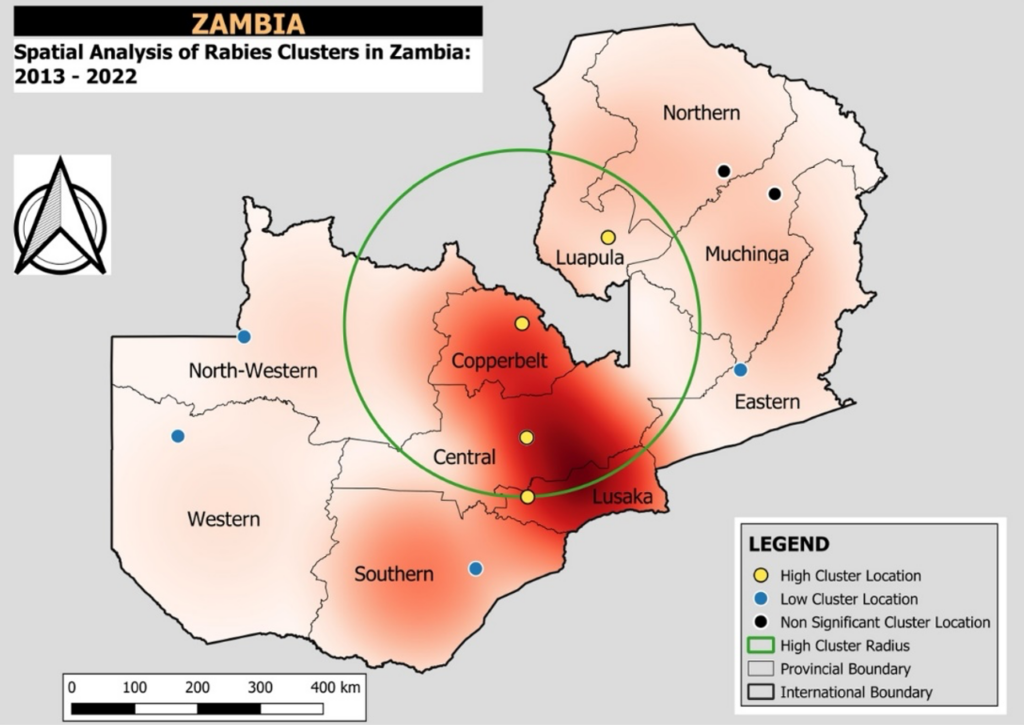
A total of 225 rabies cases were reported between 2013 and 2022. The cumulative incidence rate was estimated at 23.2 cases per 100,000 dogs. Cluster 1, was the only high-risk cluster and it encompassed four provinces: Central, Copperbelt, Luapula, and Lusaka (Figure 2) with a radius of 290.92 km and a total dog population of 349,711. Within this cluster, 136 cases were reported, yielding an incidence rate of 38.9 cases per 100,000 dog population per year. The relative risk (95%CI) was 2.7 (2.07 – 3.53), indicating that dogs within this area were 2.7 times more likely to be reported as rabid compared to those outside the cluster (Table 1).
The other four clusters were low risk and only clusters 2 and 3 were statistically significant low-risk clusters (Table 2). Cluster 2, which covered the Southern, North-Western, and Western Provinces, included a population of 388,830 and recorded 52 cases, corresponding to an incidence rate of 13.4 per 100,000. The relative risk (95%CI) was 0.93 (0.71 – 1.22), suggesting that dogs in cluster two were 7% less likely to be reported as rabid than those outside the cluster though this was not statistically significant. Cluster 3 involved 14 cases and had a relative risk (95%CI) of 0.80 (0.47 – 1.36), similarly indicating reduced rabies risk though not statistically significant. Additional clusters (Clusters 4 to 5) had a rabies incidence of 21.3 per 100,000 and a relative risk of 1.48 (95%CI=0.93-2.36) indicating that dogs within this area were 1.5 times more likely to be reported as rabid compared to those outside the cluster though this was not statistically significant (p =0.099). (Table 1).
The intercept, representing the baseline month of January when the number of vaccinations per month was zero, with a high estimate (109.16), suggesting potential overdispersion in the data. The coefficient for vaccinations per month was approximately 1 and statistically insignificant, indicating no meaningful influence on the number of reported cases (Table 3).
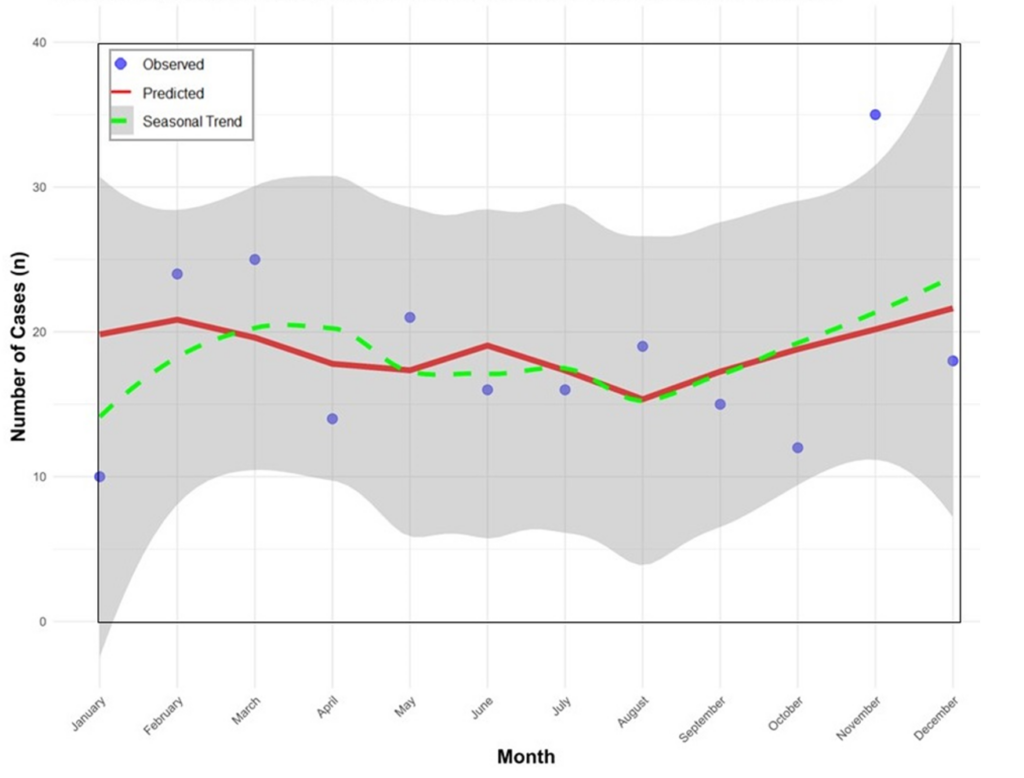
Comparative analysis across months revealed a bimodal seasonal pattern of rabies, with statistically significant incidence rate ratio (IRR) peaks observed in the early rainy season (February – March) and late dry to early rain season (November). Among these months, March had the highest IRR (95%CI) of 2.32 (1.19 – 4.49), followed by November [IRR = 2.45 (1.55 – 3.86)] and February [IRR = 1.77 (1.01 – 3.12)] all of which were statistically significant. Although other months specifically April, May, July, and August showed higher incidence rates, these differences were not statistically significant. June, October, and December demonstrated no meaningful deviation from the baseline (Table 3).
The seasonal Poisson regression analysis revealed notable differences between the observed, predicated and the seasonal trends in monthly rabies cases in Zambia from 2013 to 2022. The observed cases fluctuated over the months, with noticeable peaks in February, March and November and lower cuts in September and October. The predicated trend showed a smoothed representation of the average monthly cases without the sharp spikes. The seasonal trend highlighted a clear bimodal pattern with one peak in the early rainy season and another in late dry to early rainy season and a decrease in August (Figure 3).
The temporal patterns observed in the regression model suggest seasonal variability in rabies transmission, with peaks in the early and late months of the year. These seasonal peaks are influenced by a combination of behavioral and ecological factors such as increased dog movement during mating seasons, greater human-dog interactions, or enhanced surveillance during specific times of the year. Similar patterns have been observed in other settings, where seasonality affects the dynamics of rabies outbreaks [14,15]. The observed reduction in rabies cases during the dry months may be related to reduced transmission or underreporting. Understanding these dynamics is critical for planning and implementation of time-sensitive interventions. The vaccinations per month did not show a statistically significant association with rabies reporting trends. This suggests that low vaccination coverage may not directly influence monthly case incidence, supporting findings from earlier studies that emphasize the necessity of achieving and maintaining at least 70% vaccination coverage across the dog population, regardless of season [16]. This underscores the importance of sustained, year-round strategies rather than isolated or reactive vaccination campaigns.
The identification of both high and low risk spatial clusters provides critical insights for prioritizing rabies control interventions in Zambia. High-risk clusters, likely corresponding to areas with low vaccination coverage or higher dog populations, indicate regions where intensified control efforts are urgently needed. These areas would benefit from enhanced community engagement, robust routine vaccination campaigns, and strengthened disease surveillance. Conversely, low-risk clusters may reflect potential underreporting, requiring further investigations to verify that the low incidence is genuine and not a result of poor surveillance. The application of spatial scan statistics, offers valuable evidence for guiding resource allocation in alignment with the national rabies elimination strategy [5,13]. Additionally, Namibia’s successful implementation of oral rabies vaccination (ORV) campaigns, particularly targeting hard-to-reach and free-roaming dog populations as demonstrated a high bait uptake and vaccination coverage, providing a promising complementary strategy for rabies control in Zambia [17].
To effectively reduce the rabies incidence in the high-risk provinces identified in this study, there is a need to strengthen mass dog vaccination campaigns, especially in the months preceding peak transmission (January and October). Public awareness campaigns should be conducted through community radio, schools, and health outreach programs to increase knowledge about rabies prevention and reporting. Further, involving local leaders and community animal health workers in surveillance and dog population control could enhance early detection and response [18].
Improving rabies surveillance remains essential. This includes enhancing the capacity of veterinary personnel to conduct active case detection, improving community-based reporting systems, and integrating rabies surveillance into the national electronic surveillance system to ensure timely and reliable data reporting. Sample collection and laboratory confirmation also require urgent attention. Most rural districts remain far from the Central Veterinary Research Institute (CVRI) in Lusaka, making timely submission of samples for confirmation difficult. Therefore, District Veterinary Officers and Veterinary Assistants should be trained and equipped with proper tools for brain sample collection from suspected rabid dogs. Provision of cold boxes, personal protective equipment, and transport would greatly facilitate safe and timely sample referral [6,19]. In addition, strengthening regional laboratory capacity to diagnose rabies at a decentralized level would ensure rapid case detection and reduce delays in response. Laboratories at the provincial or regional level should be capacitated with equipment, reagents, and trained personnel to conduct rabies diagnostics using field-based diagnostics tools such as Direct Rapid Immunohistochemical Test (dRIT) and Lateral Flow Devices (LFDs) as they are easy and quick on-site results with minimal training. These tools are suitable for decentralized testing and enhancing surveillance system, reducing underreporting, and informing local action [20].
Rabies remains a significant burden in Zambia, particularly in rural communities where access to post-exposure prophylaxis (PEP) and diagnostic services is limited. Dog-mediated rabies has been prioritized among the top 10 zoonotic diseases of concern in Zambia by One Health stakeholders due to its 100% case fatality rate and preventability through mass dog vaccination. The findings of this study provides evidence for policy action and investment by the Department of Veterinary Services (DVS) to accelerate efforts towards the global goal of eliminating dog-mediated human rabies by 2030 [21].
Study limitations
This study relied on passive surveillance data, which may underestimate rabies incidence due to underreporting, especially in rural areas. Diagnostic capacity and sample submission varied across regions, potentially biasing spatial patterns. The study also lacked data on rabies cases in humans, which could affect transmission dynamics. Lastly, the vaccinations per month may not fully represent the impact of mass dog vaccination efforts. Future research should include active surveillance and broader ecological and socio-economic factors to enhance rabies control strategies.
In conclusion, this study provides evidence of both seasonal and geographic variation in dog rabies cases across Zambia. These findings reinforce the need for a comprehensive, multisectoral approach involving public health, veterinary, and environmental sectors under the One Health framework. Strengthening vaccination, surveillance, diagnostic capacity, and public awareness will be critical to achieving zero human deaths from dog-mediated rabies by 2030, in line with the global goal. The spatial and temporal insights generated in this research can guide national and subnational decision-makers to deploy targeted, timely, and cost-effective interventions to eliminate rabies as a public health threat in Zambia.
What is already known about the topic
What this study adds
Acknowledgement is extended to the Zambia National Public Health (ZNPHI), Zambia Field Epidemiology Training Program, and Ministry of Fisheries and Livestock – National Livestock Epidemiology Information Centre (NALEIC) and the Central Veterinary Research Institute (CVRI), their support and collaboration in providing data and technical input for this study
| Cluster | Cluster Type | Province | Dog Population | Cases | RR (95% CI) | Incidence (per 100,000) | p-value |
|---|---|---|---|---|---|---|---|
| 1 | High | Central Copperbelt Luapula Lusaka | 349,711 | 136 | 2.7 (2.07–3.53) | 38.9 | <0.001 |
| 2 | Low | North-Western Southern Western | 388,830 | 52 | 0.93 (0.71–1.22) | 13.3 | 0.602* |
| 3 | Low | Eastern | 122,079 | 14 | 0.80 (0.47–1.36) | 11.4 | 0.411* |
| 4 & 5 | Low | Northern Muchinga | 107,752 | 23 | 1.48 (0.93–2.36) | 21.3 | 0.099* |
| Cluster | Cluster Type | Province | LLR | p-value |
|---|---|---|---|---|
| 1 | High | Central Copperbelt Luapula Lusaka | 27.38 | <0.001 |
| 2 | Low | North-Western Southern Western | 14.62 | 0.001 |
| 3 | Low | Eastern | 4.99 | 0.028 |
| 4 & 5 | Low (NS) | Northern Muchinga | 0.15 | 0.800 |
| Variable | Coefficient | Incidence Rate Ratio (95% CI) | p-value |
|---|---|---|---|
| Intercept | 109.1623 | ~1.94×10⁴⁷ | — |
| Vaccinations per month | 0.9999 | ≈1.00 | Not sig. |
| February | 0.5664 | 1.77 (1.01 – 3.12) | 0.044 |
| March | 0.8323 | 2.32 (1.19 – 4.49) | 0.014 |
| April | 0.688 | 1.99 (0.58 – 6.86) | 0.258 |
| May | 0.9657 | 2.63 (0.99 – 6.96) | 0.052 |
| June | -0.0036 | ≈1.00 (0.56 – 1.78) | 0.991 |
| July | 0.4532 | 1.57 (0.72 – 3.44) | 0.253 |
| August | 1.3454 | 3.84 (0.81 – 18.3) | 0.086 |
| September | 0.5739 | 1.77 (0.67 – 4.69) | 0.245 |
| October | 0.0255 | 1.03 (0.42 – 2.51) | 0.946 |
| November | 0.8966 | 2.45 (1.55 – 3.86) | <0.001 |
| December | NA | — | — |