Research | Open Access | Volume 8 (3): Article 72 | Published: 08 Sep 2025
Views: 2,379
Menu, Tables and Figures
| Variable | 2017 N=226 n (%) | 2018 N=364 n (%) | 2019 N=497 n (%) | 2020 N=294 n (%) | 2021 N=449 n (%) | Total N=1,830 n (%) |
|---|---|---|---|---|---|---|
| Sex | ||||||
| Male | 106 (46.9) | 180 (50.5) | 236 (47.5) | 186 (63.3) | 213 (47.4) | 921 (50.3) |
| Female | 120 (53.1) | 184 (49.4) | 261 (52.5) | 108 (36.7) | 236 (52.6) | 909 (49.7) |
| Age | ||||||
| < 1 month | 5 (2.2) | 5 (1.4) | 4 (0.8) | 3 (1.0) | 6 (1.3) | 23 (1.3) |
| 1–11 months | 92 (40.7) | 110 (30.2) | 139 (28.0) | 106 (36.1) | 122 (27.1) | 569 (31.1) |
| 1–4 years | 129 (57.1) | 249 (68.4) | 354 (71.2) | 185 (62.9) | 321 (71.6) | 1,238 (67.6) |
| Sub-district | ||||||
| Gbiniyiri | 4 (1.8) | 25 (6.9) | 1 (0.2) | 2 (0.7) | 2 (0.4) | 34 (1.9) |
| Gindabuo | 22 (9.1) | 35 (9.6) | 75 (15.1) | 16 (5.4) | 56 (12.5) | 204 (11.1) |
| Kalba | 11 (4.9) | 4 (1.1) | 5 (1.0) | 2 (0.7) | 2 (0.4) | 24 (1.3) |
| Kong | 3 (1.3) | 0 (0.0) | 5 (1.0) | 0 (0.0) | 1 (0.2) | 9 (0.5) |
| Kulmasah | 8 (3.5) | 11 (3.0) | 59 (11.9) | 3 (1.0) | 40 (8.9) | 121 (6.6) |
| Kunfusi | 1 (0.4) | 0 (0.0) | 2 (0.4) | 4 (1.4) | 8 (1.8) | 15 (0.8) |
| Sawla | 138 (61.1) | 230 (63.2) | 281 (56.5) | 205 (69.7) | 295 (65.7) | 1,149 (62.8) |
| Tuna | 39 (17.3) | 59 (16.2) | 69 (13.9) | 62 (21.1) | 45 (10.0) | 274 (15.0) |
Table 1: Demographic distribution of under-5 pneumonia cases in Sawla Tuna K District, 2017–2021
| Year | Number of cases | Population at risk | Incident rate per 1000 |
|---|---|---|---|
| 2017 | 226 | 21,171 | 10.7 |
| 2018 | 364 | 21,616 | 16.8 |
| 2019 | 497 | 22,070 | 22.5 |
| 2020 | 294 | 22,533 | 13.0 |
| 2021 | 449 | 23,006 | 19.5 |
| Total | 1,830 | 110,396 | *16.5 |
*Average incidence rate per 1000
Table 2: Annual incidence of pneumonia among children under-5 years, Sawla Tuna Kalba District, 2017–2021
Isaac Issah1, Razak Gyesi Issahaku2,3, George Akowuah3, Magdalene Akos Odikro3, Alhassan Abukari1, Delia Akosua Bandoh3, Ernest Kenu3 , Chrysantus Kubio3,4
1Sawla Tuna Kalba District Health Directorate, Ghana Health Service, Savannah Region, Sawla, Ghana, 2Laboratory Department, Tamale Teaching Hospital, Tamale, Ghana, 3Ghana Field Epidemiology and Laboratory Training Program (GFELTP), School of Public Health, University of Ghana, Accra, Ghana, 4Savannah Regional Health Directorate, Ghana Health Service, Damango, Ghana
&Corresponding author: Issah Isaac, Sawla Tuna Kalba District Health Directorate, Ghana Health Service, Savannah Region, Sawla, Ghana, Email: isaac.epidmaths7@gmail.com
Received: 20 Dec 2024, Accepted: 05 Sep 2025, Published: 08 Sep 2025
Domain: Infectious Disease Epidemiology, Child Health
Keywords: Children under five years, pneumonia, surveillance, Sawla Tuna Kalba District, Ghana
©Isaac Issah et al. Journal of Interventional Epidemiology and Public Health (ISSN: 2664-2824). This is an Open Access article distributed under the terms of the Creative Commons Attribution International 4.0 License (https://creativecommons.org/licenses/by/4.0/), which permits unrestricted use, distribution, and reproduction in any medium, provided the original work is properly cited.
Cite this article: Isaac Issah et al., Trend and burden of pneumonia infections among children under-5 years in Sawla Tuna Kalba District, Ghana, 2017-2021. Journal of Interventional Epidemiology and Public Health. 2025;8(3):72. https://doi.org/10.37432/jieph-d-24-02060
Introduction: Pneumonia is a major public health problem among children under 5 globally. An estimated 740,180 under-5 pneumonia deaths were recorded worldwide in 2019. In Ghana, about 5,000 pneumonia-related deaths and an incidence of 0.22 episodes per child year are reported annually. We determined the trend and burden of pneumonia infections among children under-5 years from 2017 to 2021 in Sawla-Tuna-Kalba District of Ghana.
Methods: We conducted a retrospective data analysis of under-5 pneumonia cases using data extracted from the District Health Information Management System 2 (DHIMS 2) from 2017 to 2021. Data was cleaned and analysed using Microsoft Excel Version 2010. Age, sex, location and year of infection of the cases were extracted for analysis. Incidence rates, proportions and frequencies were generated and presented in tables and charts. Missed outbreaks during the period were determined through the calculation of the cumulative sum.
Results: A total of 1,830 cases were recorded within the period. More cases, 50.3% (921/1,830), were reported among males. Majority, 62.8% (1,149/1,830) of the cases were from Sawla sub-district. The average incidence rate was 17 cases per 1,000 children. Most of cases were detected in the harmattan and rainy seasons. Two possible outbreaks occurred and these were reported in September 2019 and November 2021.
Conclusion: There was an increasing trend and burden of pneumonia infections among children under-5 over the period. Possible outbreaks were reported over the period. Male children were more affected. A higher number of infections was being reported in the harmattan and rainy seasons. There should be continual surveillance which should be intensified during peak seasons by the district surveillance unit.
Pneumonia remains a leading public health problem among children under-5 years globally and particularly in sub-Saharan Africa. It remains one of the greatest contributors to childhood morbidity and mortality and a leading cause of vaccine-preventable child deaths worldwide[1]. Pneumonia affects people of all ages, with children under 5 years of age and children living in resource-poor settings where healthcare delivery is sometimes inadequate being the most at risk[2-3].
Although advancements in public health interventions have helped reduce the burden arising from pneumonia infections in children under 5 years, its burden still remains relatively high [4-5]. Globally, an estimated 808,920 paediatric pneumonia-associated deaths and more than 100 million childhood pneumonia episodes were recorded worldwide in 2017. The most affected areas were low- and middle-income countries [6]. In 2019, a total of 740, 180 under-5 pneumonia related deaths were recorded globally. Additionally, about 19% of these global under-5 pneumonia deaths occurred in children less than one month old [7]). The annual incidence of deaths due to pneumonia has been shown to exceed 100 per 100,000 children under-5 years. Pneumonia disease is also the third leading cause of deaths in this age group [9].
In Ghana an estimated 5,000 pneumonia-related deaths are reported annually with an estimated incidence of 0.22 episodes per child year [3-5]. A study on the prevalence of pneumonia in 2016 among children under 5 years old in the Komfo Anokye Teaching Hospital in Ghana indicated a prevalence of pneumonia of 18.4% with a mortality rate of 12.7% [8].
Factors that can influence the occurrence of pneumonia include seasonality and demographic patterns [10, 11 ]. A study on the prevalence of pneumonia among COVID-19 patients showed that a greater percentage of males (54%) were infected [10]. Also, a study in Tema Metropolis of Ghana identified that more (52%) males among under-5 years were affected (11). With regard to seasonality, studies in India and The Netherlands showed a greater burden of this disease during humid conditions and during peaks in winters and summer respectively [12,13].
The Global Action Plan for the Prevention and Control of Pneumonia and Diarrhea targets that there should be less than three child pneumonia deaths per 1,000 live births by 2025. To achieve this target, there is the need for a concerted effort from various stakeholders [6, 14]. In addition, the continuous monitoring of the burden and trend of pneumonia can also help inform the implementation of preventive interventions and control of this disease [5,11]. In Ghana, surveillance data on cases of pneumonia are reported using the monthly outpatient morbidity forms to help detect epidemics. In the Sawla Tuna Kalba District, there is limited research of pneumonia surveillance data in children less than 5 years old. This study aimed to determine the trend and burden of pneumonia infections among children under-5 years of age in the Sawla Tuna Kalba District from 2017-2021. The findings will help inform the implementation of preventive interventions to reduce the burden of this disease among children under-5 years in the district.
Study Design
A retrospective data analysis was employed for this study. The analysis was performed using aggregated secondary data of pneumonia infections in children under-5 years generated from the Ghana Health Service District Health Information Management System.
Study setting
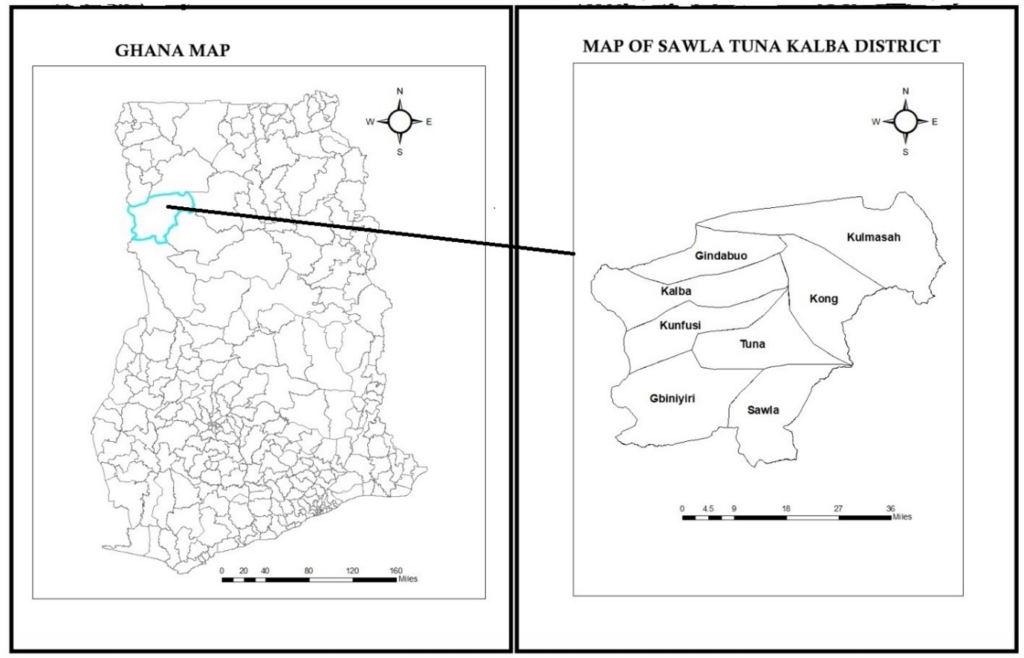
This study was carried out in the Sawla-Tuna-Kalba district, one of the seven (7) districts in the Savannah Region of Ghana (Figure 1). The district has eight (8) sub-districts with a current population of 117,446 according to estimates from the 2021 population and housing census. The eight sub-districts are Gbiniyiri, Gindabour, Kalba, Kong, Kulmasah, Kunfusi, Sawla and Tuna. The population of children under-5 years is 23,489. The health structure of the district consists of a Health Directorate that oversees the administration of the healthcare system in the various sub-districts. The district comprises of various health facilities dotted across the various length and breadth of the district. This consists of one district hospital, 1 polyclinic, 3 health centers and 15 functional Community-based Health Planning and Services facilities. The Sawla District Hospital serves as the only sentinel site for influenza surveillance in the region. The major economic activity of the inhabitants is farming and the crops cultivated include maize, beans, groundnut, and cassava/yam. The district lies in the savannah high plains with a rather short rainy season .from May to September each year. The erratic nature of the rainfall impacts poorly on crop production. Temperatures are lowest in the early parts of the dry season (December/January) and highest in the latter part of the dry season (March/April), with an average monthly maximum of 38.5℃and a daily highest temperature of 43℃ in March. The harmattan season starts from November to February [15].
Data Collection
The electronic surveillance dataset on under-five pneumonia from 2017 to 2021 was exported as a Microsoft Excel format from DHIMS 2 using the data visualizer module. Validated aggregate cases were then reported in the monthly OPD morbidity report in DHIMS 2 after a primary extraction from the consulting room registers. The data on pneumonia for this analysis were extracted from the monthly out-patient morbidity report dataset. The variables that were collected for analysis were age, sex, sub-district, months and year of occurrence of cases. A checklist was used to guide the retrieval of the relevant data from the system. Classification of a case as pneumonia is based on standard case definitions used at health facilities in case detection. The case definitions for pneumonia are classified as either a clinical or confirmed case definition. A clinical case is a child presenting with cough or difficulty breathing and any general danger sign, or chest in-drawing or stridor in a calm child. General danger signs for children 2 months to 5 years are: unable to drink or breastfeed, vomits everything, convulsions, lethargy, or unconsciousness. A confirmed case is a case that is confirmed using radiographic or laboratory methods [16]. The cases used in this analysis were mainly clinically diagnosed cases. The radiographic and laboratory methods are usually not available in many facilities.
Data Analysis
Descriptive analysis was used to summarise the extracted data, and the results were presented per the variables extracted. Microsoft Excel version 2016 and Epi Info version 7.2.6.0 were used for the analysis. The data extracted from the DHIMS 2 system contained age and sex classifications, which were adopted for our study. The age categorization included < 1 month, 1-11 months, and 1-4 years. Sex was categorized according to male and female. The years for evaluation were 2017, 2018, 2019, 2020 and 2021. The data was cleaned and all inconsistencies corrected. Blank records captured from the DHIMS 2 system were corrected and reported as zeros. Duplicated columns in the downloaded datasets were deleted. Data was verified using validated hardcopies of monthly out-patient morbidity reports from the District Health Information Unit.
A yearly estimation of the incidence rates were calculated for the various years under review. The population at risk was estimated using a rate of 20% of the general population. This estimate is the Ghana Health Service rate for children under-5 years in a population. Incidence of pneumonia infections for each year was calculated per 1,000 population. The Ghana Statistical Service population estimates as populated in DHIMS 2 for the year 2021 were used as a baseline for determining the populations for the previous years under study. The formula used for the calculation of the incidence rate was adopted from the formula for incidence rate calculations as outlined by the Centres for Disease Control and Prevention. This was calculated as the number of cases registered within the period divided by the population at risk per 1,000 population [17].
Also, a cumulative monthly time trend data analysis of all reported cases was performed which was presented as a line graph. The various peaks of pneumonia occurrences were detected for the various years. In addition, we used computed threshold (C2) Cumulative sum values to determine any missed outbreaks that may have occurred within the study period. C2 represents the baseline number of cases and this was calculated using the formula; C2= Mean + 3*standard deviations of 7 surveillance points before a two months lag. The number of pneumonia cases were then compared to the number expected to be reported in a given timeframe to detect any missed outbreaks.
Ethical Consideration
Permission to use the data for the study was granted by the Savannah Regional Health Directorate. Approval was also received from the Sawla Tuna Kalba District Health Directorate for the use of the data. No ethical clearance was obtained from an ethical review committee. The study utilized aggregate data, which did not have personal identifiers. The Ghana Health Service institutional data requirements were strictly adhered to to ensure confidentiality of the dataset. The data was not shared with any third party.
A total of 1,830 cases were reported over the period. The highest number of cases within the five-years was detected in 2019 (497), while the lowest number of cases (226) was detected in 2017. There were more male reported cases, 50.3% (921/1,830), over the period as compared to females. Additionally, about 67.6% (1238/1830) of pneumonia infections were reported in the 1-4 years age category, while about one-third, 31.1% (569/1,830) were among the 1-11 months. With respect to the spatial distribution of the cases, the Sawla Sub-district reported most 62.8% (1149/1,830) of the cases, followed by the Tuna Sub-district 15.0% (274/1,830) (Table 1).
An average incidence rate of 16.6 cases per 1,000 children was recorded over the period. The highest incidence was reported in the year 2019 ( 22.5 cases per 1,000 children), while the lowest incidence rate was reported in 2017 (10.7 cases per 1,000 children). There was a generally increasing trend of the incident risk of pneumonia cases from 2017 to 2021, which peaked in the year 2019 (Table 2).
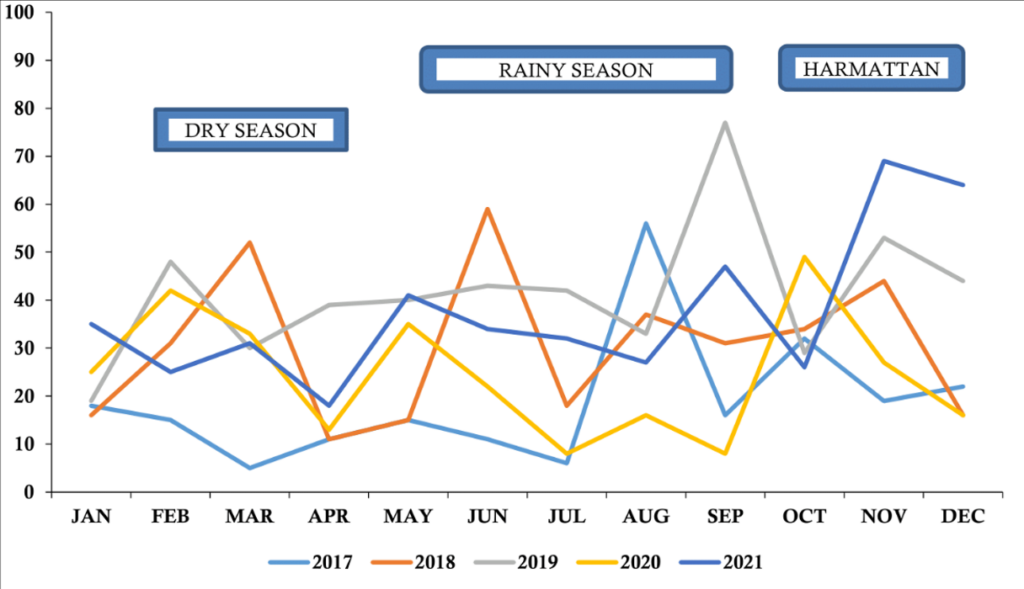
A monthly time trend of infections showed that the highest number of cases was in September 2019, while the lowest number was reported in March 2017. There were seasonal fluctuations in the number of infections. The highest peaks of occurrences for each year were August 2017, June 2018, September 2019, October 2020 and November 2021. These peaks were reported mainly during the harmattan and rainy seasons (Figure 2).
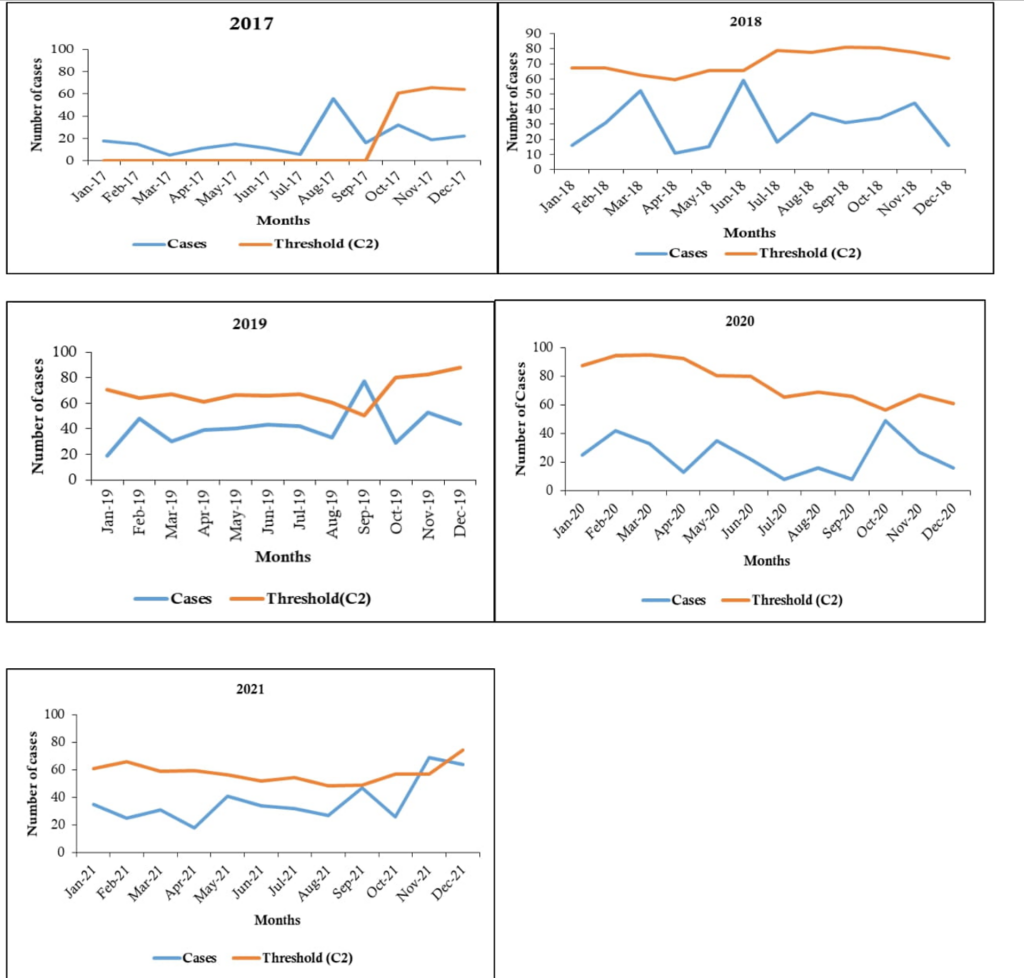
An analysis of monthly pneumonia data compared with threshold values indicated that the district had two episodes of undetected pneumonia outbreaks during the study period. The first observed situation of cases exceeding the expected threshold was in September 2019. This was further observed in November 2021. Follow-up to the District Health Directorate indicated that these probable outbreaks within the period were not detected by the system (Figure 3).
This study analyzed pneumonia surveillance data in children under 5 years in Sawla-Tuna-Kalba District for the years 2017 to 2021 using data extracted from the DHIMS 2 database. The results from this study show that the trend in number of cases and incidence of pneumonia in children under-5 years generally increased over the study period. This is despite a good and comprehensive expanded programme on immunisation that targets children under-5 years in the district with pneumococcal conjugate vaccines. Globally, there was a general reduction in the incidence of childhood pneumonia by 30% and a 51% reduction in mortalities during the period of the Millennium Development Goal (2000-2015) and this is expected to further assume a decreasing trend due to various public health interventions put in place[5]. The World Health Organisation action plan targets a 75% reduction in the incidence of pneumonia by 2025 from the 2010 levels. The increasing incidence rate in this study may hamper the achievement of this target in the district if effective preventive efforts such as vaccinations and health promotion activities are not intensified. This increasing incidence may be attributable to factors such as exposure to various environmental pollutants, such as smoke, which increases the risk of infections. Similar factors have been shown to significantly contribute to increased risk of community-acquired infections in the Netherlands and United states [18]. Malnutrition and lack of vaccination and improper vaccine cold chain practices, making vaccines lose their potency, may be some of the possible factors contributing to this increasing trend in the district. A systematic review and meta-analysis identified that risk of death from childhood pneumonia dramatically increases with malnutrition severity [19)]
The results from this analysis indicate a greater percentage of pneumonia infections among male children. Our present findings are consistent with results from other studies, where males are generally more infected with pneumonia. In the Savelegu-Nanton District, male children constituted 54.2% of infections, while in the Tema metropolis, males constituted 51% of infections during an analysis of the pneumonia data in those districts [11,21]. Genetic and biological differences generally influence the progression and outcome of diseases. Sexual dimorphism in bacterial infections has been mainly attributed to the differential levels of sex hormones between males and females, as well as to genetic factors. In general, males have been shown to be more susceptible to respiratory bacterial diseases as compared to females [20]. A possible reason for this disparity is the production of macrophages, which is boosted by the presence of the female hormone oestrogen, which is the first response to killing bacteria in the lungs [21]. Secondly, the cultural dynamics of the district expose the male child more to outdoor conditions. While the male child may be allowed to go out and play, female children may be restricted from going outdoors.
In our study, we found that the highest infections of pneumonia was found among children 1-4 years. Our finding is discordant with a study in India, where pneumonia infections were more common in children between 2 and 12 months of age compared with children between 13 and 60 months of age [23]. Children who are less than one year old are more likely to receive antigens that protect against various forms of pneumonia during immunisation services. The tendency of children above a year to have missed doses remains relatively high, which may weaken their immune system. Additionally, children aged 1-5 years are more active and have a high risk of being exposed to various risk factors associated with pneumonia, which could result in the high number of cases recorded. This could account for the high number of cases reported in this age group in our study.
Pneumonia has also been shown to exhibit distinct seasonal variations with climatic conditions such as temperature, rainfall, and humidity influencing the rates of transmission. Our study identified a generally increasing trend of infections through the rainy season, with the highest peak observed in the harmattan season. The harmattan season is mostly characterised by cold weather, high humid conditions and lots of dust particles from the Sahara Desert. These factors generally increase the likelihood of contracting acute respiratory tract infections, putting human health at risk [24]. These findings correlate with a study in India which identified that pneumonia in children exhibited significant seasonal variations [12]. In The Netherlands, temporal dynamics of pneumonia hospitalisations have also displayed a strong seasonal pattern with peaks in winter season [13]. In addition, an analysis of patterns of frequently diagnosed paediatric admissions in the Volta Region of Ghana identified that majority of pneumonia cases in the northern part of the region were diagnosed during the first and second quarters of the year which is different from our findings. However in the central and Coastal belts of the region, the third and fourth quarters reported the highest incidence of reported pneumonia hospitalisations in children [25] which is in line with this current research study . The savannah and coastal areas share similar weather patterns such as strong winds and humid conditions which could account for the similarities seen. There is the need for intensified targeted health campaigns on pneumonia during such peak seasons to help create awareness. Additionally, adequate healthcare preparedness and sufficient supply of pneumonia treatment supplies to health facilities during such seasons can help prevent work overload and ensure prompt treatment. Environmental and behavioural policies such as reduction of bush burning and wearing of face masks during harmattan seasons can also help reduce risk of infections.
The Sawla sub-district had the highest reported cases of pneumonia infections within the study period. This could be due to the fact that the sub-district has the highest population density. In addition, the district hospital is located in this sub-district, which might influence the referral of such cases to the facility. The standard of care and availability of equipment such as pulse oximeters and oxygen supplies at the facility may also influence patients from other sub-districts seeking medical care in the Sawla sub-district, which might have influenced the high numbers reported.
A comparison of reported monthly cases with the computed cumulative sum (C2) threshold for the period under study revealed two probable outbreaks of pneumonia. These were recorded within the rainy and harmattan seasons. These excesses occurred in the months of September 2019 and November 2021. Follow-up to the District Health Directorate indicated that these probable outbreaks were not detected by the system. A study in Tema Metropolis of Ghana identified similar patterns of outbreaks during the harmattan period (11). It may therefore be worthwhile to keep heightened surveillance on pneumonia cases continuously, with intensified surveillance during these periods.
Limitations
A potential limitation of this study is that there may be biases in the data reported with issues of under-reporting or over-reporting of cases since secondary data was used in the analysis. To mitigate this, validated out-patient morbidity reports from various sub-districts were compared with the data entries and necessary corrections made. In addition, the dataset report from DHIMS 2 does not indicate the severity of infections. There is also limited demographic information of participants in the dataset, which makes it difficult to make a more detailed analysis. We, however, focused on the key variables that came with the dataset for our analysis. There also remains the possibility of bias in the diagnosis. especially at the lower levels due to the unavailability of equipment to confirm the presence of pneumonia. We therefore limited our study to clinically confirmed cases that were reported in DHIMS 2. Despite these limitations, our study provides useful insights into the trend and burden of pneumonia in children under 5 years in the district.
This study revealed an increasing burden of pneumonia infections among children under 5 years in the district, with more male infections being reported. There was an average incidence rate of 17 cases per 1,000 recorded. The highest pneumonia infections were reported in the rainy and harmattan seasons. Two outbreaks of pneumonia occurred within the study period. We recommend continuous surveillance by the disease surveillance department on pneumonia infections among children under-5, which should be intensified during the harmattan and rainy seasons. The environmental health division of the district can also help implement measures such as the reduction of bush burning activities to help reduce the risk of infections.
What is already known about the topic
What this study adds
We would like to express our profound gratitude to the Savannah Regional Health Directorate and the Sawla-Tuna-Kalba District Health Directorate for granting us permission to use their data for this study. We also highly appreciate the immense guidance and contribution of the GFELTP in the drafting and review of the manuscript.
| Variable | 2017 N=226 n (%) | 2018 N=364 n (%) | 2019 N=497 n (%) | 2020 N=294 n (%) | 2021 N=449 n (%) | Total N=1,830 n (%) |
|---|---|---|---|---|---|---|
| Sex | ||||||
| Male | 106 (46.9) | 180 (50.5) | 236 (47.5) | 186 (63.3) | 213 (47.4) | 921 (50.3) |
| Female | 120 (53.1) | 184 (49.4) | 261 (52.5) | 108 (36.7) | 236 (52.6) | 909 (49.7) |
| Age | ||||||
| < 1 month | 5 (2.2) | 5 (1.4) | 4 (0.8) | 3 (1.0) | 6 (1.3) | 23 (1.3) |
| 1–11 months | 92 (40.7) | 110 (30.2) | 139 (28.0) | 106 (36.1) | 122 (27.1) | 569 (31.1) |
| 1–4 years | 129 (57.1) | 249 (68.4) | 354 (71.2) | 185 (62.9) | 321 (71.6) | 1,238 (67.6) |
| Sub-district | ||||||
| Gbiniyiri | 4 (1.8) | 25 (6.9) | 1 (0.2) | 2 (0.7) | 2 (0.4) | 34 (1.9) |
| Gindabuo | 22 (9.1) | 35 (9.6) | 75 (15.1) | 16 (5.4) | 56 (12.5) | 204 (11.1) |
| Kalba | 11 (4.9) | 4 (1.1) | 5 (1.0) | 2 (0.7) | 2 (0.4) | 24 (1.3) |
| Kong | 3 (1.3) | 0 (0.0) | 5 (1.0) | 0 (0.0) | 1 (0.2) | 9 (0.5) |
| Kulmasah | 8 (3.5) | 11 (3.0) | 59 (11.9) | 3 (1.0) | 40 (8.9) | 121 (6.6) |
| Kunfusi | 1 (0.4) | 0 (0.0) | 2 (0.4) | 4 (1.4) | 8 (1.8) | 15 (0.8) |
| Sawla | 138 (61.1) | 230 (63.2) | 281 (56.5) | 205 (69.7) | 295 (65.7) | 1,149 (62.8) |
| Tuna | 39 (17.3) | 59 (16.2) | 69 (13.9) | 62 (21.1) | 45 (10.0) | 274 (15.0) |
| Year | Number of cases | Population at risk | Incident rate per 1000 |
|---|---|---|---|
| 2017 | 226 | 21,171 | 10.7 |
| 2018 | 364 | 21,616 | 16.8 |
| 2019 | 497 | 22,070 | 22.5 |
| 2020 | 294 | 22,533 | 13.0 |
| 2021 | 449 | 23,006 | 19.5 |
| Total | 1,830 | 110,396 | *16.5 |