Research | Open Access | Volume 9 (4): Article 181 | Published: 09 Nov 2026

Views: 192
Menu, Tables and Figures
| Variables | 2019 | 2020 | 2021 | 2022 | 2023 | Average population |
|---|---|---|---|---|---|---|
| Sex | ||||||
| Female | 22,616 | 23,139 | 23,378 | 23,869 | 24,370 | 23,474 |
| Male | 20,627 | 21,104 | 21,322 | 21,770 | 22,227 | 21,410 |
| Age (in months) | ||||||
| 0–11 | 8,960 | 9,168 | 9,262 | 9,457 | 9,655 | 9,300 |
| 12–59 | 34,283 | 35,076 | 35,438 | 36,182 | 36,942 | 35,584 |
| District | ||||||
| Anloga | 10,846 | 11,096 | 10,533 | 10,755 | 10,980 | 10,842 |
| Central Tongu | 8,100 | 8,286 | 9,302 | 9,497 | 9,697 | 8,976 |
| North Tongu | 12,149 | 12,430 | 12,309 | 12,567 | 12,831 | 12,457 |
| South Tongu | 12,148 | 12,432 | 12,556 | 12,819 | 13,089 | 12,609 |
| Annual population | 43,243 | 44,244 | 44,700 | 45,638 | 46,597 | 44,884 |
| Variables | 2019 n (%) | 2020 n (%) | 2021 n (%) | 2022 n (%) | 2023 n (%) | Total N (%) |
|---|---|---|---|---|---|---|
| Sex | ||||||
| Female | 3,949 (46.8) | 2,923 (45.4) | 3,724 (46.7) | 3,450 (46.0) | 4,102 (47.0) | 18,148 (46.4) |
| Male | 4,497 (53.2) | 3,518 (54.6) | 4,242 (53.3) | 4,049 (54.0) | 4,631 (53.0) | 20,937 (53.6) |
| Age (in months) | ||||||
| 0–11 | 2,579 (30.5) | 2,018 (31.3) | 2,518 (31.6) | 2,416 (32.2) | 2,758 (31.6) | 12,289 (31.4) |
| 12–59 | 5,867 (69.5) | 4,423 (68.7) | 5,448 (68.4) | 5,083 (67.8) | 5,975 (68.4) | 26,796 (68.6) |
| District | ||||||
| Anloga | 1,352 (16.0) | 1,035 (16.1) | 1,175 (14.8) | 1,099 (14.7) | 1,120 (12.8) | 5,781 (14.8) |
| Central Tongu | 3,120 (36.9) | 2,449 (38.0) | 3,469 (43.5) | 3,180 (42.4) | 3,586 (41.1) | 15,804 (40.4) |
| North Tongu | 1,583 (18.7) | 1,449 (22.5) | 1,397 (17.5) | 1,208 (16.1) | 2,004 (22.9) | 7,641 (19.5) |
| South Tongu | 2,391 (28.3) | 1,508 (23.4) | 1,925 (24.2) | 2,012 (26.8) | 2,023 (23.2) | 9,859 (25.2) |
| Variable | 2019 IR (95% CI) | 2020 IR (95% CI) | 2021 IR (95% CI) | 2022 IR (95% CI) | 2023 IR (95% CI) | Five-year cumulative IR (95% CI) |
|---|---|---|---|---|---|---|
| Sex | ||||||
| Female | 175 (169 – 180) | 126 (122 – 131) | 159 (155 – 164) | 145 (140 – 149) | 168 (164 – 173) | 773 (761 – 784) |
| Male | 218 (212 – 224) | 167 (161 – 172) | 199 (194 – 204) | 186 (181 – 191) | 208 (203 – 214) | 978 (964 – 991) |
| Age (in months) | ||||||
| 0-11 | 288 (277 – 299) | 220 (211 – 229) | 272 (263 – 281) | 255 (247 – 264) | 286 (277 – 295) | 1321 (1298 – 1345) |
| 12-59 | 171 (167 – 176) | 126 (122 – 129) | 154 (150 – 158) | 140 (137 – 144) | 162 (158 – 166) | 753 (744 – 762) |
| District | ||||||
| Anloga | 125 (118 – 131) | 93 (88 – 99) | 112 (106 – 118) | 102 (96.5 – 108) | 102 (96 – 108) | 533 (520 – 547) |
| Central Tongu | 385 (371 – 398) | 296 (284 – 307) | 373 (363 – 383) | 335 (325 – 344) | 370 (360 – 380) | 1761 (1733 – 1788) |
| North Tongu | 130 (124 – 137) | 117 (110 – 123) | 113 (108 – 119) | 96 (91 – 101) | 156 (150 – 163) | 613 (600 – 627) |
| South Tongu | 197 (189 – 205) | 121 (115 – 128) | 153 (147 – 160) | 157 (151 – 163) | 155 (148 – 161) | 782 (767 – 797) |
| IR: Incidence Rate per 1,000 CI: 95% Confidence Interval | ||||||
Table 3: Sex, age and district-specific incidence rate of diarrhea among children aged under five in flood-affected districts, Volta Region, 2019 to 2023
Chrysantus Kubio1,2, Samuel Adolf Bosoka2,3,&, Joseph Yaw Jerela3, Amatus Nambagyira3, Emmanuel Yaw Bonsu1, Felix Kwame Korang1, Victor Zeng4, Maxwell Afetor4, Williams Azumah Abanga5, Senanu Kwesi Djokoto1, Frank Baiden2
1Volta Regional Health Directorate, Ghana Health Service, Ho, Ghana, 2Department of Epidemiology and Biostatistics, Fred N. Binka School of Public Health, University of Health and Allied Sciences, Ho, Ghana, 3Disease Surveillance Unit, Volta Regional Health Directorate, Ho, Ghana, 4Health Information Unit, Volta Regional Health Directorate, Ghana Health Service, Ho, Ghana, 5Saboba District Health Directorate, Ghana Health Service, Saboba, Ghana
&Corresponding author: Samuel Adolf Bosoka, Department of Epidemiology and Biostatistics, Fred N. Binka School of Public Health, University of Health and Allied Sciences, Ho, Ghana, Email: samuelbosoka@gmail.com
Received: 24 Jul 2025, Accepted: 05 Nov 2026, Published: 09 Nov 2026
Domain: Infectious Disease Epidemiology
Keywords: Diarrhea; incidence; Akosombo floods; Volta Region
©Chrysantus Kubio et al. Journal of Interventional Epidemiology and Public Health (ISSN: 2664-2824). This is an Open Access article distributed under the terms of the Creative Commons Attribution International 4.0 License (https://creativecommons.org/licenses/by/4.0/), which permits unrestricted use, distribution, and reproduction in any medium, provided the original work is properly cited.
Cite this article: Chrysantus Kubio et al., Diarrhoea incidence and outbreak alerts among children under five before, during and after major flooding in Ghana’s Volta Region, 2019–2023. Journal of Interventional Epidemiology and Public Health. 2026; 9(4):187. https://doi.org/10.37432/jieph-d-25-00163
Introduction: Diarrheal disease remains a major cause of death in children under five years globally, with the highest burden in low- and middle-income countries. In October 2023, controlled dam spillage caused severe flooding in Ghana’s Volta Region and displaced 26,000 people. This study assessed potential diarrhoea outbreaks and examined incidence and temporal trends among children under five years in flood-affected districts from 2019 to 2023.
Methods: We conducted a descriptive secondary data analysis using diarrheal surveillance data from 2019–2023 in the District Health Information Management System II (DHIMS II). We applied the Early Aberration Reporting System (EARS) C2 algorithm to detect unusual increases in cases before, during, and after the October 2023 floods. We calculated the cumulative incidence rate as the number of cases per 1,000 under-five population and summarized the data by person, place, and time.
Results: Outbreaks occurred in all districts across the five-year period, but none were detected during or immediately after the October 12, 2023, floods. A total of 39,085 diarrheal cases were reported, with a five-year cumulative incidence of 871 per 1,000 population (95% CI: 867.6–873.9). Infants aged 0–11 months and males had the highest incidence, at 1,321 per 1,000 (95% CI: 1,298–1,345) and 978 per 1,000 (95% CI: 964–991), respectively. Central Tongu District recorded the highest incidence rate (1,761 per 1,000; 95% CI: 1,733–1,788). Incidence rate fluctuated yearly, peaking in 2019 and reaching its lowest in 2020.
Conclusion: Targeted WASH and breastfeeding interventions are essential for high-risk groups, particularly infants under one year and male children. The Volta Regional Health Directorate should integrate diarrheal disease surveillance into flood preparedness plans.
Diarrhoeal disease remains a significant global threat, particularly for children under five years. It is the third leading cause of death in this age group, claiming an estimated 443,832 lives annually [1]. While global cases have decreased in recent decades, the burden remains high in low-and middle-income countries, contributing to substantial childhood mortality [2–5].
In 2017, an estimated 78.4 deaths per 100,000 children under five occurred worldwide due to diarrhoea (95% CI: 70.1–87.1). This figure, however, masks substantial geographic disparities [6]. While countries like Singapore reported a negligible rate of 0.1 deaths per 100,000 children, the Central African Republic experienced a staggering 685.8 deaths per 100,000 children (95% CI: 385.7–1082.0) [6].
The Sub-Saharan Africa region bears the brunt of this burden, accounting for a disproportionate share of global diarrhoea-related child deaths. In 2017, the region recorded an estimated 334,306 deaths, translating to a mortality rate of 204.6 per 100,000 children (174.7 to 238.0) [6]. In Ghana, diarrheal illness is the fourth leading cause of death among children under five, accounting for approximately 9% of all child mortality in this age group [4].
Data on childhood diarrheal disease incidence in Ghana remains limited. While several studies have investigated the prevalence of childhood diarrhoea and its associated risk factors [7–11], recent estimates suggest a concerning prevalence of 13% [12]. Moreover, treatment adherence remains low, with only 24% of affected children receiving both recommended treatments (oral rehydration salts and zinc supplements) and continued feeding[12].
Flooding is a suspected risk factor for diarrhoeal infections, although the evidence is not conclusive. Studies in Bangladesh, China, the United States, and Ecuador have shown a link between flooding or heavy rainfall and increased diarrhoea incidence [13–19]. Few studies in West Africa, including Ghana, have examined the health impacts of flooding or climate-related flood events, particularly with respect to waterborne diseases and malnutrition [20,21]. Although diarrhoea is a major cause of morbidity among children under five in Ghana, no empirical study has assessed diarrheal patterns before, during, or after major flooding events.
In October 2023, controlled releases from the Akosombo Dam caused significant flooding in four districts in the Volta Region, displacing an estimated 26,000 people and disrupting essential healthcare services [22]. In response, the Volta Regional Health Directorate conducted a comprehensive analysis of diarrhoea surveillance data to identify patterns, trends, incidence rates, and potential outbreaks to support timely control measures. To our knowledge, no prior study has systematically examined the distribution, temporal trends, or incidence of diarrheal disease among children under five in flood-affected districts of Ghana. This study addresses this gap by assessing potential diarrhoea outbreaks and analysing the incidence and temporal trends among children under five in flood-affected districts from 2019 to 2023.
Study design and setting
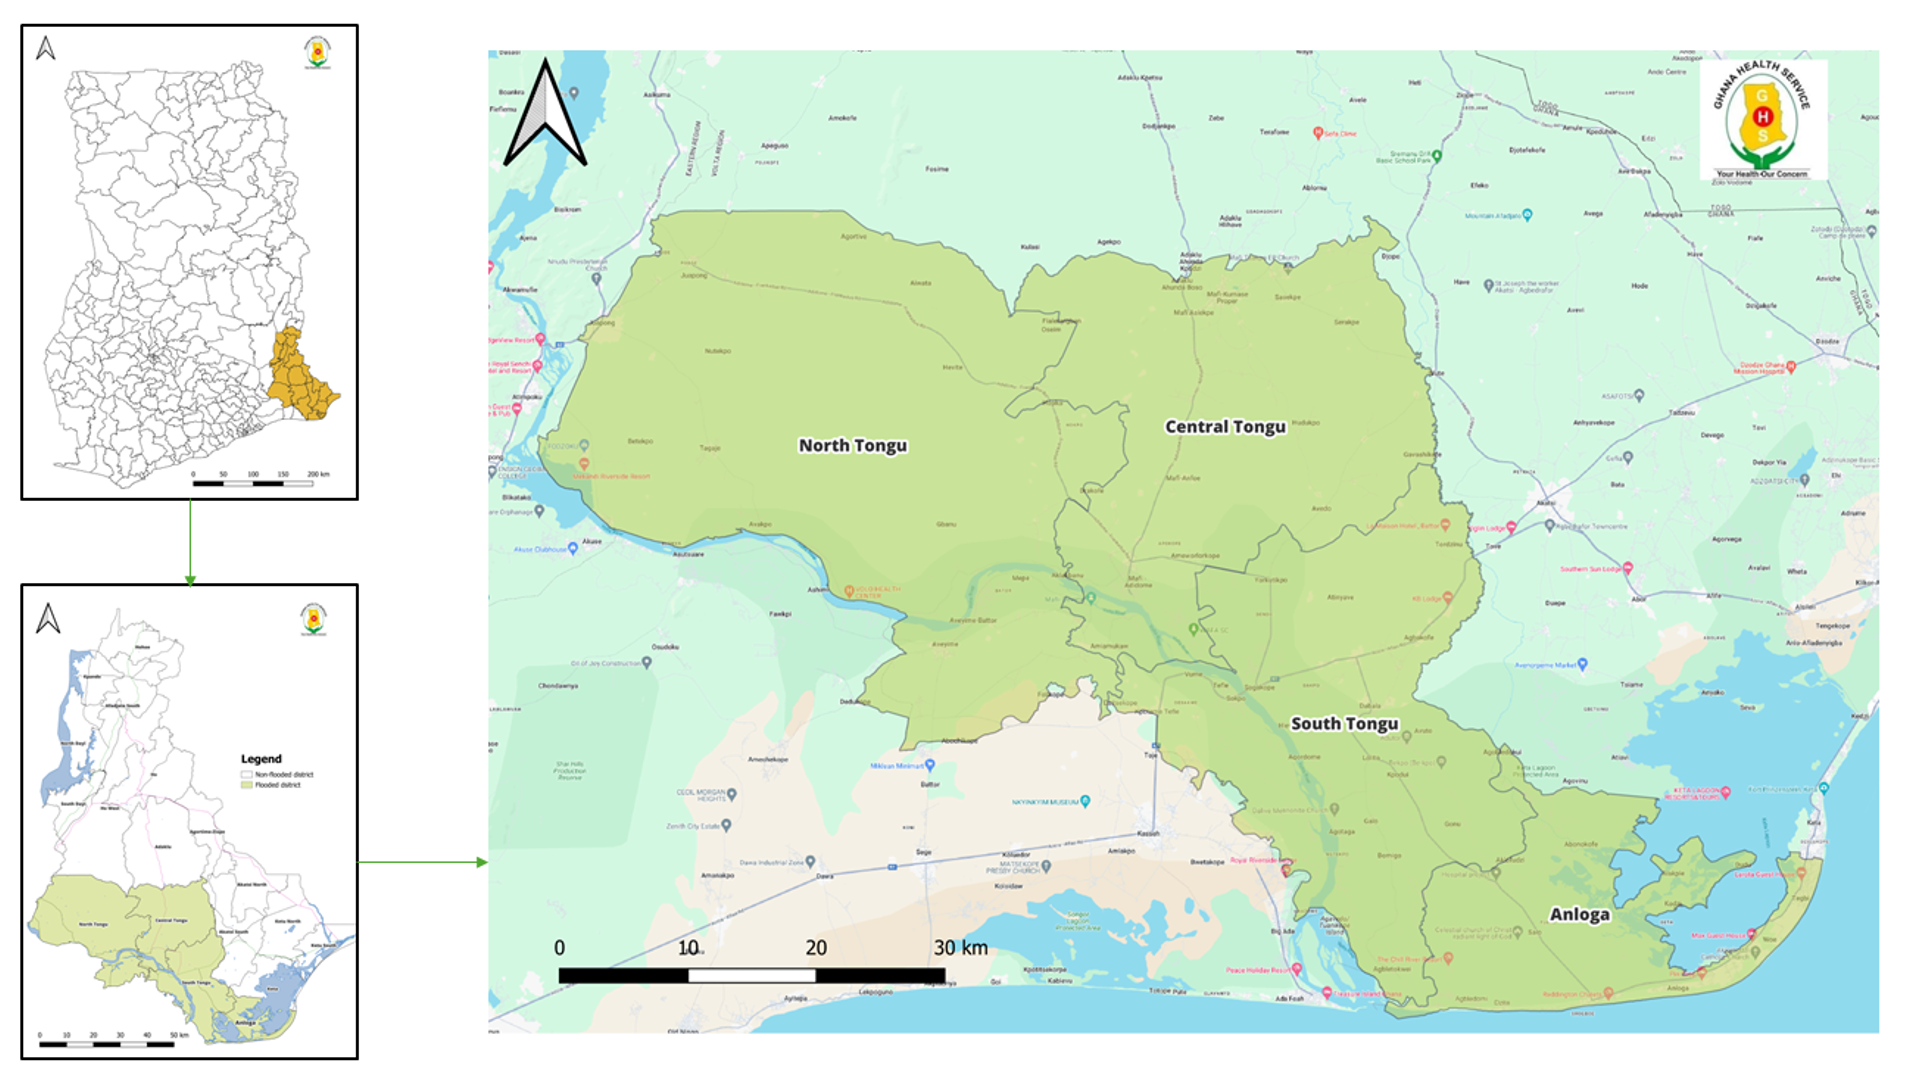
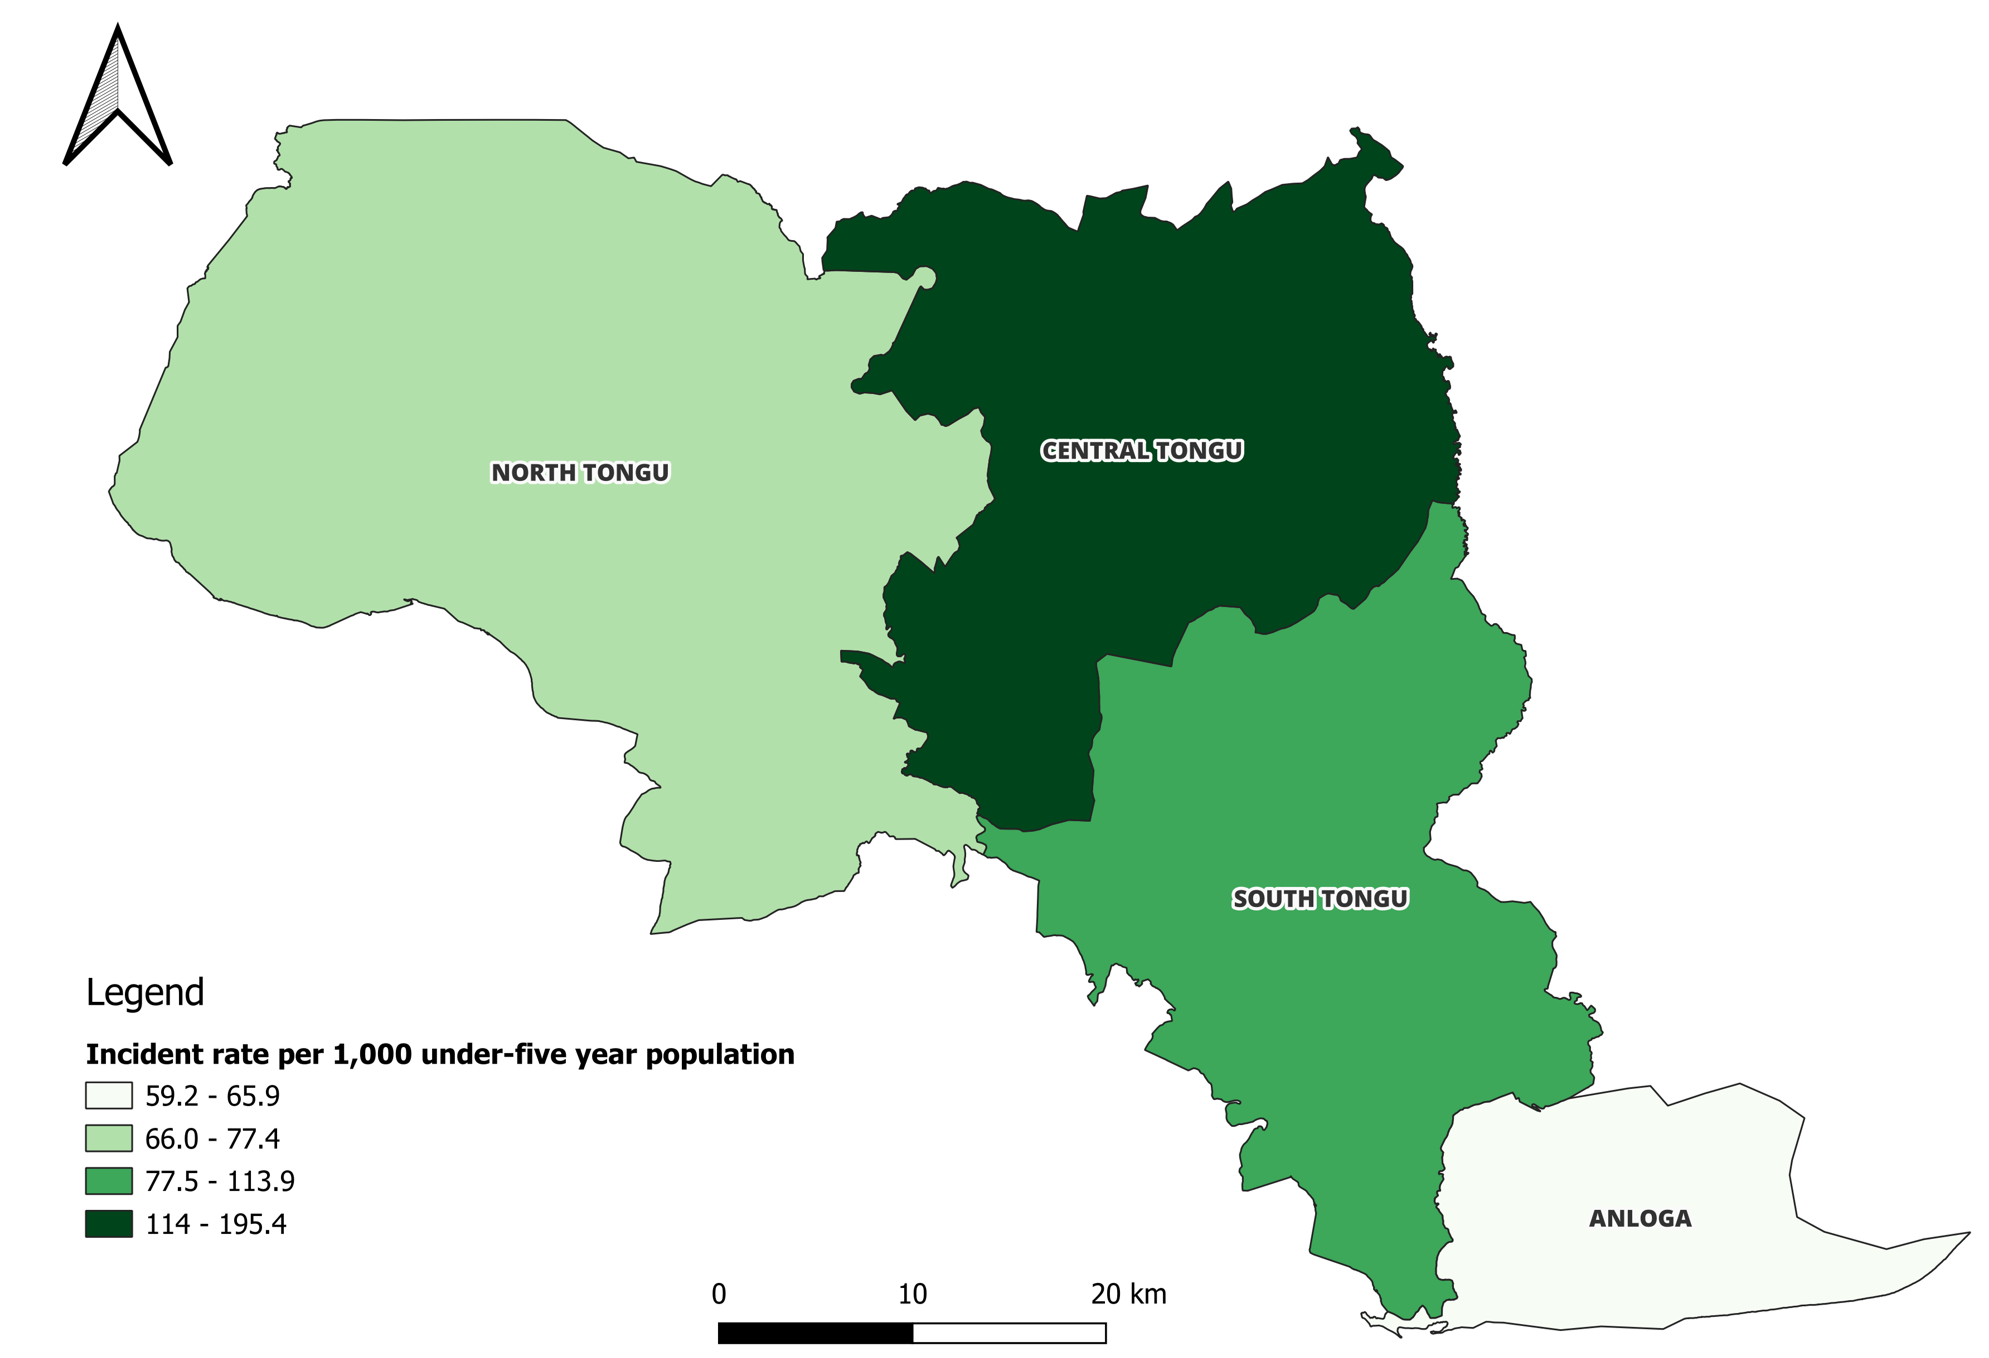
We undertook a descriptive secondary data analysis of reported diarrhoea among children under five years of age in the Volta Region of Ghana from 2019 to 2023. The study was conducted across four districts in the Volta Region of Ghana: Central Tongu, North Tongu, South Tongu, and Anloga, all affected by flooding from the Akosombo Dam spillage (Figure 1). The North Tongu, Central Tongu, and South Tongu Districts, which border the Volta Lake, are particularly vulnerable to floods, while Anloga District, with its proximity to the Keta Lagoon, also experiences occasional flooding in some communities along the lagoon. Among these districts, South Tongu, Central Tongu, and North Tongu have district hospitals providing healthcare services to the population and flood-affected victims. The Anloga district relies on health centres and Community-based Health Planning and Service (CHPS) Compounds for basic healthcare services.
The Akosombo Dam-induced flooding was triggered by the controlled spillage of the dam from 15 September to 31 October 2023 (approximately 45 days), with the most extensive flooding occurring between mid-October and early November 2023. In this study, flood exposure was defined as residence in, or operation of a health facility within, communities affected by the Akosombo Dam-induced flooding during this period. The impact varied across districts, with North Tongu experiencing the greatest severity, affecting approximately 20,000 people, while no flood-related displacement was reported in Anloga District. Overall, 124 communities were affected, including 69 in North Tongu, 42 in South Tongu, and 13 in Central Tongu. Nineteen safe havens were established, with 15 in North Tongu and four in Central Tongu. The flooding disrupted five peripheral health facilities along the Volta Lake, including three in North Tongu and two in Central Tongu, affecting essential health service delivery.
In response to the emergency, the Volta Regional Health Promotion Unit implemented a coordinated flood response. The team developed and disseminated key messages on diarrheal disease prevention and other flood-related health risks through media briefings, radio discussions, and community awareness campaigns in the affected areas and safe havens. Water, Sanitation, and Hygiene (WASH) protocols were also distributed to healthcare workers, Community-Based Surveillance Volunteers, and health facilities to strengthen preparedness. The Volta Regional Health Directorate partnered with Zoomlion Ghana to disinfect mobile clinics and shelters. In addition, the Ghana Community Water supplied safe drinking water to the affected districts.
Data sources
We used data from the DHMIS-II database. The DHMIS-II database is a national electronic database that collects, collates, and manages routine health service data in an aggregated form for the Ghana Health Service. Detailed descriptions of the database have been provided elsewhere [23,24].
Case definition
A diarrhoea case was defined according to the Ghana Integrated Disease Surveillance and Response (IDSR) guidelines as the passage of three or more loose or watery stools within a 24-hour period [25].
Data extraction
We extracted monthly diarrhoea data from the Outpatient Department (OPD) morbidity reports in the DHIMS-II database. The pivot table function in the DHIMS-II data visualizer, which contains predefined fields such as data type, reporting period, and district, was used to retrieve variables for the study. These included the number of reported cases, deaths, age, sex, and reporting district. End-of-year population figures were also obtained from DHIMS-II. A detailed description of the extraction procedure is provided in our previous publication [23,24]. Monthly diarrhoea data from 2019 to 2023 were exported into Microsoft Excel 2021 for cleaning and analysis.
Data quality assessment
We verified reporting completeness across all four districts for the entire study period. Reporting completeness exceeded 95% in all districts, confirming that health facilities consistently submitted complete reports. We found no missing data in the extracted dataset. These quality checks confirmed the data were representative and suitable for analysis.
Data analysis
The exported data were analyzed descriptively by person, place, and time using frequencies and proportions. We used age- and sex-specific population estimates for the Volta Region from the 2020 Population and Housing Census (Ghana Statistical Service) to derive the under-five population denominators [26]. These estimates supported the calculation of cumulative, age-specific, and sex-specific incidence rates of under-five diarrhoea. Table 1 presents the sex, age, and district-level population figures used for these calculations.
Cumulative incidence
Cumulative incidence rates were calculated by dividing the total number of diarrhoea cases recorded each year by the number of children under five years of age, per 1,000. The overall cumulative incidence rate was determined by dividing the total number of cases over the five years by the total number of children under five years during the same period, per 1,000. The 95% confidence intervals were calculated in Stata using the epidemiological calculator with a Poisson distribution.
We utilized the Quantum Geographic Information System (QGIS) to create a choropleth map that visually represents the incidence rate of diarrhea by district. The district shapefiles for the Volta Region were sourced from the Ghana Demographic and Health Survey report. We then linked the district names and the estimated incidences of diarrhoea to these shapefiles using the join tool in QGIS.
Outbreak detection
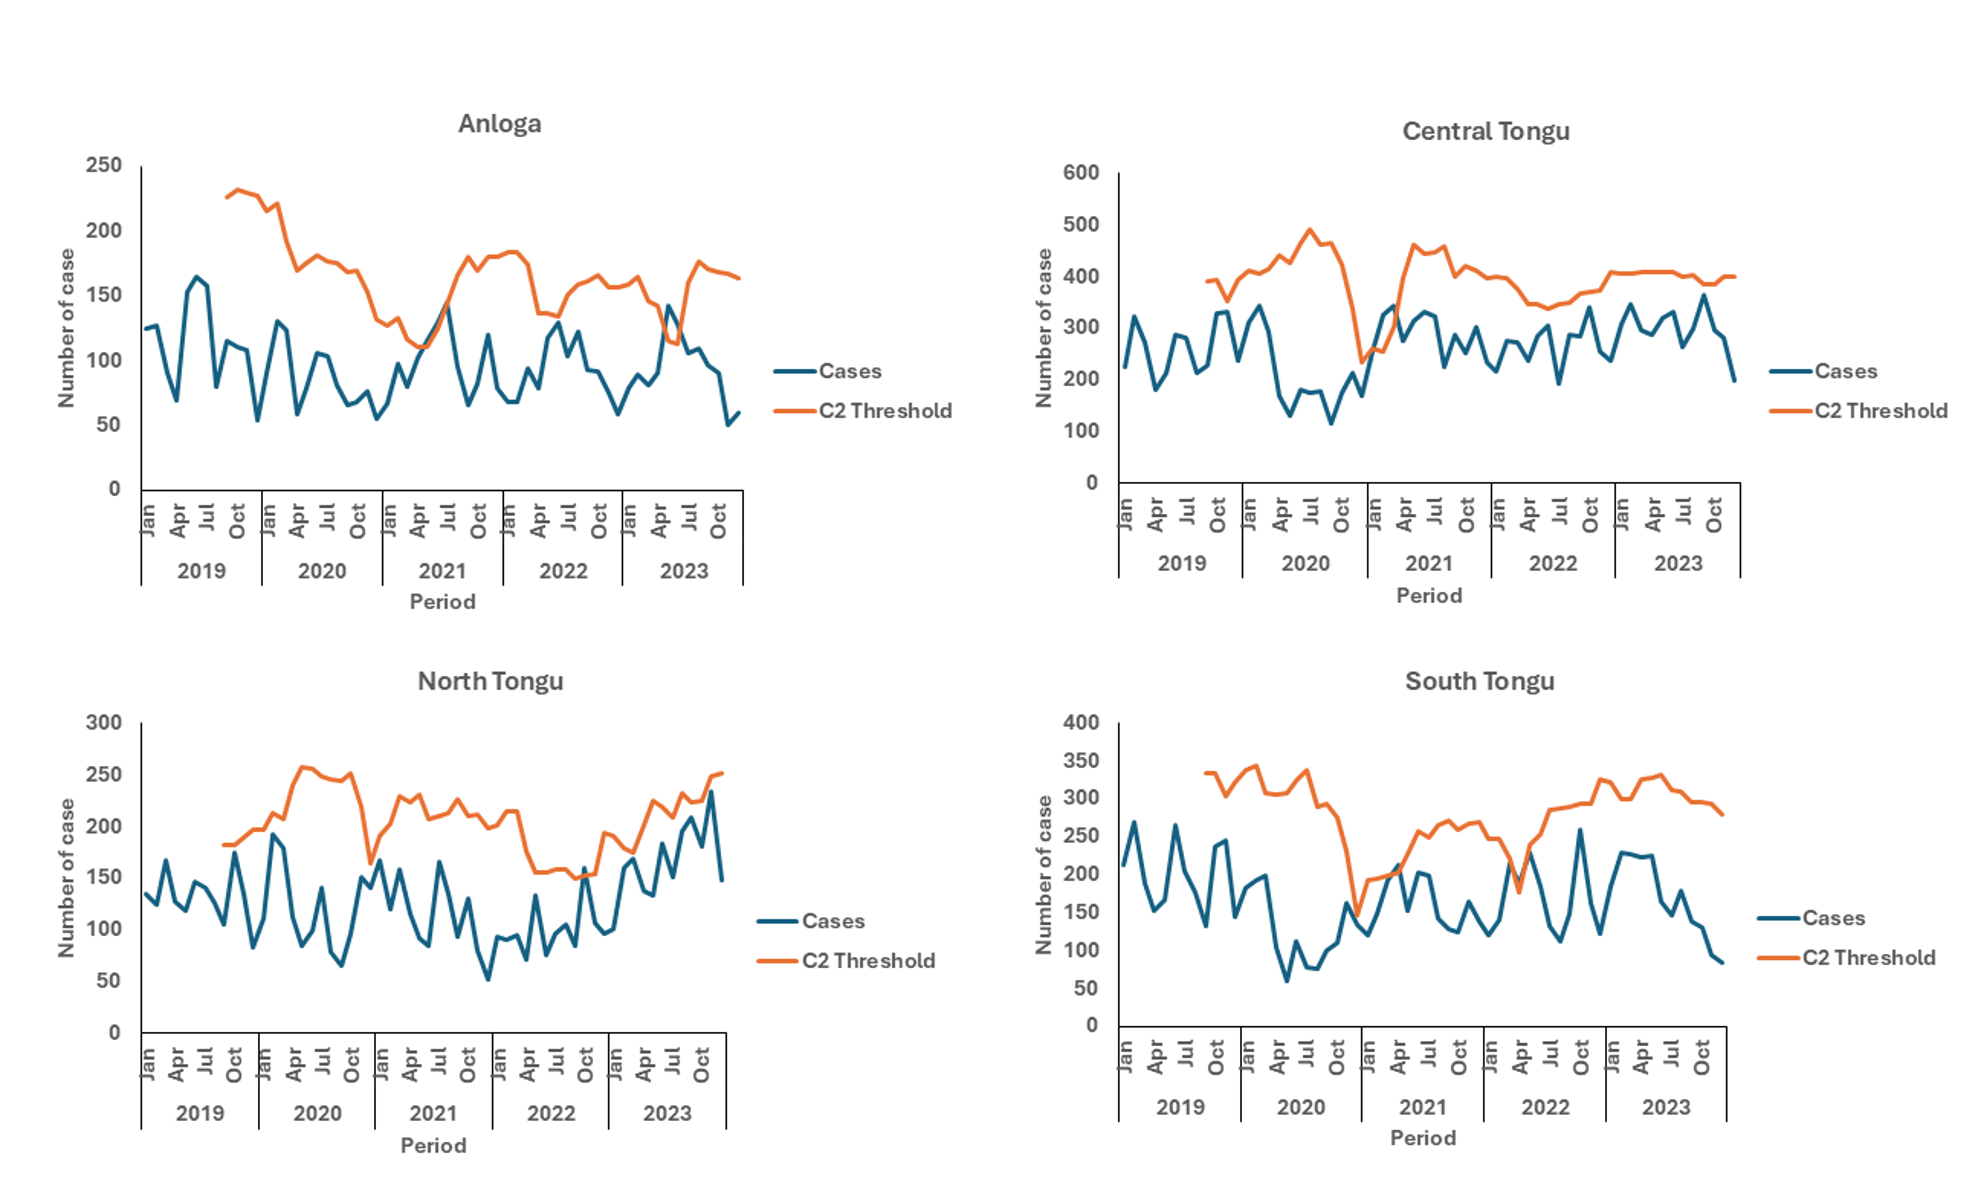
We used the CDC Early Aberration Reporting System (EARS) C2 algorithm [27] to detect unusual increases in diarrheal cases before, during, and after the October 2023 floods. The C2 method is a short-term aberration-detection approach and is different from classical statistical CUSUM procedures. It uses a moving baseline and upper threshold to identify sudden deviations from expected case counts.
For each time point, we calculated the C2 upper control limit (UCL) using:
\[ \mathrm{UCL}_{t} = \pi_{\mathrm{lag}} + 3 \times \mathrm{SD}_{\mathrm{lag}} \]
where:
\(\pi_{\mathrm{lag}}\) = mean of the previous 7 surveillance points with a 2-month lag
\(\mathrm{SD}_{\mathrm{lag}}\) = standard deviation of the same 7 points
The 2-month lag prevents early outbreak signals from being incorporated into the threshold calculation, which would artificially raise the baseline and mask outbreak detection. An outbreak alert was triggered when the number of reported diarrheal cases exceeded the calculated UCL. This approach is adaptive to seasonal patterns and has been used in similar outbreak detection in previous studies in Ghana [11,28,29]. Because the C2 algorithm is nonparametric and does not rely on distributional assumptions, we used it without applying inferential statistical modelling. The findings are presented in tables, figures, and maps.
Ethical considerations
Diarrhoea is routinely reported in DHIMS-II as part of the Integrated Disease Surveillance and Response system. As a result, we used aggregated secondary data for this analysis, which did not require formal ethical approval. This approach is consistent with the Public Health Act, 2012 of Ghana, which mandates the Ghana Health Service to maintain and update surveillance data for epidemic-prone diseases and public health events [30]. Consequently, this study is covered under this act, which waives the need for ethical clearance. However, administrative permission to access the dataset was obtained from the Volta Regional Health Directorate.
Background characteristics of diarrheal cases
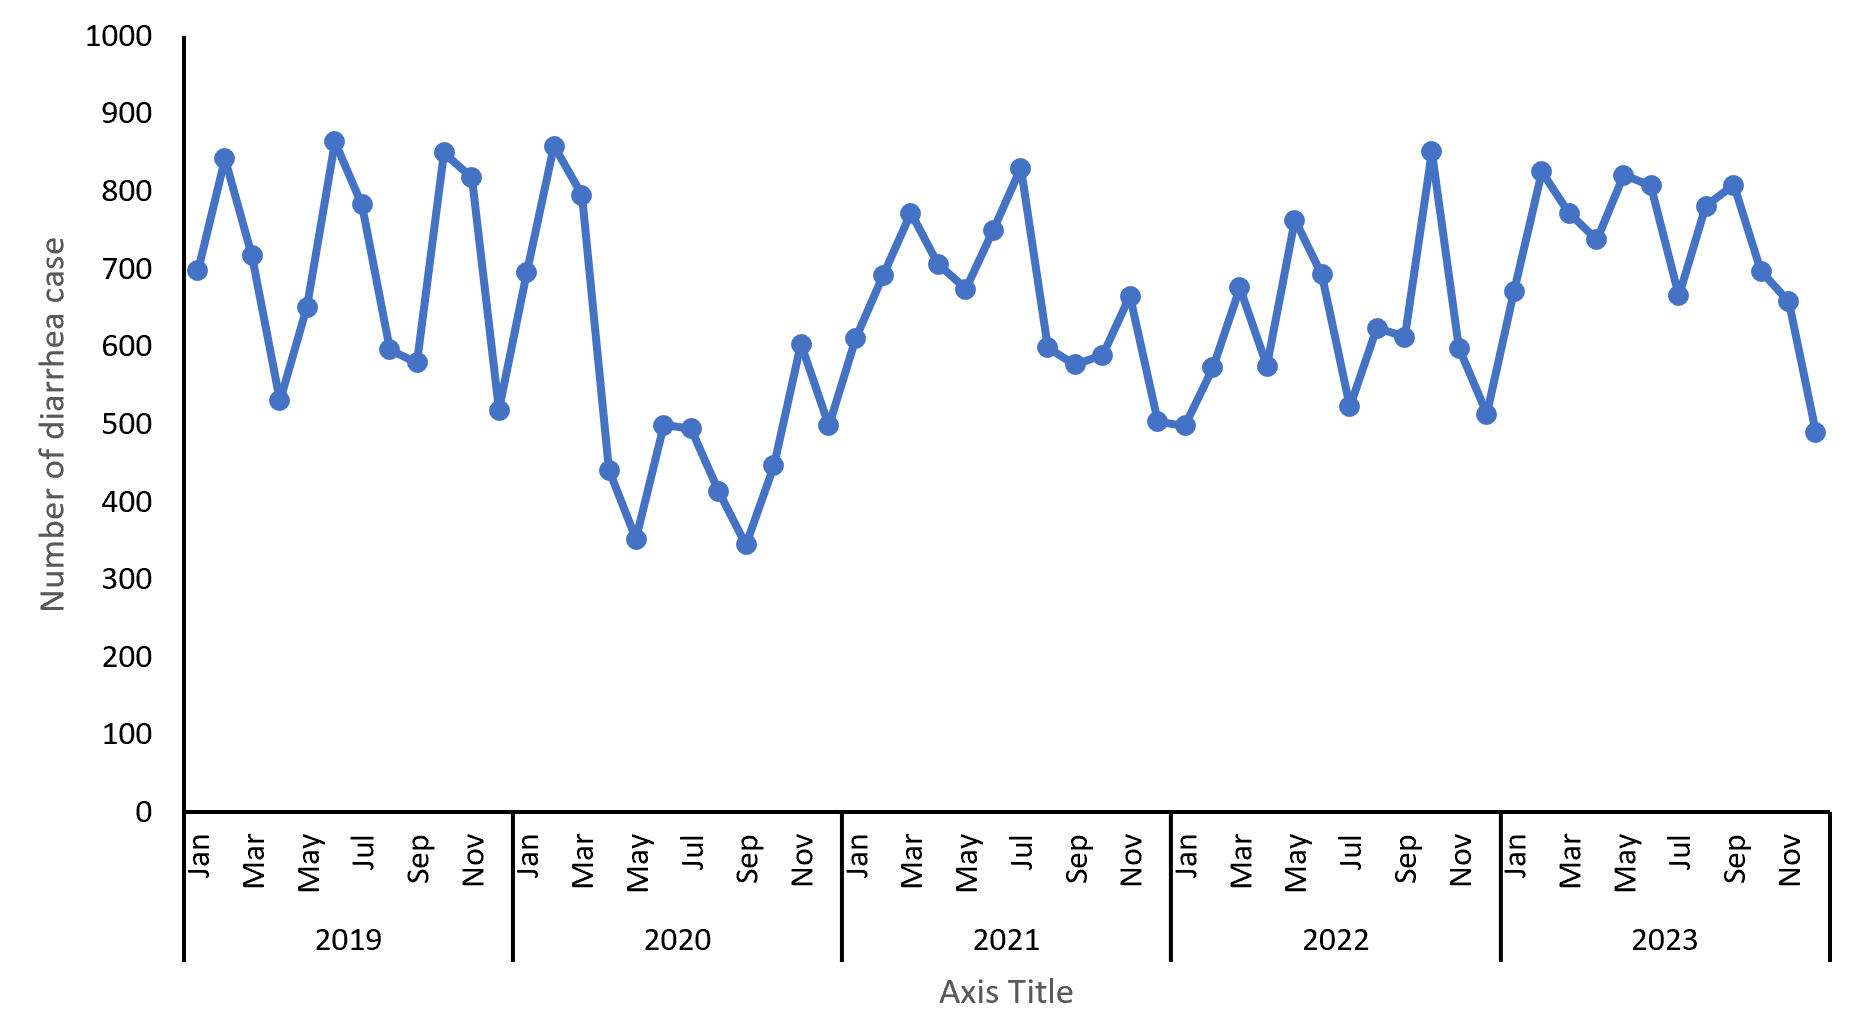
A total of 39,085 diarrheal cases in children under five were reported across the four flood-affected districts from 2019 to 2023. Children aged 0-11 months accounted for 31.4% (12,289/39,085) of the cases, whereas those aged 12-59 months made up 68.6% (26,796/39,085). Males represented 53.6% (20,937/39,085) of all reported cases. The Central Tongu District recorded 40.4% (15,804/39,085) of the reported cases (Table 2). Monthly diarrheal case counts fluctuated substantially, with no consistent seasonal pattern (Figure 2). Annual incidence was highest in 2019 and lowest in 2020; it subsequently increased in 2021, decreased in 2022, and increased again in 2023.
Incidence rate of diarrheal diseases
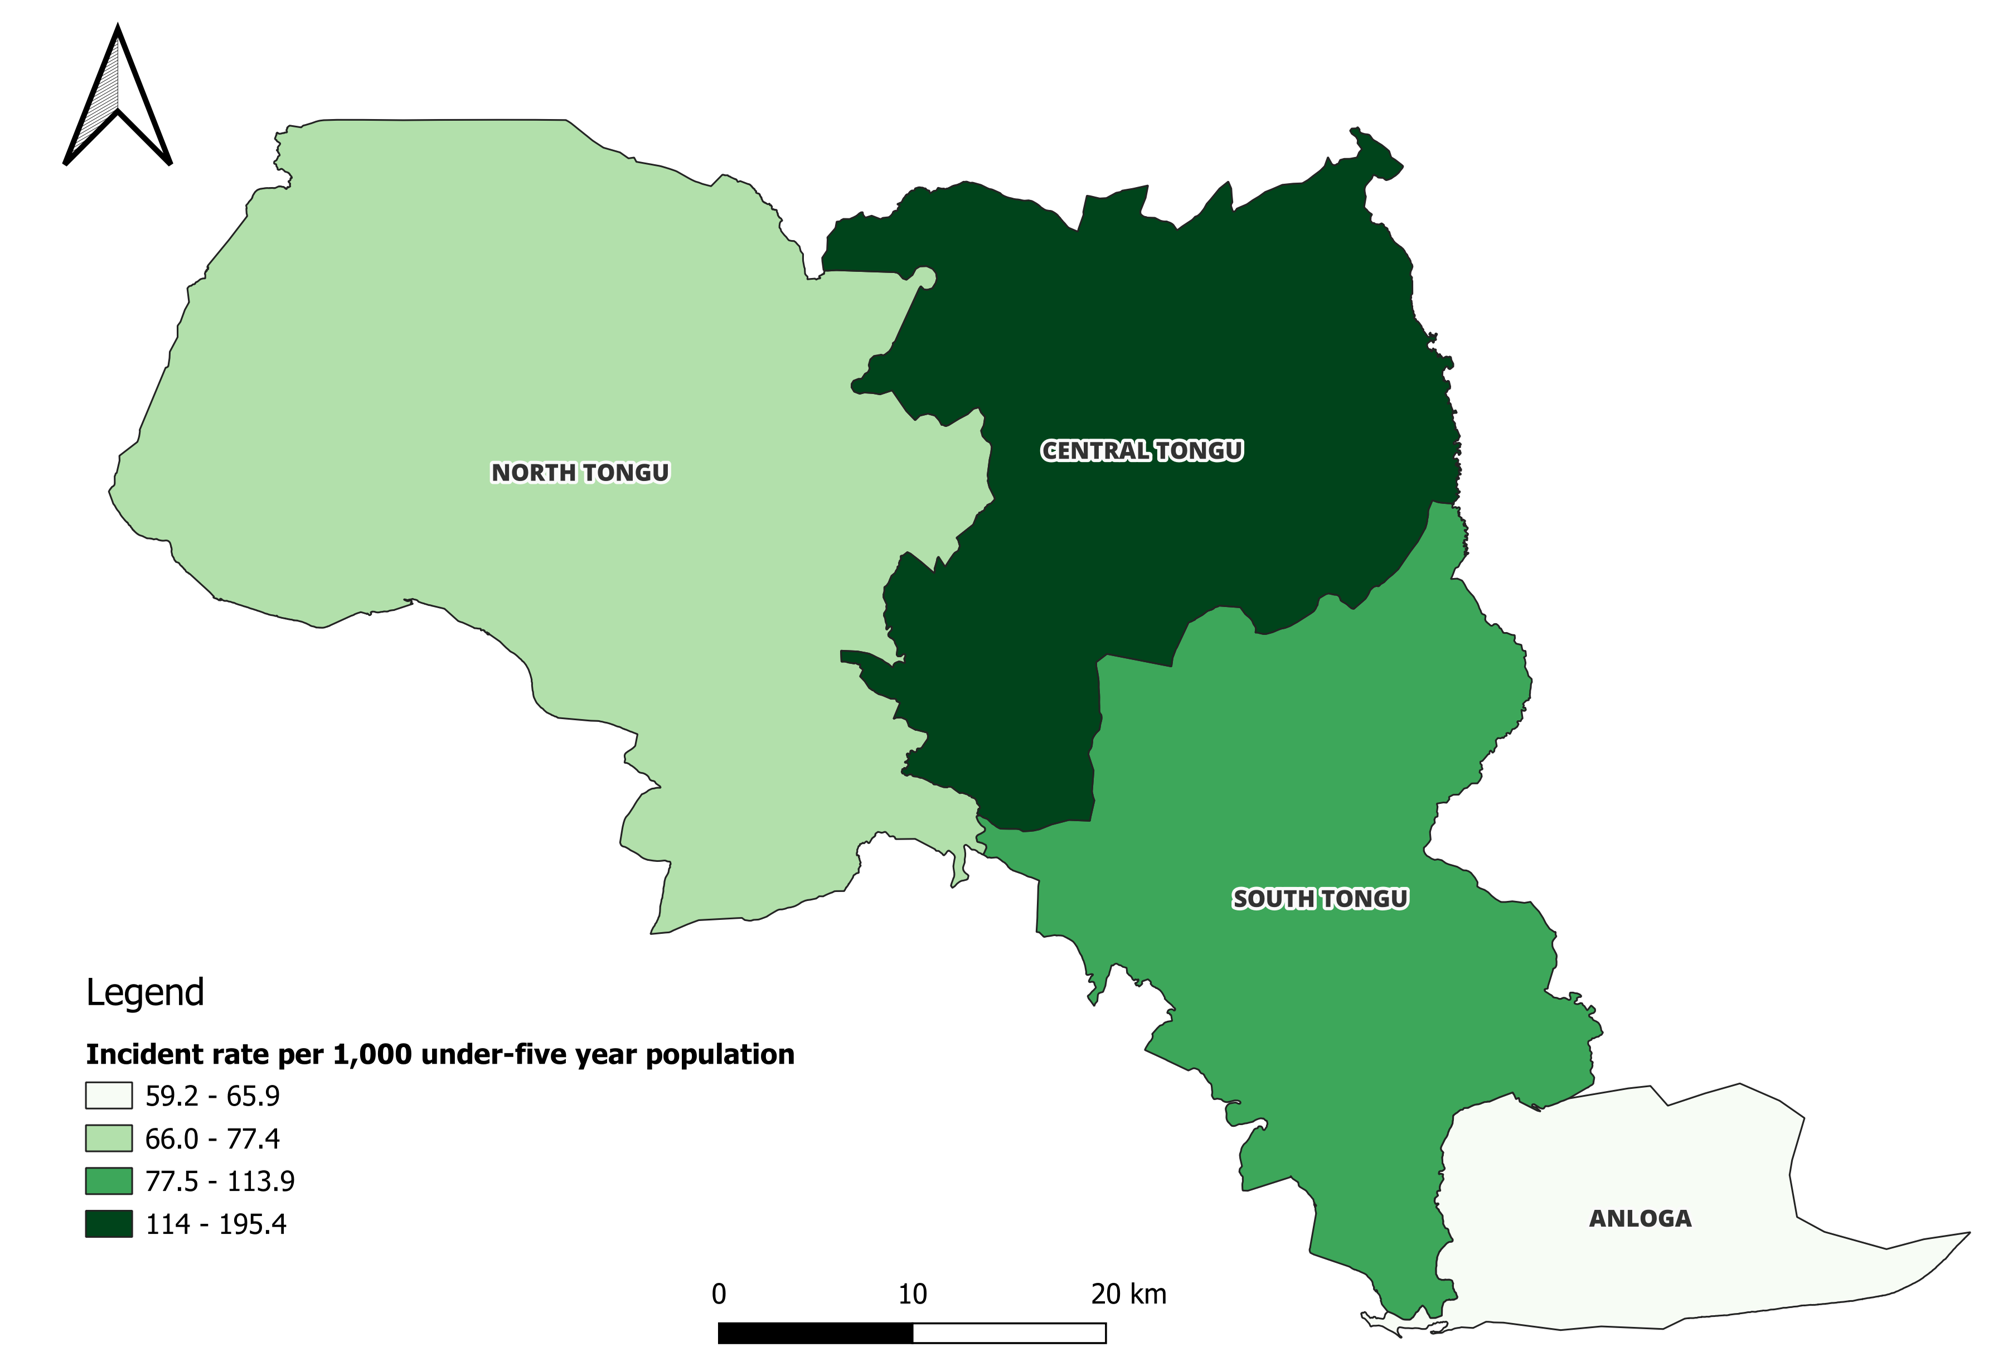
While the crude case counts suggest older children bore the greatest burden, age-specific incidence rates that account for differences in population size reveal important distinctions in disease risk across age groups. The overall five-year cumulative incidence of diarrhoea was 871 per 1,000 population (95% CI: 867.6-873.9). Cumulative incidence rate varies significantly by demographic and geographic characteristics. Children aged 0-11 months had significantly higher cumulative incidence [1,321 per 1,000 population (95% CI: 1,298-1,345)] than children aged 12-59 months [753 per 1,000 population (95% CI: 744-762)] (Table 3). Similarly, males experienced significantly higher cumulative incidence [978 per 1,000 population (95% CI: 964-991)] compared to females [773 per 1,000 population (95% CI: 761-784)] (Table 3). Geographically, Central Tongu district recorded the highest cumulative incidence [1,761 per 1,000 population (95% CI: 1,733-1,788)], while Anloga district recorded the lowest [533 per 1,000 population (95% CI: 520-547)] (Figure 4).
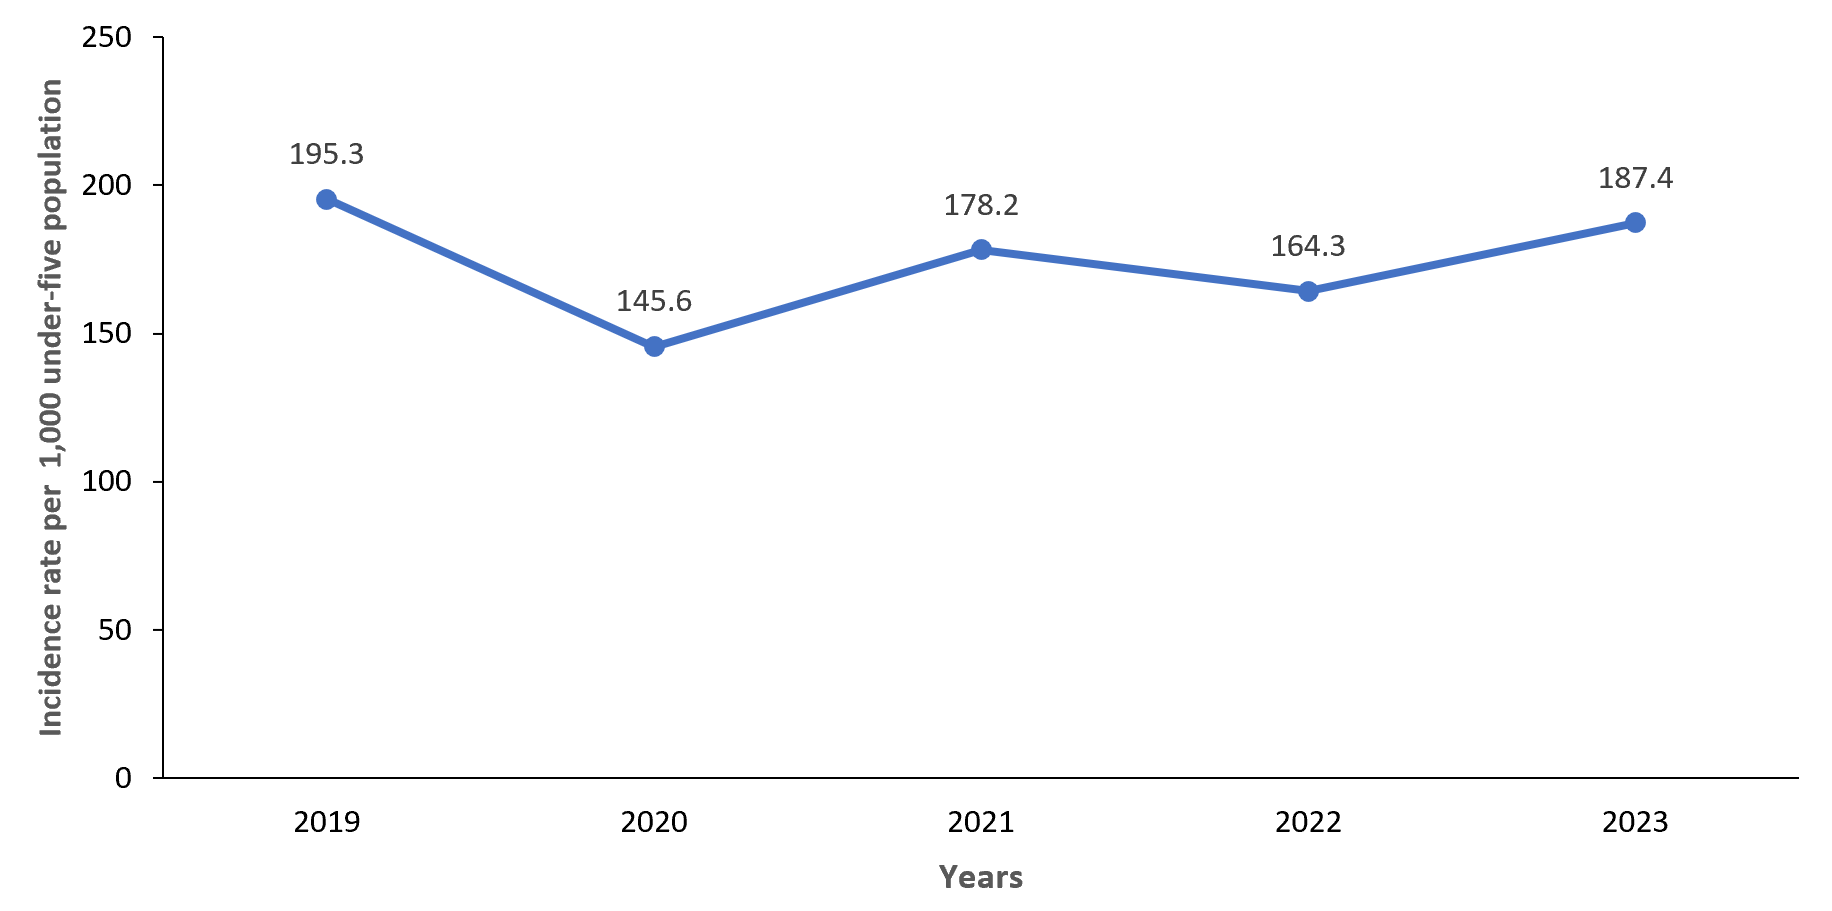
Diarrhoea incidence rates showed a fluctuating pattern over the five-year period. The rate was 195 per 1,000 population in 2019 (95% CI: 191–200) and declined to 146 per 1,000 in 2020 (95% CI: 142–149.2). It increased to 178 per 1,000 in 2021 (95% CI: 174–182), then fell to 164 per 1,000 in 2022 (95% CI: 161–168). The rate rose again in 2023 to 187 per 1,000 (95% CI: 184–191) (Figure 3).
Outbreaks of diarrheal diseases
Over the five years, South Tongu and Central Tongu each experienced one outbreak in April 2021. North Tongu recorded an outbreak in October 2022, and the Anloga district had an outbreak in May 2023 (Figure 5). Even though during the floods in October 2023, cases of diarrhoea were reported in all the flood-affected districts, the number of reported cases did not exceed the threshold. Notably, no new outbreaks were detected during or after the floods as of December 2023.
Flooding poses significant health risks to vulnerable populations, particularly young children susceptible to waterborne diseases. This study evaluated diarrhoea patterns among children under five years in flood-affected districts of Ghana’s Volta Region following the October 2023 dam releases. Our findings provide critical insights for strengthening disease surveillance and targeting interventions in flood-prone communities. This study contributes to the disaster surveillance literature by providing district-level evidence on childhood diarrhoeal patterns following a major dam-related flood event in Ghana. Unlike studies that mainly focus on diarrhoeal outbreaks after floods, this study demonstrates the value of routine surveillance data for monitoring disease trends, identifying vulnerable groups, and assessing post-disaster surveillance gaps. The absence of a detected outbreak during the immediate post-flood period should be interpreted cautiously. This finding should be considered alongside surveillance limitations and contextual factors, including healthcare access and reporting capacity. The findings provide practical lessons for strengthening flood preparedness, early warning systems, and integrated disease surveillance in flood-prone settings.
Our study revealed a concerning pattern of diarrhoea outbreaks in the flood-affected districts prior to the October 2023 floods. Each district experienced at least one outbreak before the flooding event. The historical outbreaks may suggest that these areas are inherently vulnerable to diarrheal outbreaks even in non-emergency periods. This finding may point to gaps in routine WASH services, surveillance sensitivity, or timely response capacity at the district level. Floods are widely known to increase the risk of diarrheal disease outbreaks due to contamination of water sources and disruption of sanitation systems. Studies from Dhaka, Bangladesh, and post-flood events in South Asia have consistently reported spikes in cholera and other diarrheal diseases following major floods [13,31,32]. Earlier flooding events in Ghana have also been associated with increased diarrheal morbidity, particularly in communities with poor WASH infrastructure after dam-mediated flooding [33]. In contrast, our study found no diarrheal outbreaks during or immediately after the October 2023 floods.
Several factors may possibly explain why no distinct post-flood outbreak was observed. The floods occurred late in 2023, which may not have allowed sufficient time for a large increase in reported cases. Also, the regional public health responses, including water safe education, distribution of relief items, and intensified surveillance, may also have contributed to reducing transmission [29]. However, the effect of these measures on diarrheal disease occurrence cannot be established from the current study. In addition, displacement and disrupted access to health facilities could have led to underreporting during the early weeks of the floods. These explanations remain hypothetical and should be explored in future analytical studies. Our findings describe patterns rather than causal relationships. This study included only flood-affected districts and did not include a statistical comparison group or time-series modelling. As a result, we cannot establish the impact of the Volta regional public health response on the incidence of diarrheal outbreaks. Also, we are unable to establish an association between flooding and diarrheal disease. Future studies should apply analytical approaches to test whether flooding independently increases diarrhoea incidence among children under five.
This study analysed diarrheal cases as a single syndromic category and did not include laboratory confirmation or pathogen-specific identification. Therefore, we could not determine whether reported cases were associated with specific enteric pathogens or distinguish flood-related transmission pathways from other causes of diarrhoeal illness. Future studies incorporating laboratory testing and pathogen-specific surveillance are needed to better characterize the relationship between flooding and diarrhoeal disease transmission.
We observed a fluctuating pattern in the incidence of under-five diarrheal cases, where a decrease in one year was typically followed by an increase in the subsequent year. The overall pattern did not show a sustained downward trend. These year-to-year variations differ from reports of steady declines in Ghana, Northwest Ethiopia, and other settings in sub-Saharan Africa [4,34,35], but align with findings from Southern Ethiopia, where increasing trends have been reported [36]. Several factors may explain the variation we observed.
The sharp decline in 2020 occurred during the COVID-19 pandemic and likely reflects disruptions in care-seeking behaviour, reduced reporting, and the effects of movement restrictions and hygiene measures. Reduced health facility attendance, service interruptions, and reallocation of health resources toward COVID-19 response may have also contributed. Similar declines in reporting of other diseases during this period have been documented in Ghana [37] and globally [38]. The increase from 2021 onward may reflect a combination of true increases in diarrhoea episodes and improved reporting as health services resumed normal operations. The overall health improvements in Ghana may also influence long-term patterns. High rotavirus vaccine coverage might have reduced severe diarrhoea in young children, and ongoing WASH interventions may contribute to lower transmission [39].
Our study also revealed a higher cumulative incidence rate of 871 cases per 1,000 under-five population when compared with the rate reported in Northwest Ethiopia, where a rate of 155.3 per 1,000 population was found [34]. It was much higher than the 60 cases per 1,000 under-five children at risk reported in Southern Ethiopia [36]. The higher incidence of childhood diarrhoea in this study, as compared to the review studies, may be due to the differences in duration and scope of the studies. Our analysis covered five years and included four floods, affected districts, while the Ethiopian studies spanned seven years and involved more than ten districts. This difference in study design could contribute to the varying incidence rates. Also, the population size of children under five in each study area may influence the observed rates. Larger populations can lead to higher absolute numbers of cases, which could partly explain why our study reported a higher incidence rate. Additionally, environmental factors, such as the impact of the water bodies in these flood-prone areas for our study, might have exacerbated the incidence of childhood diarrhea compared to the probably more stable conditions in the Ethiopian studies, as the incidence of diarrhea has increased over the past four years.
Our findings show clear age-related differences in diarrheal disease patterns. Children aged 12–59 months recorded more cases, but infants aged 0–11 months consistently had higher incidence rates across all five years. The higher case counts among older children reflect their larger population size. They make up about 79% of the under-five population, compared with 21% for infants. This pattern aligns with studies from Ghana [40,41] and Western Ethiopia [36], which also reported more diarrheal episodes among older children. However, those studies focused on case counts and did not examine age-specific incidence.
The higher incidence among infants highlights their biological vulnerability. Immature immune systems, early interruption of exclusive breastfeeding, and exposure to contaminated complementary foods likely increase their risk [43–45]. This finding has important programmatic implications. Older children generate more visits and require adequate service capacity, but infants remain the highest-risk group. Prevention efforts should prioritize them through exclusive breastfeeding promotion, safe complementary feeding practices, rotavirus vaccination, and micronutrient supplementation.
Our study also revealed a higher burden and incidence of diarrhoea in male children compared to females. This finding is similar to what has been documented in previous studies in Ghana [40,46]. The findings also align with another study in Ghana that used data from the DHS. The author also found a higher prevalence of childhood diarrhea among male children [4]. The observed gender disparity in the burden of under-five diarrhea could be attributed to several factors. Boys might be more exposed to environments where they are at higher risk of contracting infections, such as spending more time playing outdoors. There could also be biological or behavioural differences that make boys more susceptible to diarrhoea.
Our findings revealed that the Central Tongu District exhibited the highest incidence rate of childhood diarrhoea, with 195 cases per 1,000 under-five population, while the Anloga District reported the lowest rate of 59 cases per 1,000 under-five population. These differences may reflect variations in flood exposure, environmental conditions, healthcare access, and reporting capacity. Central Tongu was among the districts affected by the Akosombo Dam-induced flooding, where disruptions to living conditions, sanitation infrastructure, and access to safe water may have increased children’s vulnerability to diarrhoeal illness. This lower incidence rate in Anloga may be attributed to the district being one of the least affected by the floods, with no flood-related population displacement as a result. Consequently, the number of children under five years at risk of diarrhoea in Anloga is small compared to the other flood-affected districts. Also, the absence of a district hospital in Anloga could be a confounding factor. Without a District hospital, some cases of childhood diarrhoea might have gone unreported, potentially leading to an underestimation of the true burden of the disease in Anloga. It could also be that the cases sought medical care in the nearby Keta Municipal Hospital. The differences in WASH conditions and population density may also contribute to the district-level variations observed. Limited access to improved sanitation, unsafe water sources, and higher household crowding can increase diarrheal transmission and contribute to the patterns observed [39]. These factors should be explored in future studies using district-level environmental and health system indicators.
Our research revealed that the majority of the reported cases occurred during the rainy season, which supports findings from studies conducted at War Memorial Hospital-Navrongo in Ghana [40] and in Southern Ethiopia [36]. However, this contradicts findings from the Jasikan District of the Oti Region of Ghana, where the highest incidence of diarrheal cases was observed during the harmattan season [46]. The occurrence of extreme rainfall and subsequent flooding has been strongly linked to diarrhoea-related illnesses [47]. Flooding can lead to the deterioration of sanitary conditions and the contamination of drinking water sources by carrying pathogens and toxins into water bodies [33 -42]. This analysis was descriptive and exploratory. It did not aim to establish causal links between rainfall and diarrheal incidence. Several unmeasured factors, such as seasonality, and other environmental or sociodemographic influences, may have shaped the trends we observed. We recommend that further studies examine the impact of rainfall on the incidence of diarrheal diseases in the region.
Implications for surveillance, policy, and research
This study highlights opportunities to strengthen health systems in flood-prone settings. For surveillance, the detection of outbreaks before, but not during or after, the floods underscores the importance of maintaining surveillance sensitivity throughout the year, including when health access and reporting are disrupted. Integrating tools like the EARS algorithm into routine district-level early warning systems can enable quicker detection of abnormal trends. A continuous investment in electronic reporting and real-time dashboards will also enhance timeliness and accuracy. From a policy and practice perspective, the absence of post-flood outbreaks suggests that emergency WASH interventions and responses may have been effective and should be formalised and scaled in flood-prone districts. Targeted interventions are essential for high-risk groups, particularly infants aged 0-11 months and male children, through strengthened breastfeeding support, safe weaning practices, and household-level hygiene education. Health systems must integrate diarrheal disease prevention into climate disaster preparedness plans, including pre-positioning supplies and training rapid response teams. Future research should investigate the environmental, behavioural, and health system factors that triggered pre-flood outbreaks and explore the protective factors that prevented post-flood outbreaks. Spatiotemporal modelling can identify micro-hotspots for targeted resource allocation, while qualitative studies with caregivers and health workers will illuminate care-seeking behaviours, barriers to WASH practices, and community resilience during flood events.
Strengths and limitations
Our research highlights the utility of DHIMS II data in providing valuable and timely insights for decision-making and formulating interventions to reduce diarrhoea incidence in the region. We relied on data from DHIMS II, which could have data quality issues, such as incompleteness, that could potentially impact our estimates. This data is also facility-based and may not be representative of the real situation on the ground because some diarrhoea cases may not have been reported at the health facilities in the district. We did not adjust population estimates for displacement during the flooding period; this could affect the incidence rate estimates. The dataset may be subject to reporting bias, including underreporting of cases among caregivers who did not seek care at health facilities. The disruption of some health facilities may have reduced access to healthcare services and contributed to underreporting diarrheal cases. This inherent limitation of DHIMS-II should be considered when interpreting the findings. Our study primarily focused on analysing trends and patterns related to diarrheal disease. Unfortunately, due to limited data availability, we were unable to quantify the specific impact of floods on diarrheal cases. We recommend that further studies examine the impact of rainfall on the incidence of diarrhoea in the region.
This study detected no diarrheal outbreaks during or immediately after the flood. However, the short follow-up period may not have captured delayed post-flood effects, and disrupted healthcare access and reporting may have limited detection. Despite this, diarrheal incidence varied across the five-year period, with infants and male children consistently identified as the most vulnerable groups. Interventions that strengthen water, sanitation, and hygiene practices, together with breastfeeding promotion, should prioritize these populations. The Volta Regional Health Directorate is encouraged to integrate diarrheal surveillance into flood preparedness strategies. Future research should investigate the factors that contributed to outbreaks before flooding events and the reasons for their absence in the aftermath.
What is already known about the topic
What this study adds
We wish to express our sincere gratitude to the Disease Surveillance Unit of the Volta Regional Health Directorate for their invaluable support throughout this study.
Abbreviations
CI: Confidence Interval
CHPS: Community-based Health Planning and Service
CUSUM: Cumulative Sum
DHMIS-II: District Health Information Management System II
GSS: Ghana Statistical Service
GDHS: Ghana Demographic and Health Survey
OPD: Outpatient Department
QGIS: Quantum Geographic Information System
WASH: Water, Sanitation, and Hygiene
Conceptualization: Chrysantus Kubio and Samuel Adolf Bosoka.
Methodology: Chrysantus Kubio, Samuel Adolf Bosoka, Joseph Yaw Jerela, Amatus Nambagyira, and Emmanuel Yaw Bonsu.
Data Curation: Chrysantus Kubio, Samuel Adolf Bosoka, Joseph Yaw Jerela, Amatus Nambagyira, Emmanuel Yaw Bonsu, Felix Kwame Korang, Victor Zeng, and Maxwell Afetor.
Formal Analysis: Chrysantus Kubio, Samuel Adolf Bosoka, and Joseph Yaw Jerela
Validation: All authors have read and agreed to the published version of the manuscript.
Visualization: Chrysantus Kubio and Samuel Adolf Bosoka
Supervision: Chrysantus Kubio, Samuel Adolf Bosoka, Joseph Yaw Jerela, and Amatus Nambagyira
Writing – Original Draft: Chrysantus Kubio, Samuel Adolf Bosoka, Joseph Yaw Jerela, and Amatus Nambagyira
Writing – Review & Editing: Chrysantus Kubio, Samuel Adolf Bosoka, Joseph Yaw Jerela, Amatus Nambagyira, Emmanuel Yaw Bonsu, Felix Kwame Korang, Victor Zeng, Maxwell Afetor, Williams Azumah Abanga, Senanu Kwesi Djokoto, and Frank Baiden
| Variables | 2019 | 2020 | 2021 | 2022 | 2023 | Average population |
|---|---|---|---|---|---|---|
| Sex | ||||||
| Female | 22,616 | 23,139 | 23,378 | 23,869 | 24,370 | 23,474 |
| Male | 20,627 | 21,104 | 21,322 | 21,770 | 22,227 | 21,410 |
| Age (in months) | ||||||
| 0–11 | 8,960 | 9,168 | 9,262 | 9,457 | 9,655 | 9,300 |
| 12–59 | 34,283 | 35,076 | 35,438 | 36,182 | 36,942 | 35,584 |
| District | ||||||
| Anloga | 10,846 | 11,096 | 10,533 | 10,755 | 10,980 | 10,842 |
| Central Tongu | 8,100 | 8,286 | 9,302 | 9,497 | 9,697 | 8,976 |
| North Tongu | 12,149 | 12,430 | 12,309 | 12,567 | 12,831 | 12,457 |
| South Tongu | 12,148 | 12,432 | 12,556 | 12,819 | 13,089 | 12,609 |
| Annual population | 43,243 | 44,244 | 44,700 | 45,638 | 46,597 | 44,884 |
| Variables | 2019 n (%) | 2020 n (%) | 2021 n (%) | 2022 n (%) | 2023 n (%) | Total N (%) |
|---|---|---|---|---|---|---|
| Sex | ||||||
| Female | 3,949 (46.8) | 2,923 (45.4) | 3,724 (46.7) | 3,450 (46.0) | 4,102 (47.0) | 18,148 (46.4) |
| Male | 4,497 (53.2) | 3,518 (54.6) | 4,242 (53.3) | 4,049 (54.0) | 4,631 (53.0) | 20,937 (53.6) |
| Age (in months) | ||||||
| 0–11 | 2,579 (30.5) | 2,018 (31.3) | 2,518 (31.6) | 2,416 (32.2) | 2,758 (31.6) | 12,289 (31.4) |
| 12–59 | 5,867 (69.5) | 4,423 (68.7) | 5,448 (68.4) | 5,083 (67.8) | 5,975 (68.4) | 26,796 (68.6) |
| District | ||||||
| Anloga | 1,352 (16.0) | 1,035 (16.1) | 1,175 (14.8) | 1,099 (14.7) | 1,120 (12.8) | 5,781 (14.8) |
| Central Tongu | 3,120 (36.9) | 2,449 (38.0) | 3,469 (43.5) | 3,180 (42.4) | 3,586 (41.1) | 15,804 (40.4) |
| North Tongu | 1,583 (18.7) | 1,449 (22.5) | 1,397 (17.5) | 1,208 (16.1) | 2,004 (22.9) | 7,641 (19.5) |
| South Tongu | 2,391 (28.3) | 1,508 (23.4) | 1,925 (24.2) | 2,012 (26.8) | 2,023 (23.2) | 9,859 (25.2) |
| Variable | 2019 IR (95% CI) | 2020 IR (95% CI) | 2021 IR (95% CI) | 2022 IR (95% CI) | 2023 IR (95% CI) | Five-year cumulative IR (95% CI) |
|---|---|---|---|---|---|---|
| Sex | ||||||
| Female | 175 (169 – 180) | 126 (122 – 131) | 159 (155 – 164) | 145 (140 – 149) | 168 (164 – 173) | 773 (761 – 784) |
| Male | 218 (212 – 224) | 167 (161 – 172) | 199 (194 – 204) | 186 (181 – 191) | 208 (203 – 214) | 978 (964 – 991) |
| Age (in months) | ||||||
| 0-11 | 288 (277 – 299) | 220 (211 – 229) | 272 (263 – 281) | 255 (247 – 264) | 286 (277 – 295) | 1321 (1298 – 1345) |
| 12-59 | 171 (167 – 176) | 126 (122 – 129) | 154 (150 – 158) | 140 (137 – 144) | 162 (158 – 166) | 753 (744 – 762) |
| District | ||||||
| Anloga | 125 (118 – 131) | 93 (88 – 99) | 112 (106 – 118) | 102 (96.5 – 108) | 102 (96 – 108) | 533 (520 – 547) |
| Central Tongu | 385 (371 – 398) | 296 (284 – 307) | 373 (363 – 383) | 335 (325 – 344) | 370 (360 – 380) | 1761 (1733 – 1788) |
| North Tongu | 130 (124 – 137) | 117 (110 – 123) | 113 (108 – 119) | 96 (91 – 101) | 156 (150 – 163) | 613 (600 – 627) |
| South Tongu | 197 (189 – 205) | 121 (115 – 128) | 153 (147 – 160) | 157 (151 – 163) | 155 (148 – 161) | 782 (767 – 797) |
| IR: Incidence Rate per 1,000 CI: 95% Confidence Interval | ||||||