
Research | Open Access | Volume 9 (3): Article 120 | Published: 21 Jul 2026

Views: 768
Menu, Tables and Figures
| Table 1: Socio-demographic characteristics of women aged 15-49 in the 2005, 2012 and 2018 DHS, Guinea | ||||||
| Variables | DHS 2005 (n = 6,330) | DHS 2012 (n = 6,994) | DHS 2018 (n = 7,951) | |||
|---|---|---|---|---|---|---|
| n | (%)a | n | (%)a | n | (%)a | |
| Age (years) | ||||||
| 15–19 | 472 | 7.47 | 665 | 9.62 | 650 | 8.31 |
| 20–34 | 3,989 | 63.46 | 4,625 | 66.47 | 5,284 | 66.65 |
| 35–49 | 1,869 | 29.07 | 1,704 | 23.91 | 2,017 | 25.04 |
| Sex of head of household | ||||||
| Male | 5,732 | 90.12 | 6,182 | 88.01 | 7,035 | 88.28 |
| Female | 598 | 9.88 | 812 | 11.99 | 916 | 11.72 |
| Marital status | ||||||
| Not in union | 289 | 5.04 | 467 | 7.09 | 554 | 7.46 |
| In union | 6,041 | 94.96 | 6,527 | 92.91 | 7,397 | 92.54 |
| Education level | ||||||
| None | 5,552 | 87.02 | 5,471 | 77.90 | 6,132 | 77.10 |
| Primary | 494 | 8.26 | 826 | 12.11 | 878 | 10.75 |
| Secondary or higher | 284 | 4.72 | 697 | 9.99 | 941 | 12.15 |
| Husband’s level of education | ||||||
| None | 4,807 | 77.25 | 4,766 | 69.72 | 5,493 | 73.36 |
| Primary | 508 | 8.72 | 696 | 11.19 | 531 | 7.07 |
| Secondary or higher | 810 | 14.03 | 1,199 | 19.09 | 1,400 | 19.57 |
| Work status | ||||||
| Not working | 973 | 14.51 | 1,432 | 21.39 | 2,547 | 30.90 |
| Working | 5,349 | 85.49 | 5,554 | 79.41 | 5,404 | 69.10 |
| Religion | ||||||
| Muslim | 5,583 | 85.66 | 6,354 | 87.77 | 7,214 | 88.05 |
| Christian | 515 | 9.67 | 466 | 7.86 | 657 | 10.24 |
| Others | 232 | 4.67 | 360 | 4.36 | 80 | 1.71 |
| Women’s media exposure | ||||||
| Not at all | 5,178 | 80.36 | 4,378 | 62.65 | 4,904 | 60.52 |
| Yes | 1,149 | 19.64 | 2,606 | 37.35 | 3,047 | 39.48 |
| Health care decision making | ||||||
| Women not involved | 3,592 | 56.08 | 4,437 | 68.41 | 4,674 | 60.40 |
| Woman involved | 2,728 | 43.92 | 2,087 | 31.59 | 2,830 | 39.60 |
| Distance to health facility | ||||||
| Not a big problem | 2,720 | 43.02 | – | – | 3,902 | 49.08 |
| Big problem | 3,602 | 56.98 | – | – | 4,049 | 50.92 |
| Number of antenatal visits | ||||||
| Less than 4 | 2,065 | 48.61 | 2,140 | 43.01 | 3,462 | 63.74 |
| At least 4 | 2,163 | 51.39 | 2,824 | 56.99 | 1,921 | 36.26 |
| Parity | ||||||
| ≤ 2 | 1,735 | 27.36 | 2,386 | 34.78 | 2,488 | 31.77 |
| 3–4 | 1,889 | 30.06 | 1,977 | 28.43 | 2,774 | 34.73 |
| 5 or higher | 2,706 | 42.58 | 2,631 | 36.79 | 2,689 | 33.50 |
| Household wealth index | ||||||
| Poorer | 2,128 | 33.75 | 2,332 | 32.33 | 2,651 | 32.26 |
| Middle | 2,092 | 32.02 | 2,332 | 35.02 | 2,650 | 34.29 |
| Richer | 2,110 | 34.23 | 2,333 | 32.65 | 2,650 | 33.45 |
| Place of residence | ||||||
| Urban | 1,366 | 22.60 | 2,025 | 26.24 | 2,239 | 28.48 |
| Rural | 4,964 | 77.40 | 4,969 | 73.76 | 5,712 | 71.52 |
| Administrative region | ||||||
| Boke | 805 | 11.63 | 676 | 9.33 | 1,119 | 10.49 |
| Conakry | 501 | 10.03 | 766 | 14.24 | 696 | 11.43 |
| Faranah | 833 | 8.49 | 1,114 | 10.59 | 1,058 | 10.40 |
| Kankan | 1,031 | 15.23 | 1,199 | 18.23 | 1,309 | 18.66 |
| Kindia | 939 | 14.85 | 795 | 14.54 | 1,082 | 15.29 |
| Labe | 631 | 9.74 | 813 | 8.92 | 961 | 11.28 |
| Mamou | 630 | 6.61 | 745 | 6.64 | 773 | 7.54 |
| Nzerekore | 960 | 23.42 | 886 | 17.51 | 953 | 14.91 |
| N: Unweighted sample size; (%)a: Weighted percentage; DHS: Demographic and Health Survey | ||||||
Table 1: Socio-demographic characteristics of women aged 15-49 in the 2005, 2012 and 2018 DHS, Guinea
| Variables | DHS 2005 | DHS 2012 | DHS 2018 | Percentage differences | ||
|---|---|---|---|---|---|---|
| (%) ª | (%) ª | (%) ª | 2005–2012 | 2012–2018 | 2005–2018 | |
| Diff. | Diff. | Diff. | ||||
| Age (years) | ||||||
| 15–19 | 62.64 | 59.98 | 41.36 | 2.66 ns | 18.62 *** | 21.28 *** |
| 20–34 | 68.09 | 57.97 | 46.78 | 10.12 ** | 11.19 *** | 21.31 *** |
| 35–49 | 72.87 ** | 63.33 * | 51.23 ** | 9.54 ** | 12.10 ** | 21.64 *** |
| Sex of head of household | ||||||
| Male | 70.23 | 60.26 | 48.73 | 9.97 ** | 11.53 *** | 21.50 *** |
| Female | 58.51 ** | 53.44 * | 37.75 ** | 5.07 ns | 15.69 *** | 20.76 *** |
| Marital status | ||||||
| Not in union | 55.76 | 42.28 | 27.28 | 13.48 * | 15.00 *** | 28.48 *** |
| In union | 69.78 *** | 60.75 *** | 49.07 *** | 9.03 ** | 11.68 *** | 20.71 *** |
| Education level | ||||||
| None | 73.33 | 66.58 | 53.98 | 6.75 ** | 12.60 *** | 19.35 *** |
| Primary | 48.70 | 43.89 | 37.95 | 4.81 ns | 5.94 ns | 10.75 ** |
| Secondary or higher | 26.32 *** | 22.63 *** | 14.38 *** | 3.69 ns | 8.25 ** | 11.94 *** |
| Husband’s level of education | ||||||
| None | 75.79 | 68.89 | 56.09 | 6.9 ** | 12.80 *** | 19.70 *** |
| Primary | 64.81 | 54.75 | 42.98 | 10.06 * | 11.77 * | 21.83 *** |
| Secondary or higher | 40.86 *** | 33.57 *** | 23.53 *** | 7.29 * | 10.04 *** | 17.33 *** |
| Work status | ||||||
| Not working | 62.65 | 46.23 | 49.80 | 16.42 *** | -3.57 ns | 12.85 ** |
| Working | 70.15 ** | 62.81 *** | 46.39 | 7.34 * | 16.42 *** | 23.76 *** |
| Religion | ||||||
| Muslim | 70.48 | 60.44 | 50.68 | 10.04 *** | 9.76 *** | 19.80 *** |
| Christian | 57.64 | 44.42 | 24.81 | 13.22 ns | 19.61 ** | 32.83 *** |
| Others | 66.91 ns | 64.44 ** | 16.30 *** | 2.47 ns | 48.14 *** | 50.61 *** |
| Women’s media exposure | ||||||
| Not at all | 76.99 | 71.79 | 59.93 | 5.2 ns | 11.86 *** | 17.06 *** |
| Yes | 36.67 *** | 38.68 *** | 28.30 *** | -2.01 ns | 10.38 *** | 8.37 ** |
| Health care decision making | ||||||
| Women not involved | 69.18 | 61.05 | 51.37 | 8.13 ** | 9.68 *** | 17.82 *** |
| Woman involved | 68.95 ns | 60.27 ns | 44.43 ** | 9.68 * | 15.84 *** | 24.52 *** |
| Number of antenatal visits | ||||||
| Less than 4 | 83.58 | 76.47 | 56.59 | 7.11 ** | 19.88 *** | 26.59 *** |
| At least 4 | 54.70 *** | 44.56 *** | 28.52 *** | 10.14 *** | 16.04 *** | 26.18 *** |
| Parity | ||||||
| ≤ 2 | 62.79 | 52.21 | 39.83 | 10.52 *** | 12.38 *** | 22.96 *** |
| 3–4 | 68.21 | 59.12 | 47.83 | 9.09 ** | 11.29 *** | 20.38 *** |
| 5 or higher | 73.72 *** | 66.53 *** | 54.26 *** | 7.19 * | 12.27 *** | 19.46 *** |
| Household wealth index | ||||||
| Poorer | 87.61 | 81.23 | 71.92 | 6.38 * | 9.31 ** | 15.69 *** |
| Middle | 76.12 | 65.52 | 52.07 | 10.6 ** | 13.45 *** | 24.05 *** |
| Richer | 44.21 *** | 31.36 *** | 19.10 *** | 6.60 *** | 12.26 *** | 25.11 *** |
| Place of residence | ||||||
| Urban | 35.61 | 28.53 | 15.87 | 7.08 * | 12.66 *** | 19.74 *** |
| Rural | 78.85 *** | 70.44 *** | 60.02 *** | 8.41 ** | 10.42 ** | 18.83 *** |
| Administrative region | ||||||
| Boke | 74.77 | 62.20 | 57.90 | 12.57 ns | 4.30 ns | 16.87 ** |
| Conakry | 29.47 | 19.10 | 10.24 | 10.37 * | 8.86 ** | 19.23 *** |
| Faranah | 76.89 | 70.80 | 65.60 | 6.09 ns | 5.20 ns | 11.29 * |
| Kankan | 67.96 | 59.46 | 48.40 | 8.50 ns | 11.06 | 19.56 ** |
| Kindia | 72.03 | 63.79 | 49.28 | 8.24 ns | 14.51 * | 22.75 ** |
| Labe | 84.47 *** | 72.68 *** | 69.67 *** | 11.79 ** | 3.01 ns | 14.80 ** |
| Mamou | 84.24 | 80.98 | 62.45 | 3.26 ns | 18.53 ** | 21.79 *** |
| Nzerekore | 68.54 | 65.40 | 28.46 | 3.14 ns | 36.94 *** | 40.08 *** |
| Prevalence of home delivery (95% CI) | 69.07 (64.97–72.90) | 59.44 (55.10–63.64) | 47.44 (44.78–51.14) | 9.63 *** | 12.00 *** | 21.63 *** |
(%) a: Weighted percentage; Diff.: Percentage difference; 95% CI: 95% confidence interval; DHS: Demographic and Health Survey Statistical significance: ns: not significant; * p < 0.05; ** p < 0.01; *** p < 0.001
Table 2: Home birth rate by characteristics of women by survey year, DHS 2005, 2012 and 2018, Guinea
| Table 3: Random effects and model fitness, DHS 2018, Guinea | |||
| Random effects | Model 0 | Model 1 | Model 2 |
|---|---|---|---|
| Community variance (SE) | 3.91 (0.39) | 1.08 (0.17) | 0.99 (0.14) |
| ICC (%) | 54.34 (49.39–59.18) | 24.77 (19.48–30.95) | 23.20 (18.49–28.90) |
| PCV (%) | Reference | 72.33 | 72.99 |
| Fitness model | Model 0 | Model 1 | Model 2 |
| AIC | 8258.126 | 4936.78 | 4842.905 |
| BIC | 8272.089 | 5060.362 | 5018.522 |
| Log pseudolikelihood | -4127.063 | -2449.39 | -2394.453 |
| Deviance | 8254.126 | 4898.78 | 4788.906 |
| Number of observations (N) | 7,951 | 4,936 | 4,936 |
| ICC: Intra-class Correlation Coefficient; SE: Standard Error; PCV: Proportional change in variance | |||
Table 3: Random effects and model fitness, DHS 2018, Guinea
| Table 4: Adjusted odds ratios for home delivery among women in Guinea, DHS 2018 | ||
|---|---|---|
| Variables and Modalities | Model 1 AOR (95% CI) | Model 2 AOR (95% CI) |
| Age (years) | ||
| 15–19 | Ref. | Ref. |
| 20–34 | 1.31 (0.91-1.88) | 1.35 (0.93-1.95) |
| 35–49 | 1.32 (0.86-2.04) | 1.38 (0.89-2.13) |
| Sex of head of household | ||
| Male | Ref. | Ref. |
| Female | 0.78 (0.59-1.04) | 0.75 (0.56-1.02) |
| Education level | ||
| None | Ref. | Ref. |
| Primary | 0.90 (0.68-1.18) | 0.90 (0.68-1.20) |
| Secondary or higher | 0.55 (0.38-0.79)** | 0.55 (0.38-0.80)** |
| Husband’s level of education | ||
| None | Ref. | Ref. |
| Primary | 0.95 (0.67-1.36) | 0.93 (0.65-1.32) |
| Secondary or higher | 0.76 (0.59-0.98)* | 0.80 (0.62-1.04) |
| Religion | ||
| Muslim | Ref. | Ref. |
| Christian | 0.24 (0.13-0.43)*** | 0.52 (0.26-1.02) |
| Animist | 0.23 (0.10 (0.56)** | 0.54 (0.21-1.44) |
| Women’s media exposure | ||
| Not at all | Ref. | Ref. |
| Yes | 0.72 (0.57-0.91)** | 0.84 (0.67-1.06) |
| Healthcare decision making | ||
| Woman involved | Ref. | Ref. |
| Women not involved | 1.32 (1.08-1.61)** | 1.33 (1.09-1.62)** |
| Distance to health facility | ||
| Not a big problem | Ref. | Ref. |
| Big problem | 1.66 (1.38-1.99)*** | 1.54 (1.28-1.87)*** |
| Number of antenatal visits | ||
| Less than 4 | 2.28 (1.88-2.77)*** | 2.37 (1/94-2/89)*** |
| At least 4 | Ref. | Ref. |
| Parity | ||
| ≤ 2 | Ref. | Ref. |
| 3–4 | 1.15 (0.92-1.44) | 1.17 (0.93-1.46) |
| 5 or higher | 1.17 (0.88-1.55) | 1.15 (0.86-1.52) |
| Household wealth index | ||
| Poorer | Ref. | Ref. |
| Middle | 0.63 (0.52-0.77)*** | 0.68 (0.57-0.82)*** |
| Richer | 0.23 (0.16-0.32)*** | 0.41 (0.29-0.58)*** |
| Place of residence | ||
| Urban | Ref. | |
| Rural | 3.36 (2.24-5.5)*** | |
| Administrative region | ||
| Boke | Ref. | |
| Conakry | 0.61 (0.31-1.21) | |
| Faranah | 1.57 (0.88-2.81) | |
| Kankan | 0.84 (0.49-1.44) | |
| Kindia | 0.96 (0.58-1.61) | |
| Labe | 1.82 (1.02-3.26)* | |
| Mamou | 0.96 (0.58-1.57) | |
| Nzerekore | 0.29 (0.13-0.63)** | |
| AOR: Adjusted Odds Ratio; CI: Confidence Interval; Ref: Reference category Statistical significance: *p < 0.05; **p < 0.01; ***p < 0.001 | ||
Table 4: Adjusted odds ratios for home delivery among women in Guinea, DHS 2018
| Table 5: Marginal Effects, and Predicted Probabilities of factors associated with home delivery (final multilevel logistic model), DHS 2018, Guinea | |||
|---|---|---|---|
| Variables and Modalities | Marginal Effects | Adjusted predicted probabilities (%) (95% CI) | p-value |
| Age (years) | |||
| 15–19 | Ref. | 43.29 (37.78-48.79) | |
| 20–34 | 0.046 | 47.91 (45.41-50.42) | 0.109 |
| 35–49 | 0.05 | 48.25 (44.72-51.77) | 0.149 |
| Sex of head of household | |||
| Male | Ref. | 48.01 (45.70-50.33) | |
| Female | -0.043 | 43.66 (38.97-48.34) | 0.063 |
| Education level | |||
| None | Ref. | 48.52 (46.16-50.88) | |
| Primary | -0.016 | 46.92 (42.26-51.59) | 0.48 |
| Secondary or higher | -0.09 | 39.20 (33.43-44.98) | 0.002 |
| Husband’s level of education | |||
| None | Ref. | 48.22 (45.73-50.71) | |
| Primary | -0.011 | 47.10 (41.51-52.69) | 0.692 |
| Secondary or higher | -0.034 | 44.82 (40.99-48.66) | 0.102 |
| Religion | |||
| Muslim | Ref. | 48.82 (46.09-51.54) | |
| Christian | -0.102 | 38.57 (29.05-48.09) | 0.059 |
| Animist | -0.095 | 39.30 (25.01-53.58) | 0.219 |
| Women’s media exposure | |||
| Not at all | Ref. | 48.48 (45.84-51.14) | |
| Yes | -0.027 | 45.82 (42.57-49.08) | 0.156 |
| Healthcare decision making | |||
| Woman involved | Ref. | 44.91 (41.88-47.95) | |
| Women not involved | 0.044 | 49.33 (46.84-51.82) | 0.005 |
| Distance to health facility | |||
| Not a big problem | Ref. | 44.00 (41.24-46.75) | |
| Big problem | 0.069 | 50.88 (48.10-53.67) | < 0.001 |
| Number of antenatal visits | |||
| Less than 4 | 0.138 | 38.41 (35.35-41.46) | < 0.001 |
| At least 4 | Ref. | 52.21 (49.65-54.77) | |
| Parity | |||
| ≤ 2 | Ref. | 46.07 (42.67-49.47) | |
| 3–4 | 0.024 | 48.45 (45.68-51.22) | 0.179 |
| 5 or higher | 0.021 | 48.19 (44.91-51.47) | 0.344 |
| Household wealth index | |||
| Poorer | Ref. | 54.01 (50.69-57.33) | |
| Middle | -0.063 | 47.67 (44.74-50.60) | < 0.001 |
| Richer | -0.146 | 39.45 (34.67-44.23) | < 0.001 |
| Place of residence | |||
| Urban | Ref. | 32.05 (27.08-37.02) | |
| Rural | 0.202 | 52.24 (48.93-55.56) | < 0.001 |
| Administrative region | |||
| Boke | Ref. | 50.20 (43.31-57.08) | |
| Conakry | -0.08 | 42.16 (32.70-51.62) | 0.165 |
| Faranah | 0.074 | 57.58 (51.05-64.12) | 0.126 |
| Kankan | -0.029 | 47.29 (41.29-53.29) | 0.526 |
| Kindia | -0.006 | 49.57 (44.18-54.97) | 0.886 |
| Labe | 0.097 | 59.95 (53.47-66.43) | 0.04 |
| Mamou | -0.007 | 49.52 (44.68-54.36) | 0.872 |
| Nzerekore | -0.2 | 30.18 (20.73-39.63) | 0.001 |
| CI: Confidence Interval; Ref: Reference category | |||
Table 5: Marginal Effects, and Predicted Probabilities of factors associated with home delivery (final multilevel logistic model), DHS 2018, Guinea
Sidikiba Sidibé1,2,3, Djiba Diakité3,&, Almamy Amara Touré2,3, Aboubacar Sidiki Magassouba3, Hadja Fanta Camara3, Abdoulaye Sow3, Mory Kourouma3, Facely Camara3, Alexandre Delamou1,2,3
1African Center of Excellence for the Prevention and Control of Transmissible Diseases (CEA-PCMT), University Gamal Abdel Naser, Conakry, Guinea, 2Maferinyah National Center for Training and Research in Rural Health (CNFRSR), Forecariah, Guinea, 3Faculty of Health Sciences and Techniques, Gamal Abdel Nasser University, Conakry, Guinea.
&Corresponding author: Djiba Diakite, Faculty of Health Sciences and Techniques, Gamal Abdel Nasser University, Conakry, Guinea, Email: djibadiakite943@gmail.com, ORCID: https://orcid.org/0000-0003-4496-8366
Received: 14 Sep 2025, Accepted: 14 Jul 2026, Published: 21 Jul 2026
Domain: Maternal and Child Health
Keywords: Trend, home delivery, associated factors, Guinea
©Sidikiba Sidibé et al. Journal of Interventional Epidemiology and Public Health (ISSN: 2664-2824). This is an Open Access article distributed under the terms of the Creative Commons Attribution International 4.0 License (https://creativecommons.org/licenses/by/4.0/), which permits unrestricted use, distribution, and reproduction in any medium, provided the original work is properly cited.
Cite this article: Sidikiba Sidibé et al., Trends and factors associated with home delivery among Guinean women: A multilevel analysis using data from Demographic and Health Surveys 2005-2018. Journal of Interventional Epidemiology and Public Health. 2026; 9(3):120. https://doi.org/10.37432/jieph-d-25-00193
Introduction: Home delivery in low-income countries contributes to the high rate of maternal and neonatal mortality. In Guinea, approximately 47.6% of women continue to give birth at home. This study explores the temporal trends and determinants of this practice between 2005 and 2018.
Method: We analyzed data from demographic and health surveys (DHS) conducted in Guinea in 2005, 2012, and 2018, covering a total of 21,275 women. Temporal trends across combined waves were analyzed using design-based weighted logistic regression with denormalized survey weights. Contextual determinants for the latest wave (2018 DHS) were assessed using a two-level multilevel mixed-effects logistic regression (melogit) applying Carle’s Method A for weight scaling. To prevent risk overestimation due to high prevalence (>30%), final fixed coefficients were converted into Average Marginal Effects (AMEs) expressed in absolute probability points.
Results: The trend in home delivery decreased from 69.07% (CI: 64.97–72.90) in 2005 to 47.44% (CI: 44.78–51.14) in 2018 (p-trend <0.001). In the fully adjusted multilevel model, living in a rural area emerged as one of the strongest contextual correlates, showing a substantial 0.202-point increase in the absolute probability of home delivery (p<0.001). Strong individual socioeconomic and structural barriers persisted: fewer than 4 antenatal care (ANC) visits (+0.138 points; p<0.001), severe distance barriers to health facilities (+0.069 points; p<0.001), and lack of maternal healthcare decision-making autonomy (+0.044 points; p=0.005). Conversely, secondary/higher maternal education (-0.090 points; p=0.002) and higher household wealth indexes (rich tier: – 0.146 points; p<0.001) exerted significant protective effects.
Conclusion: Home delivery in Guinea is heavily driven by structural, geographic, and socioeconomic inequities. Targeted policies must prioritise rural areas, improve ANC completion, and enhance maternal autonomy. These findings highlight the need for targeted interventions to facilitate access to maternal health services and encourage births attended by skilled personnel, considering both individual and contextual factors.
The number of maternal deaths per 100,000 live births fell by about 40% worldwide between 2000 and 2023 [1]. In 2023, approximately 260,000 women worldwide lost their lives due to complications related to pregnancy or childbirth, an average of nearly 700 maternal deaths per day [1]. Approximately 62% of maternal deaths in sub-Saharan Africa were attributable to direct obstetric causes, including haemorrhage, hypertensive disorders and sepsis [2].
Sustainable Development Goal 3.1 aims to reduce the global maternal mortality ratio to less than 70 per 100,000 live births by 2030 [3]. To reduce maternal and neonatal death rates, several indicators could be improved, including quality prenatal care, delivery in health facilities and the presence of skilled personnel at birth [4,5]. Despite these recommendations, women continue to give birth at home without the assistance of qualified personnel.
Home delivery rates vary considerably between low- and middle-income countries, ranging from less than 10% in Latin America to more than 70% in some parts of East Africa [6–11]. Also, several studies have identified factors associated with home delivery. Education level, birth order, number of antenatal care visits, media exposure, parity, household wealth index, distance to the health facility, women’s decision-making power, and place of residence have been identified as the main factors associated with home delivery [7,8,10–13].
Despite institutional investments aimed at restructuring maternal healthcare services across Guinea, the country continues to bear a heavy burden of maternal mortality. According to the 2005 Guinea Demographic and Health Survey (DHS) report, the baseline maternal mortality ratio (MMR) was estimated at a critical 980 maternal deaths per 100,000 live births. Over the subsequent decades, while a downward trajectory was initiated, progress has remained slow. Modelled estimates contextually aligned with our study period indicate that the national MMR decreased from 724 deaths per 100,000 live births in 2012 to 550 deaths per 100,000 live births in 2016, a significant decrease but still far from the global sustainable development goals [14,15]. The main factors contributing to this mortality include low coverage of prenatal care (only 35% of women who have made at least four visits), the limited proportion of births assisted by skilled personnel (55%) and the high prevalence of home delivery, estimated at 47.6% [16,17].
Home delivery remains particularly common in rural areas, where geographical access, the cost of services, cultural norms and women’s limited decision-making autonomy influence the choice of the place of birth. Studies conducted in Guinea have identified similar determinants: low level of education, poverty, multiparity, religious affiliation, and distance from health structures [17,18]. These factors reflect both structural barriers and persistent sociocultural constraints. These structural barriers exist within a context of inequality that limits the ability of women, particularly the most vulnerable, to give birth in health facilities.
Although the determinants of home delivery have been documented in previous studies, few studies have simultaneously examined their evolution over time and the interaction of factors at different levels (individual, family, and contextual), particularly using multilevel approaches. The lack of analysis like this limits our understanding of structural and geographic mechanisms and makes it harder to develop appropriate policies. In this context, this study analyzes the evolution of home delivery in Guinea between 2005 and 2018 and examines the factors associated with different levels based on data from the DHS. The results aim to inform the development of maternal health policies and interventions, particularly for the most vulnerable populations.
Study design and data source
We analyzed data from three Guinean DHSs conducted in 2005, 2012, and 2018 [19]. DHS surveys are representative national cross-sectional surveys conducted in a standardised manner in many low- and middle-income countries. They are coordinated by the DHS Program, funded primarily by USAID and conducted in collaboration with national statistical institutes and ministries of health. They are conducted among households and collect data on a wide range of topics related to reproductive health, women’s health, and children’s health, such as fertility, prenatal care, and childbirth. The stratified double-stage cluster sampling method was based on a list of enumeration areas (EAs) extracted from the general population censuses of the Republic of Guinea between 1996 and 2014. The sampling design comprises 15 distinct sampling strata. This includes 14 strata generated by cross-classifying the seven administrative regions by type of place of residence (urban and rural areas), and one separate stratum for the capital city of Conakry, which is officially classified as entirely urban (with no rural or semi-urban components)
In the second stage, systematic random sampling was used to select a fixed number of households from each EA. We combined the three surveys to assess trends over time in home delivery. The detailed sampling procedures are given in the final DHS reports (2005, 2012 and 2018) [14,16,20].
Study population
The source population included all women of childbearing age between the ages of 15 and 49 at the time of each survey. Women in Guinea who were 15-49 years old and lived in Conakry, Boké, Faranah, Kankan, Kindia, Labé, Mamou, and N’zérékoré and gave birth in the 5 years prior to each survey were included in this study [14,16,20]. The dependent variable did not include any missing data.
Outcome variables
The dependent variable was the place of delivery, classified as home (coded 1) or health facility (coded 0). Health facilities included public, private, and religious institutions.
Independent variables
Individual-level variables included age (15-19, 20-34, 35-49), sex of head of household, marital status (in union vs. not in union), educational level (no education, primary, secondary or higher), employment status (working vs. not working), religion, ethnicity, women’s media exposure (exposed vs. not exposed), parity, number of antenatal care (ANC) visits (<4 vs. ≥4), and women’s participation in health decision-making (involved vs. not involved)”, place of residence, administrative region, and household wealth index. Women’s media exposure was defined as having access to at least one of the following: television, radio, or newspaper at least once per week. The household wealth index was calculated by assigning scores to households based on the number and type of consumer goods owned—ranging from a television to a bicycle—as well as on dwelling characteristics, such as the source of drinking water, type of toilet facilities, and flooring materials. These scores were generated using principal component analysis. Economic welfare tertile was constructed by dividing the distribution into three equal categories.
Statistical analysis
Statistical analyses were conducted using Stata version 14.2 (StataCorp, College Station, TX, USA). To account for the complex sampling design of the Demographic and Health Surveys (DHS) and to ensure a transparent analytical workflow, the procedures were divided into two distinct methodological phases: a pooled temporal trend analysis and a contextual multilevel modelling analysis.
To analyze the evolution of the prevalence of home delivery, the individual datasets from the three survey waves were vertically pooled (using the append command). The outcome of interest (home delivery) was defined as a binary variable specifying whether the last child born alive in the five years preceding the survey was delivered at home.
Rescaling of pooled survey weights:
In DHS datasets, raw individual sample weights (v005) are normalized within each wave so that their sum equals the sample size of that specific wave. When pooling multiple cross-sectional surveys, the direct application of these raw weights artificially overrepresents waves with larger sample sizes and introduces a major bias in the calculation of the overall variance.
To maintain representativeness and ensure an accurate estimation of variance, a weight denormalization and rescaling procedure was systematically applied after merging, in accordance with the recommendations of Carle (2009) [21]. The raw weights were first divided by 1,000,000 (WTt = v005/1,000,000). Then, the final rescaled weight (wt_rescaled) for an observation in a given wave t was calculated using the following formula:
wt_rescaled = WTt × (nt / ∑WTt)
Where nt represents the exact number of observations (sample size) in survey wave t (generated using bysort survey_year: gen n_wave = _N), and ∑WTt represents the sum of the de-normalized sampling weights for that same wave. This rescaling preserves the relative and proportional contribution of each survey within the pooled sample.
Accounting for the pooled complex survey design:
To guarantee the independence of the Primary Sampling Units (PSUs) and strata across the survey waves and to exclude any artificial overlapping, new unique identifiers were generated. This was achieved by combining the original PSU (v021) and strata (v022) codes with a specific prefix for each survey year (psu_new and strata_new). The pooled complex sampling design was then declared using the command
svyset psu_new [pw = wt_rescaled], strata (strata_new)
All descriptive analyses (weighted proportions, means, and Rao–Scott adjusted Chi-square tests) integrated this complex design using the svy prefix [22]. The Rao–Scott adjusted Chi-square test was preferred over the traditional Chi-square test because it accounts for the complex survey design of the DHS, specifically stratification, clustering, and weighting—thereby allowing for more valid estimations of standard errors and test statistics.
Overall temporal trends were modelled using weighted logistic regression (svy: logit) by introducing the survey year as an ordinal variable, ensuring a strictly associative (non-causal) interpretation of inter-survey variations.
The multilevel analysis was restricted exclusively to the most recent wave (2018 DHS). Because DHS waves rely on structurally independent survey designs with specific clusters and strata, pooling the waves invalidates the modeling of contextual random effects and the interpretation of contemporary between-cluster variance.
Given the hierarchical structure of the data (Level-1 women nested within Level-2 clusters), mixed-effects multilevel logistic regression models were fitted using the melogit command. Within this hierarchical framework, the complex survey design was managed as follows:
w_ij_scaled = WTij × (ncluster /∑Wij)
Adjustment for stratification: Due to the limitations of the melogit command regarding the simultaneous integration of complex stratification via the svy syntax, stratification could not be explicitly specified within the multilevel survey design statement. The statistical implication is a possible minor overestimation of standard errors, maintaining conservative estimations. To mitigate this risk and stabilize precision, the main geographic stratification variables—namely, the type of place of residence (v025) and the administrative region (v024)—were systematically included as fixed effects in the adjusted models.
Sequential modelling strategy
Bivariate analyses were first performed. Variables associated with the outcome at a significance level of p<0.20 were retained for the multivariate stage to prevent the premature exclusion of potential confounding factors [23,24]. The final level of statistical significance was set at p<0.05. Three models were tested sequentially:
Model fit was evaluated using log-likelihood, deviance (−2 log-likelihood), as well as the Akaike Information Criterion (AIC) and the Bayesian Information Criterion (BIC), extracted via the estat ic command. The model presenting the lowest deviance, along with the lowest AIC and BIC values, was selected as the optimal model.
Random effects and variance measures
Random effects were quantified using the between-cluster variance (VA), the Intraclass Correlation Coefficient (ICC) extracted via the estat icc command, and the Proportional Change in Variance (PCV). The ICC measures the proportion of total variance attributable to differences between clusters. It was calculated by utilizing the standard logistic variance at the individual level, which is mathematically fixed at π2/3≈3.29 in accordance with recommendations for multilevel logistic models [25,26].
ICC = * 100%, (where VA represents the variance at the area/cluster level [25,27].
The PCV reveals the proportion of this between-cluster variance explained by the progressive introduction of the blocks of fixed factors, and is calculated as follows:
PCV = * 100%, (where Vnull is the variance of the initial/null model and VA is the variance of the model including additional terms [25].
Sensitivity analysis
To evaluate the robustness of the estimations against weight specification choices and to rule out any structural artefacts induced by the weighting protocol, a rigorous sensitivity analysis was conducted [25,27]. The full model (Model 2) was estimated under two distinct specifications: first, using the two-level rescaled weights (w_ij_scaled and w_cluster), and second, without any weighting (unweighted random-effects model). The coefficients, average marginal effects, and standard errors from both approaches were systematically compared using the estimates table command to verify internal consistency.
Ethics approval
This study protocol constitutes a secondary analysis of fully de-identified and anonymized public-use data. Formal authorization to download and analyze the datasets was granted by the DHS Program (ICF International, Rockville, MD, USA). The primary Guinea Demographic and Health Surveys (DHS) conducted in 2005, 2012, and 2018 were approved by the Institutional Review Board (IRB) of ICF International and the National Ethics Committee for Health Research (Comité National d’Éthique pour la Recherche en Santé – CNERS) of Guinea. All survey participants provided informed consent prior to interviewing. All data analyses in this study were conducted in strict compliance with the DHS Program’s guidelines and regulations governing the secondary use of data, ensuring total participant confidentiality.
Socio-demographic characteristics of the participants in the 2005, 2012 and 2018 DHS, Guinea
This analysis included data from 6,330 women in the 2005 DHS, 6,994 in the 2012 DHS, and 7,951 in the 2018 DHS. Across all years, over 60% were aged 20–34, more than 90% of the women were in a union, the proportion of female-headed households increased from 9.88% in 2005 to 11.72% in 2018, and over 77% had no formal education. Women’s media exposure rose from 19.64% to 39.48%. An increase in the proportion of women with at least four antenatal care visits, rising from 51.39% in 2005 to 56.99% in 2012, followed by a substantial decline to 36.26% in 2018. Over 70% resided in rural areas (Table 1).
Trends in home delivery among women by category in Guinea, 2005, 2012 and 2018 DHS
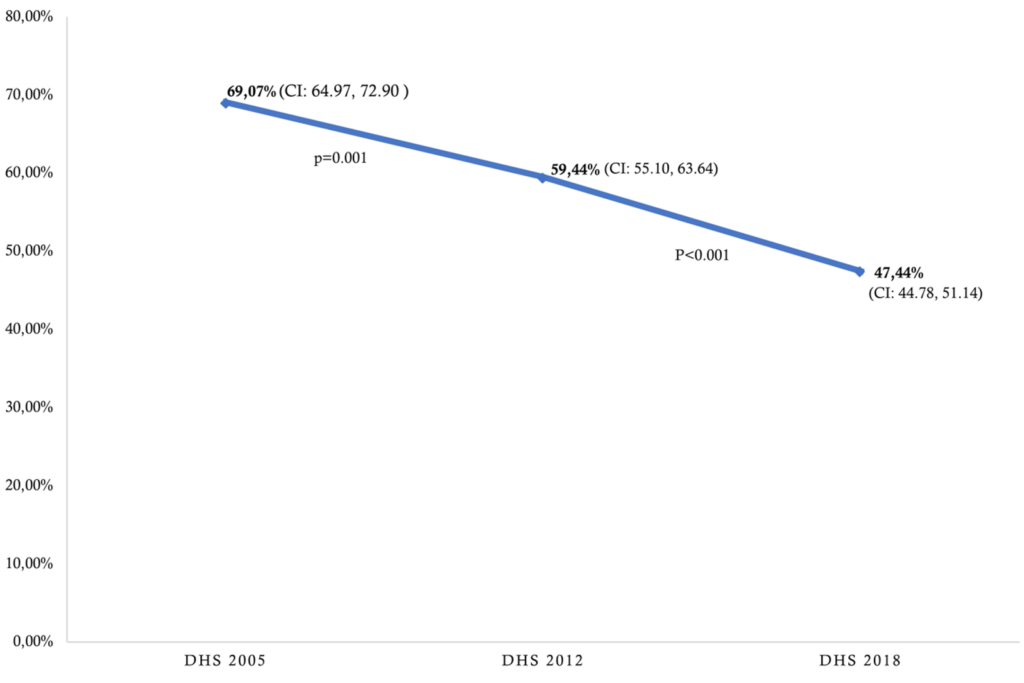
The proportion of home deliveries has decreased over time, from 69.07% (95% CI: 64.97-72.90) in 2005 to 59.44% (95% CI: 55.10-63.64) in 2012, and then to 47.44% (95% CI: 44.78-51.14) in 2018 (p-trend < 0.001) (Figure 1).
Between 2005 and 2018, home deliveries decreased by 9.7 percentage points (2005-2012) and by 12 percentage points (2012-2018). The reduction varied by women’s characteristics: 23.8 percentage points among working women vs. 12.9 percentage points among non-working; 8.4 percentage points for those exposed to media vs. 17.1 percentage points for those not; 26.2 percentage points for women with ≥4 ANC visits vs. 26.6 percentage points with fewer; and 19.7 percentage points in urban areas vs. 18.8 percentage points in rural areas (Table 2).
Multilevel model parameter results from DHS 2018 data, Guinea
Random effect and model comparison
Model 0 (Null Model): The baseline between-cluster variance (community variance) is high, standing at 3.91 (SE = 0.39). The Intraclass Correlation Coefficient (ICC) indicates that 54.34% of the total variance in the propensity for home delivery is attributable to contextual or community-level factors (cluster-related).
Model 2 (Full Model): The inclusion of contextual/community variables (type of place of residence and region) further reduces the between-cluster variance to 0.99 (SE = 0.14). The global PCV reaches 72.99%, meaning that the overall model (individual + community factors) explains nearly 73% of the initial variance between clusters. The ICC stabilises at 23.20%, confirming that a meaningful and statistically significant portion of delivery behaviour (approximately 23%) remains influenced by unobserved, purely contextual dynamics, even after full adjustment.
Model Fit (Fitness Model)Evaluation of the information criteria and overall statistical quality demonstrates a progressive and clear improvement in fit at each stage of the modelling process:
Model 2 (Full Model) displays the lowest deviance as well as the lowest AIC and BIC values. It is therefore selected as the optimal and most parsimonious model for the final analysis (Table 3).
Factors associated with home delivery in Guinea, DHS 2018
The adjusted odds ratios for home delivery in Guinea (Table 4) and the average marginal effects (AMEs) and adjusted predicted probabilities (Table 5) were derived from the final multilevel logistic regression model using the 2018 DHS data. After controlling for structural, household, and individual characteristics, several key variables emerged as significant correlates of home delivery.
Socioeconomic and demographic characteristics
Healthcare access and decision-making autonomy
Geographic and contextual factors
Sensitivity analysis
The comparison between the weighted multilevel model and the unweighted model presented in Table S1, demonstrates remarkable methodological robustness:
This close convergence rules out any risk of structural artifacts related to the weighting protocol and confirms the high internal validity of the study’s results.
This study examined trends and determinants of home delivery in Guinea over the period 2005–2018. The prevalence of home delivery declined substantially, from 69.1% in 2005 to 47.4% in 2018, representing a reduction of 21.7 percentage points. Despite this progress, nearly one in two births still occurred at home in 2018, highlighting persistent structural and socio-cultural barriers to facility-based delivery. The multilevel analysis identified women’s education, decision-making autonomy, number of antenatal care (ANC) visits, household wealth, place of residence, and region as key determinants of home delivery.
This decline coincided with the introduction of the policy of free maternal healthcare in 2011 [28]. Despite this policy, the rate of home deliveries remains high due to other factors such as the long distance between rural populations and maternal healthcare services, insufficient infrastructure and qualified and motivated healthcare personnel, and the costs associated with the transport [25]. This decline in the home delivery rate is similar to a study in Ethiopia, which found a 20.7% decrease from 94.2% in 2005 to 73.4% in 2016 [9]. Reducing the maternal mortality rate is one of the targets of the Sustainable Development Goals for 2030 [3]. In this study, the relatively high intra-class correlation observed in the null model highlights the importance of community factors in defining childbirth practices. The reduction in ICC after adjusting for individual and household characteristics indicates that part of the variation between clusters can be explained by these factors, while the remaining unexplained variance likely reflects contextual influences not captured in the DHS data, such as local norms, the availability and perceived quality of health services, and community trust in traditional birth attendants. This finding highlights the need for interventions that go beyond individual characteristics and address the broader social and health context.
Compositional Factors: Individual and Household Characteristics
Our findings indicate that maternal education is significantly associated with the choice of place of delivery, demonstrating a notable protective association among women with a secondary education or higher [6–8,12,13,29,30]. From an individual compositional perspective, a lack of formal schooling may limit a woman’s ability to fully access or interpret health promotion messages designed to encourage facility-based delivery and safe health behaviours. Furthermore, formal education is closely linked to increased maternal autonomy regarding healthcare decisions [31,32]. Consequently, women with limited or no formal education appear more vulnerable to traditional norms and external domestic pressures—particularly from spouses or extended family members—when determining their place of delivery.
Women who were not involved in their own healthcare decisions exhibited a higher probability of home delivery. This finding highlights the importance of women’s empowerment in improving the utilization of maternal health services. Studies conducted across sub-Saharan Africa have shown that women’s participation in health-related decisions is significantly associated with increased utilization of maternal care, including facility-based delivery [33,34].
Distance to health facilities remained a significant barrier to the utilization of obstetric services. Women who perceived distance as a major problem exhibited a higher probability of home delivery. This finding is consistent with evidence from several sub-Saharan African countries, where geographic barriers, transport difficulties, and remote healthcare structures continue to restrict the utilization of skilled attendance at delivery [35,36]. These constraints are particularly pronounced in rural areas, where physical access to obstetric services remains suboptimal.
In this study, having fewer than four antenatal care (ANC) visits was significantly associated with a higher probability of home delivery, a trend that is consistently corroborated across the literature [6,7,12,13]. According to the World Health Organization (WHO), antenatal care serves as a critical platform for the delivery of essential health services, including health promotion, to ensure a positive pregnancy experience [37]. During these routine consultations, pregnant women receive vital information regarding pregnancy and delivery outcomes, which helps build their confidence and encourages them to select health facilities for their delivery.
Household wealth was also an important determinant of home delivery. Women from wealthier households were significantly less likely to deliver at home than those from poorer households. Although several African countries have implemented policies providing free maternal healthcare services, indirect costs such as transportation, accommodation, and other non-medical expenses continue to represent substantial barriers for disadvantaged households. This association has been widely documented in studies conducted across sub-Saharan Africa [38,39]
In our study, religion was not significantly associated with home delivery. Studies conducted in sub-Saharan African countries have shown that religious affiliation may be associated with differences in the use of skilled obstetric services, although the magnitude and direction of this association vary across cultural contexts and healthcare systems [35,40]. The lack of an association observed in our study may reflect a relative homogeneity in healthcare-seeking behaviors across religious groups in Guinea or the predominant influence of other socioeconomic and geographic factors on the choice of place of delivery.
Contextual Factors: Environmental and Regional Characteristics
From a contextual perspective, women residing in rural areas exhibited a significantly higher probability of home delivery, a finding that is widely corroborated by studies in East Africa and the Philippines. In many rural contexts, quality healthcare remains structurally less accessible due to a shortage of functional health facilities, a lack of qualified medical staff, poor road networks, and deficient transportation infrastructure [41,42]. Furthermore, the prominent presence of traditional birth attendants in rural communities, coupled with the population’s established trust in their practices, represents a strong socio-cultural contextual factor that explains the persistent preference for home delivery [41,43]. Conversely, when physical access to health facilities is limited, access to vital information regarding maternal health practices is similarly constrained, which often lower awareness and utilization of formal delivery services [8,44].
Finally, significant regional disparities were observed. Women residing in the Labé region exhibited a higher probability of home delivery, whereas those in Nzérékoré demonstrated a lower probability of home delivery compared to women in Boké. These regional differences could be linked to variations in the geographic accessibility of health services, the availability of qualified staff, the socioeconomic characteristics of the populations, and the sociocultural norms influencing the utilization of care. Such regional disparities in the utilization of maternal healthcare services are widely documented in several studies [35,40].
Study limitations
This study has several limitations that warrant consideration when interpreting the findings. First, the DHS data utilize a cross-sectional design, which captures exposures and outcomes simultaneously; consequently, these findings must be interpreted strictly as statistical associations rather than direct evidence of causal impact. Second, because the data rely on self-reported information regarding maternal healthcare utilization, they may be subject to recall bias, particularly for deliveries that occurred further in the past.
Third, although a multilevel analytical framework was employed to account for community-level clustering, the explanatory power of these contextual factors should not be overstated. Several critical structural variables—such as the objective quality of obstetric care, real-time availability of emergency transport, financial geographic barriers, and implicit cultural norms—were not directly measured in the standard survey instruments. The absence of these parameters introduces the possibility of residual confounding, meaning that the observed community effects may partially reflect unmeasured structural inequities.
Nevertheless, the systematic application of weight denormalization and rescaling following Carle (2009), combined with a nationally representative sample, ensures that these adjusted predicted probabilities and marginal effects provide a highly robust, population-based baseline of the spatial and sociodemographic variations characterizing home delivery practices in Guinea.
In conclusion, while the rate of home delivery in Guinea has decreased by 21.7 percentage points between 2005 and 2018, it remains a common practice for nearly half of the population. The fully adjusted model highlights that structural and environmental barriers—most notably rural residence and regional location—exhibit the most robust magnitude of association with home delivery, alongside individual factors like education, wealth, and decision-making autonomy. These observational trends align closely with Guinea’s national priorities for maternal health, such as the National Reproductive Health Strategy and the National Health Development Plan.
While these observational data do not provide direct evidence of causal impact, the magnitude of the reported marginal effects offers critical, evidence-informed entry points for targeted public health interventions:
What is already known about the topic
What this study adds
The authors of this work declare no competing interests.
Data sharing statement: DHS data is available publicly. To use data, prior request explaining reason is required at https://dhsprogram.com/data/available-datasets.cfm
Author’s contributions: SS conceived and designed the study, collected the data with DD did the statistical analysis and wrote the first draft. SS, DD, HFC, AS, MK, FC provided technical inputs during the study’s conceptualization and revised this manuscript. AAT and ASM with the statistical analysis and draft of the manuscript. AD supervised the drafting of the manuscript. The final manuscript has been read and approved by all authors.
| Table 1: Socio-demographic characteristics of women aged 15-49 in the 2005, 2012 and 2018 DHS, Guinea | ||||||
| Variables | DHS 2005 (n = 6,330) | DHS 2012 (n = 6,994) | DHS 2018 (n = 7,951) | |||
|---|---|---|---|---|---|---|
| n | (%)a | n | (%)a | n | (%)a | |
| Age (years) | ||||||
| 15–19 | 472 | 7.47 | 665 | 9.62 | 650 | 8.31 |
| 20–34 | 3,989 | 63.46 | 4,625 | 66.47 | 5,284 | 66.65 |
| 35–49 | 1,869 | 29.07 | 1,704 | 23.91 | 2,017 | 25.04 |
| Sex of head of household | ||||||
| Male | 5,732 | 90.12 | 6,182 | 88.01 | 7,035 | 88.28 |
| Female | 598 | 9.88 | 812 | 11.99 | 916 | 11.72 |
| Marital status | ||||||
| Not in union | 289 | 5.04 | 467 | 7.09 | 554 | 7.46 |
| In union | 6,041 | 94.96 | 6,527 | 92.91 | 7,397 | 92.54 |
| Education level | ||||||
| None | 5,552 | 87.02 | 5,471 | 77.90 | 6,132 | 77.10 |
| Primary | 494 | 8.26 | 826 | 12.11 | 878 | 10.75 |
| Secondary or higher | 284 | 4.72 | 697 | 9.99 | 941 | 12.15 |
| Husband’s level of education | ||||||
| None | 4,807 | 77.25 | 4,766 | 69.72 | 5,493 | 73.36 |
| Primary | 508 | 8.72 | 696 | 11.19 | 531 | 7.07 |
| Secondary or higher | 810 | 14.03 | 1,199 | 19.09 | 1,400 | 19.57 |
| Work status | ||||||
| Not working | 973 | 14.51 | 1,432 | 21.39 | 2,547 | 30.90 |
| Working | 5,349 | 85.49 | 5,554 | 79.41 | 5,404 | 69.10 |
| Religion | ||||||
| Muslim | 5,583 | 85.66 | 6,354 | 87.77 | 7,214 | 88.05 |
| Christian | 515 | 9.67 | 466 | 7.86 | 657 | 10.24 |
| Others | 232 | 4.67 | 360 | 4.36 | 80 | 1.71 |
| Women’s media exposure | ||||||
| Not at all | 5,178 | 80.36 | 4,378 | 62.65 | 4,904 | 60.52 |
| Yes | 1,149 | 19.64 | 2,606 | 37.35 | 3,047 | 39.48 |
| Health care decision making | ||||||
| Women not involved | 3,592 | 56.08 | 4,437 | 68.41 | 4,674 | 60.40 |
| Woman involved | 2,728 | 43.92 | 2,087 | 31.59 | 2,830 | 39.60 |
| Distance to health facility | ||||||
| Not a big problem | 2,720 | 43.02 | – | – | 3,902 | 49.08 |
| Big problem | 3,602 | 56.98 | – | – | 4,049 | 50.92 |
| Number of antenatal visits | ||||||
| Less than 4 | 2,065 | 48.61 | 2,140 | 43.01 | 3,462 | 63.74 |
| At least 4 | 2,163 | 51.39 | 2,824 | 56.99 | 1,921 | 36.26 |
| Parity | ||||||
| ≤ 2 | 1,735 | 27.36 | 2,386 | 34.78 | 2,488 | 31.77 |
| 3–4 | 1,889 | 30.06 | 1,977 | 28.43 | 2,774 | 34.73 |
| 5 or higher | 2,706 | 42.58 | 2,631 | 36.79 | 2,689 | 33.50 |
| Household wealth index | ||||||
| Poorer | 2,128 | 33.75 | 2,332 | 32.33 | 2,651 | 32.26 |
| Middle | 2,092 | 32.02 | 2,332 | 35.02 | 2,650 | 34.29 |
| Richer | 2,110 | 34.23 | 2,333 | 32.65 | 2,650 | 33.45 |
| Place of residence | ||||||
| Urban | 1,366 | 22.60 | 2,025 | 26.24 | 2,239 | 28.48 |
| Rural | 4,964 | 77.40 | 4,969 | 73.76 | 5,712 | 71.52 |
| Administrative region | ||||||
| Boke | 805 | 11.63 | 676 | 9.33 | 1,119 | 10.49 |
| Conakry | 501 | 10.03 | 766 | 14.24 | 696 | 11.43 |
| Faranah | 833 | 8.49 | 1,114 | 10.59 | 1,058 | 10.40 |
| Kankan | 1,031 | 15.23 | 1,199 | 18.23 | 1,309 | 18.66 |
| Kindia | 939 | 14.85 | 795 | 14.54 | 1,082 | 15.29 |
| Labe | 631 | 9.74 | 813 | 8.92 | 961 | 11.28 |
| Mamou | 630 | 6.61 | 745 | 6.64 | 773 | 7.54 |
| Nzerekore | 960 | 23.42 | 886 | 17.51 | 953 | 14.91 |
| N: Unweighted sample size; (%)a: Weighted percentage; DHS: Demographic and Health Survey | ||||||
| Variables | DHS 2005 | DHS 2012 | DHS 2018 | Percentage differences | ||
|---|---|---|---|---|---|---|
| (%) ª | (%) ª | (%) ª | 2005–2012 | 2012–2018 | 2005–2018 | |
| Diff. | Diff. | Diff. | ||||
| Age (years) | ||||||
| 15–19 | 62.64 | 59.98 | 41.36 | 2.66 ns | 18.62 *** | 21.28 *** |
| 20–34 | 68.09 | 57.97 | 46.78 | 10.12 ** | 11.19 *** | 21.31 *** |
| 35–49 | 72.87 ** | 63.33 * | 51.23 ** | 9.54 ** | 12.10 ** | 21.64 *** |
| Sex of head of household | ||||||
| Male | 70.23 | 60.26 | 48.73 | 9.97 ** | 11.53 *** | 21.50 *** |
| Female | 58.51 ** | 53.44 * | 37.75 ** | 5.07 ns | 15.69 *** | 20.76 *** |
| Marital status | ||||||
| Not in union | 55.76 | 42.28 | 27.28 | 13.48 * | 15.00 *** | 28.48 *** |
| In union | 69.78 *** | 60.75 *** | 49.07 *** | 9.03 ** | 11.68 *** | 20.71 *** |
| Education level | ||||||
| None | 73.33 | 66.58 | 53.98 | 6.75 ** | 12.60 *** | 19.35 *** |
| Primary | 48.70 | 43.89 | 37.95 | 4.81 ns | 5.94 ns | 10.75 ** |
| Secondary or higher | 26.32 *** | 22.63 *** | 14.38 *** | 3.69 ns | 8.25 ** | 11.94 *** |
| Husband’s level of education | ||||||
| None | 75.79 | 68.89 | 56.09 | 6.9 ** | 12.80 *** | 19.70 *** |
| Primary | 64.81 | 54.75 | 42.98 | 10.06 * | 11.77 * | 21.83 *** |
| Secondary or higher | 40.86 *** | 33.57 *** | 23.53 *** | 7.29 * | 10.04 *** | 17.33 *** |
| Work status | ||||||
| Not working | 62.65 | 46.23 | 49.80 | 16.42 *** | -3.57 ns | 12.85 ** |
| Working | 70.15 ** | 62.81 *** | 46.39 | 7.34 * | 16.42 *** | 23.76 *** |
| Religion | ||||||
| Muslim | 70.48 | 60.44 | 50.68 | 10.04 *** | 9.76 *** | 19.80 *** |
| Christian | 57.64 | 44.42 | 24.81 | 13.22 ns | 19.61 ** | 32.83 *** |
| Others | 66.91 ns | 64.44 ** | 16.30 *** | 2.47 ns | 48.14 *** | 50.61 *** |
| Women’s media exposure | ||||||
| Not at all | 76.99 | 71.79 | 59.93 | 5.2 ns | 11.86 *** | 17.06 *** |
| Yes | 36.67 *** | 38.68 *** | 28.30 *** | -2.01 ns | 10.38 *** | 8.37 ** |
| Health care decision making | ||||||
| Women not involved | 69.18 | 61.05 | 51.37 | 8.13 ** | 9.68 *** | 17.82 *** |
| Woman involved | 68.95 ns | 60.27 ns | 44.43 ** | 9.68 * | 15.84 *** | 24.52 *** |
| Number of antenatal visits | ||||||
| Less than 4 | 83.58 | 76.47 | 56.59 | 7.11 ** | 19.88 *** | 26.59 *** |
| At least 4 | 54.70 *** | 44.56 *** | 28.52 *** | 10.14 *** | 16.04 *** | 26.18 *** |
| Parity | ||||||
| ≤ 2 | 62.79 | 52.21 | 39.83 | 10.52 *** | 12.38 *** | 22.96 *** |
| 3–4 | 68.21 | 59.12 | 47.83 | 9.09 ** | 11.29 *** | 20.38 *** |
| 5 or higher | 73.72 *** | 66.53 *** | 54.26 *** | 7.19 * | 12.27 *** | 19.46 *** |
| Household wealth index | ||||||
| Poorer | 87.61 | 81.23 | 71.92 | 6.38 * | 9.31 ** | 15.69 *** |
| Middle | 76.12 | 65.52 | 52.07 | 10.6 ** | 13.45 *** | 24.05 *** |
| Richer | 44.21 *** | 31.36 *** | 19.10 *** | 6.60 *** | 12.26 *** | 25.11 *** |
| Place of residence | ||||||
| Urban | 35.61 | 28.53 | 15.87 | 7.08 * | 12.66 *** | 19.74 *** |
| Rural | 78.85 *** | 70.44 *** | 60.02 *** | 8.41 ** | 10.42 ** | 18.83 *** |
| Administrative region | ||||||
| Boke | 74.77 | 62.20 | 57.90 | 12.57 ns | 4.30 ns | 16.87 ** |
| Conakry | 29.47 | 19.10 | 10.24 | 10.37 * | 8.86 ** | 19.23 *** |
| Faranah | 76.89 | 70.80 | 65.60 | 6.09 ns | 5.20 ns | 11.29 * |
| Kankan | 67.96 | 59.46 | 48.40 | 8.50 ns | 11.06 | 19.56 ** |
| Kindia | 72.03 | 63.79 | 49.28 | 8.24 ns | 14.51 * | 22.75 ** |
| Labe | 84.47 *** | 72.68 *** | 69.67 *** | 11.79 ** | 3.01 ns | 14.80 ** |
| Mamou | 84.24 | 80.98 | 62.45 | 3.26 ns | 18.53 ** | 21.79 *** |
| Nzerekore | 68.54 | 65.40 | 28.46 | 3.14 ns | 36.94 *** | 40.08 *** |
| Prevalence of home delivery (95% CI) | 69.07 (64.97–72.90) | 59.44 (55.10–63.64) | 47.44 (44.78–51.14) | 9.63 *** | 12.00 *** | 21.63 *** |
| Table 3: Random effects and model fitness, DHS 2018, Guinea | |||
| Random effects | Model 0 | Model 1 | Model 2 |
|---|---|---|---|
| Community variance (SE) | 3.91 (0.39) | 1.08 (0.17) | 0.99 (0.14) |
| ICC (%) | 54.34 (49.39–59.18) | 24.77 (19.48–30.95) | 23.20 (18.49–28.90) |
| PCV (%) | Reference | 72.33 | 72.99 |
| Fitness model | Model 0 | Model 1 | Model 2 |
| AIC | 8258.126 | 4936.78 | 4842.905 |
| BIC | 8272.089 | 5060.362 | 5018.522 |
| Log pseudolikelihood | -4127.063 | -2449.39 | -2394.453 |
| Deviance | 8254.126 | 4898.78 | 4788.906 |
| Number of observations (N) | 7,951 | 4,936 | 4,936 |
| ICC: Intra-class Correlation Coefficient; SE: Standard Error; PCV: Proportional change in variance | |||
| Table 4: Adjusted odds ratios for home delivery among women in Guinea, DHS 2018 | ||
|---|---|---|
| Variables and Modalities | Model 1 AOR (95% CI) | Model 2 AOR (95% CI) |
| Age (years) | ||
| 15–19 | Ref. | Ref. |
| 20–34 | 1.31 (0.91-1.88) | 1.35 (0.93-1.95) |
| 35–49 | 1.32 (0.86-2.04) | 1.38 (0.89-2.13) |
| Sex of head of household | ||
| Male | Ref. | Ref. |
| Female | 0.78 (0.59-1.04) | 0.75 (0.56-1.02) |
| Education level | ||
| None | Ref. | Ref. |
| Primary | 0.90 (0.68-1.18) | 0.90 (0.68-1.20) |
| Secondary or higher | 0.55 (0.38-0.79)** | 0.55 (0.38-0.80)** |
| Husband’s level of education | ||
| None | Ref. | Ref. |
| Primary | 0.95 (0.67-1.36) | 0.93 (0.65-1.32) |
| Secondary or higher | 0.76 (0.59-0.98)* | 0.80 (0.62-1.04) |
| Religion | ||
| Muslim | Ref. | Ref. |
| Christian | 0.24 (0.13-0.43)*** | 0.52 (0.26-1.02) |
| Animist | 0.23 (0.10 (0.56)** | 0.54 (0.21-1.44) |
| Women’s media exposure | ||
| Not at all | Ref. | Ref. |
| Yes | 0.72 (0.57-0.91)** | 0.84 (0.67-1.06) |
| Healthcare decision making | ||
| Woman involved | Ref. | Ref. |
| Women not involved | 1.32 (1.08-1.61)** | 1.33 (1.09-1.62)** |
| Distance to health facility | ||
| Not a big problem | Ref. | Ref. |
| Big problem | 1.66 (1.38-1.99)*** | 1.54 (1.28-1.87)*** |
| Number of antenatal visits | ||
| Less than 4 | 2.28 (1.88-2.77)*** | 2.37 (1/94-2/89)*** |
| At least 4 | Ref. | Ref. |
| Parity | ||
| ≤ 2 | Ref. | Ref. |
| 3–4 | 1.15 (0.92-1.44) | 1.17 (0.93-1.46) |
| 5 or higher | 1.17 (0.88-1.55) | 1.15 (0.86-1.52) |
| Household wealth index | ||
| Poorer | Ref. | Ref. |
| Middle | 0.63 (0.52-0.77)*** | 0.68 (0.57-0.82)*** |
| Richer | 0.23 (0.16-0.32)*** | 0.41 (0.29-0.58)*** |
| Place of residence | ||
| Urban | Ref. | |
| Rural | 3.36 (2.24-5.5)*** | |
| Administrative region | ||
| Boke | Ref. | |
| Conakry | 0.61 (0.31-1.21) | |
| Faranah | 1.57 (0.88-2.81) | |
| Kankan | 0.84 (0.49-1.44) | |
| Kindia | 0.96 (0.58-1.61) | |
| Labe | 1.82 (1.02-3.26)* | |
| Mamou | 0.96 (0.58-1.57) | |
| Nzerekore | 0.29 (0.13-0.63)** | |
| AOR: Adjusted Odds Ratio; CI: Confidence Interval; Ref: Reference category Statistical significance: *p < 0.05; **p < 0.01; ***p < 0.001 | ||
| Table 5: Marginal Effects, and Predicted Probabilities of factors associated with home delivery (final multilevel logistic model), DHS 2018, Guinea | |||
|---|---|---|---|
| Variables and Modalities | Marginal Effects | Adjusted predicted probabilities (%) (95% CI) | p-value |
| Age (years) | |||
| 15–19 | Ref. | 43.29 (37.78-48.79) | |
| 20–34 | 0.046 | 47.91 (45.41-50.42) | 0.109 |
| 35–49 | 0.05 | 48.25 (44.72-51.77) | 0.149 |
| Sex of head of household | |||
| Male | Ref. | 48.01 (45.70-50.33) | |
| Female | -0.043 | 43.66 (38.97-48.34) | 0.063 |
| Education level | |||
| None | Ref. | 48.52 (46.16-50.88) | |
| Primary | -0.016 | 46.92 (42.26-51.59) | 0.48 |
| Secondary or higher | -0.09 | 39.20 (33.43-44.98) | 0.002 |
| Husband’s level of education | |||
| None | Ref. | 48.22 (45.73-50.71) | |
| Primary | -0.011 | 47.10 (41.51-52.69) | 0.692 |
| Secondary or higher | -0.034 | 44.82 (40.99-48.66) | 0.102 |
| Religion | |||
| Muslim | Ref. | 48.82 (46.09-51.54) | |
| Christian | -0.102 | 38.57 (29.05-48.09) | 0.059 |
| Animist | -0.095 | 39.30 (25.01-53.58) | 0.219 |
| Women’s media exposure | |||
| Not at all | Ref. | 48.48 (45.84-51.14) | |
| Yes | -0.027 | 45.82 (42.57-49.08) | 0.156 |
| Healthcare decision making | |||
| Woman involved | Ref. | 44.91 (41.88-47.95) | |
| Women not involved | 0.044 | 49.33 (46.84-51.82) | 0.005 |
| Distance to health facility | |||
| Not a big problem | Ref. | 44.00 (41.24-46.75) | |
| Big problem | 0.069 | 50.88 (48.10-53.67) | < 0.001 |
| Number of antenatal visits | |||
| Less than 4 | 0.138 | 38.41 (35.35-41.46) | < 0.001 |
| At least 4 | Ref. | 52.21 (49.65-54.77) | |
| Parity | |||
| ≤ 2 | Ref. | 46.07 (42.67-49.47) | |
| 3–4 | 0.024 | 48.45 (45.68-51.22) | 0.179 |
| 5 or higher | 0.021 | 48.19 (44.91-51.47) | 0.344 |
| Household wealth index | |||
| Poorer | Ref. | 54.01 (50.69-57.33) | |
| Middle | -0.063 | 47.67 (44.74-50.60) | < 0.001 |
| Richer | -0.146 | 39.45 (34.67-44.23) | < 0.001 |
| Place of residence | |||
| Urban | Ref. | 32.05 (27.08-37.02) | |
| Rural | 0.202 | 52.24 (48.93-55.56) | < 0.001 |
| Administrative region | |||
| Boke | Ref. | 50.20 (43.31-57.08) | |
| Conakry | -0.08 | 42.16 (32.70-51.62) | 0.165 |
| Faranah | 0.074 | 57.58 (51.05-64.12) | 0.126 |
| Kankan | -0.029 | 47.29 (41.29-53.29) | 0.526 |
| Kindia | -0.006 | 49.57 (44.18-54.97) | 0.886 |
| Labe | 0.097 | 59.95 (53.47-66.43) | 0.04 |
| Mamou | -0.007 | 49.52 (44.68-54.36) | 0.872 |
| Nzerekore | -0.2 | 30.18 (20.73-39.63) | 0.001 |
| CI: Confidence Interval; Ref: Reference category | |||