
Research | Open Access | Volume 9 (Suppl 12): Article 10 | Published: 30 Jul 2026

Views: 1,001
Menu, Tables and Figures
| Table 1: Socio-demographic characteristics of the respondents | ||
|---|---|---|
| Socio-demographic characteristics | n | % |
| Gender | ||
| Female | 32 | 40.0 |
| Male | 48 | 60.0 |
| Age (years) | ||
| 18 – 25 | 8 | 10.0 |
| 26 – 35 | 37 | 46.0 |
| 36 – 45 | 31 | 39.0 |
| 46 and above | 4 | 5.0 |
| Education Level | ||
| Ordinary level certificate | 5 | 6.3 |
| Diploma (Diploma, National Diploma and HND) | 10 | 12.5 |
| Bachelor’s Degree | 30 | 37.5 |
| Master’s Degree | 32 | 40.0 |
| PhD | 3 | 3.7 |
| Years of Work Experience | ||
| <1 year | 7 | 8.8 |
| 1 – 5 years | 37 | 46.2 |
| 6 – 10 years | 22 | 27.5 |
| >10 years | 14 | 17.5 |
Table 1: Sociodemographic characteristics of the respondents
| Table 2: Bivariate analysis between sociodemographic characteristic vs knowledge | ||||
|---|---|---|---|---|
| Characteristic | Good knowledge N = 58 (%) | Poor knowledge N = 22 (%) | Chi-square | p-value |
| Gender | ||||
| Female | 24 (41.0) | 8 (36.0) | 0.167 | 0.9 |
| Male | 34 (59.0) | 14 (64.0) | ||
| Age group | ||||
| 18 – 25 | 4 (6.9) | 4 (18.0) | 3.597 | 0.3 |
| 26 – 35 | 27 (47.1) | 10 (45.0) | ||
| 36 – 45 | 23 (40.1) | 8 (36.0) | ||
| 46 and above | 4 (6.9) | 0 (0) | ||
| Education Level | ||||
| O level | 1 (1.7) | 4 (18.2) | 9.237 | 0.055 |
| Diploma (Diploma, National Diploma and HND) | 6 (10.3) | 4 (18.2) | ||
| Bachelor’s Degree | 23 (39.7) | 7 (31.8) | ||
| Master’s Degree | 26 (44.8) | 6 (27.3) | ||
| PhD | 2 (3.4) | 1 (4.5) | ||
| Years of Work Experience | ||||
| <1 year | 4 (6.9) | 3 (14.0) | 7.098 | 0.069 |
| >10 years | 14 (24.1) | 0 (0.0) | ||
| 1 – 5 years | 26 (45.0) | 11 (50.0) | ||
| 6 – 10 years | 14 (24.0) | 8 (36.0) | ||
| Job Role | ||||
| Admin | 1 (1.7) | 0 (0.0) | 8.832 | 0.183 |
| Biomedical engineers | 3 (5.2) | 1 (4.5) | ||
| Data officer | 0 (0.0) | 1 (4.5) | ||
| Facility Managers | 7 (12.1) | 2 (9.0) | ||
| Interns | 5 (8.6) | 2 (9.0) | ||
| Laboratory scientists | 39 (67.2) | 11 (50.0) | ||
| Waste managers | 3 (5.2) | 5 (23.0) | ||
| Have you received an initial orientation training on bio-safety and waste management? | ||||
| No | 1 (1.7) | 5 (22.7) | 10.142 | 0.006* |
| yes | 57 (98.3) | 17 (77.3) | ||
| If yes, when was your last training? | ||||
| <1 year | 28 (48.0) | 11 (50.0) | 1.107 | 0.6 |
| >3 years ago | 4 (6.9) | 3 (14.0) | ||
| 1 – 3 years ago | 26 (45.1) | 8 (36.0) | ||
| How often do you handle biological materials? | ||||
| Daily | 44 (76.0) | 16 (73.0) | 3.308 | 0.347 |
| Monthly | 2 (3.4) | 3 (14.0) | ||
| Rarely | 6 (10.3) | 2 (9.1) | ||
| Weekly | 6 (10.3) | 1 (4.5) | ||
| Does your laboratory have a bio-safety manual? | ||||
| No | 1 (1.7) | 1 (4.5) | 2.993 | 0.224 |
| Not sure | 1 (1.7) | 2 (9.1) | ||
| Yes | 56 (97.0) | 19 (86.0) | ||
| Does your laboratory conduct bio-safety audits? | ||||
| No | 3 (5.2) | 0 (0.0) | 2.339 | 0.311 |
| Not sure | 7 (12.0) | 1 (4.5) | ||
| Yes | 48 (83.0) | 21 (95.0) | ||
Table 2: Bivariate analysis between sociodemographic characteristic and knowledge of biosafety and Waste Management among staff of NCDC National Reference Laboratory, Abuja, Nigeria
| Table 3: Bivariate analysis between sociodemographic characteristics and attitude of biosafety and Waste Management among staff of NCDC National Reference Laboratory, Abuja, Nigeria | ||||
|---|---|---|---|---|
| Characteristic | Positive N = 77 (%) | Negative N = 3 (%) | Chi-square | p-value |
| Gender | ||||
| Female | 32 (42.0) | 0 (0.0) | 2.078 | 0.149 |
| Male | 45 (58.0) | 3 (100.0) | ||
| Age | ||||
| 18 – 25 | 8 (10.0) | 0 (0.0) | 3.622 | 0.305 |
| 26 – 35 | 34 (44.0) | 3 (100) | ||
| 36 – 45 | 31 (40.0) | 0 (0.0) | ||
| 46 and above | 4 (5.2) | 0 (0.0) | ||
| Education Level | ||||
| O level | 5 (6.5) | 0 (0.0) | 21.188 | <0.001* |
| Diploma (Diploma, National Diploma and HND) | 7 (9.1) | 3 (100) | ||
| Bachelor’s Degree | 30 (39.0) | 0 (0.0) | ||
| Master’s Degree | 32 (42.0) | 0 (0.0) | ||
| PhD | 3 (3.9) | 0 (0.0) | ||
| Years of Work Experience | ||||
| <1 year | 7 (9.1) | 0 (0.0) | 3.622 | 0.305 |
| >10 years | 14 (18.0) | 0 (0.0) | ||
| 1 – 5 years | 34 (44.0) | 3 (100.0) | ||
| 6 – 10 years | 22 (29.0) | 0 (0.0) | ||
| Job Role | ||||
| Admin | 1 (1.3) | 0 (0.0) | 12.660 | 0.049* |
| Biomedical engineers | 4 (5.2) | 0 (0.0) | ||
| Data officer | 1 (1.3) | 0 (0.0) | ||
| Facility Managers | 7 (9.1) | 2 (67.0) | ||
| Interns | 7 (9.1) | 0 (0.0) | ||
| Laboratory scientists | 50 (65.0) | 0 (0.0) | ||
| Waste managers | 7 (9.1) | 1 (33.0) | ||
| Have you received an initial orientation training on biosafety and waste management? | ||||
| No | 5 (6.5) | 1 (33.0) | 2.998 | 0.083 |
| yes | 72 (93.5) | 2 (67.0) | ||
| If yes, when was your last training? | ||||
| <1 year | 37 (48.0) | 2 (67.0) | 0.540 | 0.764 |
| >3 years ago | 7 (9.0) | 0 (0.0) | ||
| 1 – 3 years ago | 33 (43.0) | 1 (33.0) | ||
| How often do you handle biological materials? | ||||
| Daily | 58 (75.0) | 2 (67.0) | 4.271 | 0.234 |
| Monthly | 4 (5.2) | 1 (33.0) | ||
| Rarely | 8 (10.0) | 0 (0.0) | ||
| Weekly | 7 (9.1) | 0 (0.0) | ||
| Does your laboratory have a biosafety manual? | ||||
| No | 2 (2.6) | 0 (0.0) | 0.208 | 0.901 |
| Not sure | 3 (3.9) | 0 (0.0) | ||
| Yes | 72 (93.5) | 3 (100.0) | ||
| Does your laboratory conduct biosafety audits? | ||||
| No | 2 (2.6) | 1 (33.0) | 7.724 | 0.021* |
| Not sure | 8 (10.3) | 0 (0.0) | ||
| Yes | 67 (87.0) | 2 (67.0) | ||
| *-Significant at p-value < 0.05 | ||||
Table 3: Bivariate analysis between sociodemographic characteristics and attitudes towards biosafety and Waste Management among staff of NCDC National Reference Laboratory, Abuja, Nigeria
| Table 4: Bivariate analysis between sociodemographic characteristics and practice of biosafety and Waste Management among staff of NCDC National Reference Laboratory, Abuja, Nigeria | ||||
|---|---|---|---|---|
| Characteristic | Good N = 75 (%) | Poor N = 5 (%) | Chi-square | p-value |
| Gender | ||||
| Female | 29 (39.0) | 3 (60.0) | 0.889 | 0.346 |
| Male | 46 (61.0) | 2 (40.0) | ||
| Age | ||||
| 18 – 25 | 8 (11.0) | 0 (0.0) | 1.020 | 0.796 |
| 26 – 35 | 34 (45.0) | 3 (60.0) | ||
| 36 – 45 | 29 (39.0) | 2 (40.0) | ||
| 46 and above | 4 (5.3) | 0 (0.0) | ||
| Education Level | ||||
| O level | 5 (6.7) | 0 (0.0) | 2.027 | 0.731 |
| Diploma (Diploma, National Diploma and HND) | 9 (12.0) | 1 (20.0) | ||
| Bachelor’s Degree | 27 (36.0) | 3 (60.0) | ||
| Master’s Degree | 31 (41.0) | 1 (20.0) | ||
| PhD | 3 (4.0) | 0 (0.0) | ||
| Years of Work Experience | ||||
| <1 year | 7 (9.3) | 0 (0.0) | 0.813 | 0.846 |
| >10 years | 13 (17.0) | 1 (20.0) | ||
| 1 – 5 years | 34 (45.0) | 3 (60.0) | ||
| 6 – 10 years | 21 (28.0) | 1 (20.0) | ||
| Job Role | ||||
| Admin | 1 (1.3) | 0 (0.0) | 13.099 | 0.041* |
| Biomedical engineers | 4 (5.3) | 0 (0.0) | ||
| Data officer | 1 (1.3) | 0 (0.0) | ||
| Facility Managers | 6 (8.0) | 3 (60.0) | ||
| Interns | 7 (9.3) | 0 (0.0) | ||
| Laboratory scientists | 48 (64.0) | 2 (40.0) | ||
| Waste managers | 8 (11.0) | 0 (0.0) | ||
| Have you received an initial orientation training on biosafety and waste management? | ||||
| No | 5 (6.7) | 1 (20.0) | 1.201 | 0.330 |
| yes | 70 (93.3) | 4 (80.0) | ||
| If yes, when was your last training? | ||||
| <1 year | 37 (49.0) | 2 (40.0) | 0.935 | 0.627 |
| >3 years ago | 7 (9.3) | 0 (0.0) | ||
| 1 – 3 years ago | 31 (41.0) | 3 (60.0) | ||
| How often do you handle biological materials? | ||||
| Daily | 56 (75.0) | 4 (80.0) | 2.631 | 0.452 |
| Monthly | 4 (5.3) | 1 (20.0) | ||
| Rarely | 8 (11.0) | 0 (0.0) | ||
| Weekly | 7 (9.3) | 0 (0.0) | ||
| Does your laboratory have a biosafety manual? | ||||
| No | 2 (2.7) | 0 (0.0) | 0.356 | 0.837 |
| Not sure | 3 (4.0) | 0 (0.0) | ||
| Yes | 70 (93.3) | 5 (100.0) | ||
| Does your laboratory conduct biosafety audits? | ||||
| No | 2 (2.7) | 1 (20.0) | 4.313 | 0.116 |
| Not sure | 8 (11.3) | 0 (0.0) | ||
| Yes | 65 (87.0) | 4 (80.0) | ||
| *-Significant at p-value < 0.05 | ||||
Table 4: Bivariate analysis between sociodemographic characteristics and practice of biosafety and Waste Management among staff of NCDC National Reference Laboratory, Abuja, Nigeria
Ikechukwu Nnaji1,&, Amos Dangana1, Oluwapelumi Enoch Fasulu2, MacDonald Somtochukwu Maduabuchi3, Precious Nengak Danladi4, Eugene Samuel Bwede1, Abiodun Jumoke Egwuenu1, James Christopher Avong1, Chima Emmanuel Ihemeje1, Olajumoke Atinuke Babatunde1, Charles Chibuike Korie3, Olubunmi Ruth Negedu-Momoh5, Nkiruka Lynda Uzoebo1, Chidiebere Emmanuel Opara1, Ndidi Paschaline Agala6, Ogarega Usiegbodi Daudu1, Olajide Idris1
1National Reference Laboratory, Nigeria Centre for Disease Control (NCDC) Abuja, Nigeria, 2Department of Public Health, Ahmadu Bello University (ABU) Zaria, Nigeria. Medical Laboratory Science Department, 3University of Nigeria Teaching Hospital (UNTH) Enugu, Nigeria, 4Environmental Surveillance Project in Nigeria, Africa Field Epidemiology Network (AFENET), Abuja, Nigeria, 5International Health Regulations, UK Health Security Agency (UKHSA), Abuja, Nigeria, 6Biorepository Unit, AIDS Prevention Initiative in Nigeria (APIN) Abuja, Nigeria
&Corresponding author: Ikechukwu Nnaji, National Reference Laboratory, Nigeria Centre for Disease Control and Prevention (NCDC), Abuja, Nigeria, Email: ikechukwu.nnaji@ncdc.gov.ng ORCID: https://orcid.org/0009-0006-5950-8927
Received: 19 Nov 2025, Accepted: 25 Jun 2026, Published: 30 Jul 2026
Domain: Infectious Disease Epidemiology
Keywords: Biosafety, Infectious Waste Management, Knowledge, Attitudes, Practice.
©Ikechukwu Nnaji et al. Journal of Interventional Epidemiology and Public Health (ISSN: 2664-2824). This is an Open Access article distributed under the terms of the Creative Commons Attribution International 4.0 License (https://creativecommons.org/licenses/by/4.0/), which permits unrestricted use, distribution, and reproduction in any medium, provided the original work is properly cited.
Cite this article: Ikechukwu Nnaji et al., Knowledge, attitudes, and practices of biosafety and infectious waste management at the NCDC National Reference Laboratory, Abuja, Nigeria. Journal of Interventional Epidemiology and Public Health. 2026; 9(Suppl 12):10. https://doi.org/10.37432/jieph-d-25-00292
Introduction: Biosafety (BS) and safe infectious waste management (IWM) knowledge are crucial for safeguarding the laboratory and its personnel and preventing the release of biological waste into the environment. Biosafety and infectious waste management practices are influenced by personnel’s attitude; hence, the need for status assessment to enable application of interventions that are suitable for the system. This study assessed the knowledge, attitudes and practices of biosafety and waste management among staff of the Nigeria Centre for Disease Control and Prevention National Reference Laboratory (NCDC-NRL), Abuja, Nigeria
Methods: The study was conducted from January to March 2025 using a cross-sectional study design. Technical and non- technical laboratory workers were sampled for this study. A structured questionnaire was used to collect data. The participants’ level of knowledge, attitude, and practice of biosafety and infectious waste management were assessed using SPSS version 20.0 for data analysis.
Results: Of the 105 staff in the NCDC-NRL, only 80 participated in this study. Of all participants, 61 (76%) demonstrated an understanding of biosafety, while 63 (78.8%) strongly agreed that proper management of infectious waste plays a critical role in reducing environmental and health risks. Regarding self-assessed confidence in BS and IWM knowledge, 38.8% of respondents reported being strongly confident of their BS and IWM knowledge. Overall, the majority of the participants, 72.5%, 96.3% and 93.8% had good knowledge, positive attitudes and good practices towards biosafety and infectious waste management, respectively. The knowledge of biosafety and infectious waste management was statistically significantly associated with prior bio-safety training (p = 0.006). Likewise, attitude was associated with education (p < 0.001), job role (p = 0.049), and bio-safety audit (p < 0.021). while the job role was associated with good practice (p-value = 0.041).
Conclusion: Significant knowledge exists among laboratory workers, and attitudes are mostly positive; however, some gaps still exist. Notably, knowledge needs to be fully translated into safe practices; as such, regular training and retraining of workers on biosafety and infectious waste management are highly recommended.
Healthcare waste has continued to be a concern across the globe, specifically from public health laboratories. “Hospital waste (HW)” as part of healthcare waste is referred to as all waste generated, whether biological or non-biological, that is discarded from the hospital and not intended for further use [1]. Across the world, the concept of healthcare waste poses a serious public health threat due to its increased risks of causing environmental and public health harm. Particularly, medical laboratories generate various categories of HW, including general, infectious, pathological, sharps, and chemical waste [2].
A well-equipped medical laboratory has the ability to perform diagnostic activities as well as operate across certain human-centred systems, systematically arming it with the ability to articulate responses to the risks of biosafety and biosecurity release of biological agents, whether accidental or intentional [3,4]. Broadly, laboratory waste includes infectious waste, pathological waste, laboratory sharps, chemical waste, pharmaceutical and cytotoxic waste, radioactive waste and non-hazardous waste [5]. Infectious waste includes blood-infected materials, infectious agent cultures, and contaminated consumables like bandages and swabs [6]. Laboratory sharps include syringes, needles, and disposable instruments like scalpels and blades. Pharmaceutical waste includes tainted or outdated medications, vaccinations, and sera, whereas common chemical waste includes mercury and different disinfectants. Some waste types, such as genotoxic waste and mutagenic, teratogenic, and carcinogenic materials, like radioactive diagnostic material and cytotoxic medications used to treat cancer, can be particularly hazardous and need to be handled carefully.
Approximately 10–25% of healthcare waste is hazardous and creates a variety of health risks if poorly managed [2]. The risk posed by HW, such as laboratory-acquired infections, injuries, toxicity, and cancers from carcinogenic chemical substances, should be mitigated in the interest of biosafety. Importantly, poor waste management practices may increase the risk of laboratory-acquired diseases, public health threats, and toxins, thus impeding biosecurity. Safe waste management requires a comprehensive system that will build capacities; as such, the significance of staff knowledge, attitudes, and practice cannot be overemphasized in such systems. Hence, the knowledge, attitudes, and practices of laboratory staff are becoming increasingly important given the growing interest in biosafety and waste management in public health [3][7].
Laboratory-acquired infections (LAIs) have significant burdens on public health. A comprehensive scoping review reported that about 309 LAIs related to 51 different pathogens were responsible for approximately 8 fatalities (2.6%) [8]. Among these, spills and needle stick injuries accounted for over 15% of documented infections [8]. Healthcare waste management poses a persistent global public health challenge, particularly in medical laboratories where hazardous biological and chemical materials are generated. Inadequate segregation, handling, and disposal practices increase the risk of laboratory-acquired infections (LAIs), environmental contamination, and breaches in biosafety and biosecurity. Despite existing guidelines, evidence suggests that knowledge, attitudes, and practices regarding biosafety and waste management remain suboptimal in many laboratory settings across low- and middle-income countries.
At the Nigeria Centre for Disease Control – National Reference Laboratory (NCDC-NRL), Abuja, routine diagnostic and research activities generate diverse categories of hazardous waste, underscoring the need to evaluate staff compliance with biosafety standards. However, limited data exist on the knowledge, attitude and practice of laboratory personnel in this context. This study, therefore, assessed the knowledge, attitudes, and practices of biosafety and waste management among staff of the NCDC-NRL Abuja to identify existing gaps and inform targeted interventions for improved laboratory safety and waste management systems.
Study setting
The Nigeria Centre for Disease Control (NCDC) National Reference Laboratory (NRL) is located in Gaduwa, Abuja, the Federal Capital Territory, and serves as the country’s apex public health laboratory. It functions under the Public Health Laboratory Services (PHL) department as the reference laboratory for many other state laboratories. Within the NRL are specialized units such as sample reception, bacteriology, molecular diagnostic laboratories for priority diseases like Lassa fever, measles, yellow fever, dengue fever, mpox, Ebola, pertussis, diphtheria, influenza as well as an HIV mega-laboratory, a multiplex testing laboratory, and the National Bio-repository Center (NBC), which is accredited and currently stores over one million samples from various national public health studies. These units also support genome sequencing, advanced diagnostics, research, and training. Samples are sent from all States across Nigeria for confirmation of a disease outbreak of public health importance. The NRL’s capacity is evidenced by its role during the COVID-19 pandemic, when it contributed significantly to the nationwide response, and by the extensive repository of specimens it maintains for surveillance and diagnostic purposes.
Study design, population and sampling
All laboratory personnel who work at the National Reference Laboratory of the NCDC and consented were included in this study. Management staff and other staff without direct contact with biological waste were excluded. A descriptive cross-sectional study design was used to assess knowledge, attitude, and practice. For knowledge, attitude and practice assessment, the total number of participants for this study (n) was 80 out of a total of 105 staff, including technical laboratory workers, sample transporters, cleaners, and data clerks.
Study instrument and data collection
A survey was conducted using a self-administered semi-structured electronic questionnaire. The questionnaire was developed by the researchers using organisational SOP for biosafety and waste management, then validated and approved by the biosafety and waste management team, the Institutional Review Board, and the Laboratory Head/Manager before data collection. An electronic questionnaire was distributed to consenting respondents, and data were collected pertaining to knowledge, attitude and practices, after pretesting with strong validity and reliability (Cronbach alpha = 0.751). Data collection duration was from January to March 2025.
Data analysis
This study utilised the quantitative analysis method. Data analysis was carried out using the R programming language. All categorical or nominal variables were summarised using frequency and percentages, while overall summations will be represented using pie charts and bar charts. The independent variables were the socio-demographic variables, while the dependent variables were the knowledge, attitude and practice. The criteria used to classify the respondents
A threshold of 70% of the total score was set to measure the following outcomes: good knowledge, positive attitude and good practice. A score of 1 was assigned to any correct response, while any wrong responses were scored 0 in the knowledge and practice section; the Likert scale was used to score the attitude section. The total possible scores in the knowledge section were 10, attitude was 50, and practice was 10. Associations between socio-demographic variables and knowledge, attitude, and practice outcomes were examined using bivariate analyses (chi-square test or Fisher’s exact test, as appropriate) using a p-value < 0.05 for statistical significance. Given the small number of outcome events in some categories, particularly for negative attitude and poor practice, a stable multivariable regression model could not be fitted. Therefore, the analysis was limited to bivariate associations.
Ethical considerations
Ethical clearance was obtained from the Federal Capital Territory Health Research Ethics Committee (FHREC/2024/01/259/24-10-24). Written permission was granted by the management of the NCDC, National Reference Laboratory, for this study to be conducted in their facility, as well as obtaining written informed consent from all participants. Privacy was upheld by allowing them to complete a self-administered electronic questionnaire and retain control over the information they provided. To ensure anonymity, participants were not required to include their names on the questionnaire. Confidentiality was maintained by securely storing all data in a locked location. Participants were also informed of their right to freely participate or withdraw from the study at any time before signing the consent forms.
Socio-demographic characteristics of the respondents
The study involved 80 participants working at the National Reference Laboratory, NCDC, Abuja. The majority were male (60%) and within the 26–35 years’ age range (46%). The job roles were laboratory scientists (44%), technicians (11%), and researchers (10%). The majority of them held advanced educational qualifications, with 40% possessing a Master’s degree and 38% a Bachelor’s degree. Almost half (46%) had 1–5 years of work experience (Table 1).
Knowledge of biosafety and waste management
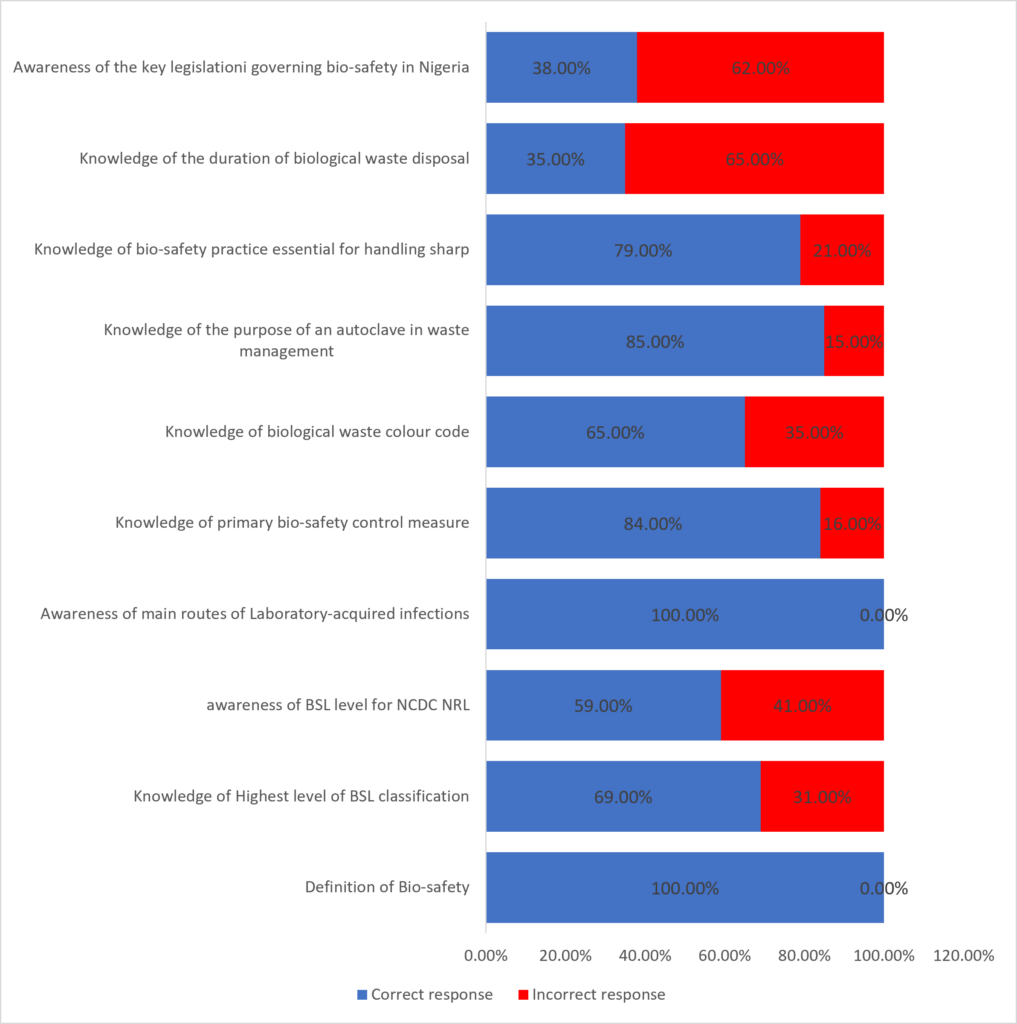
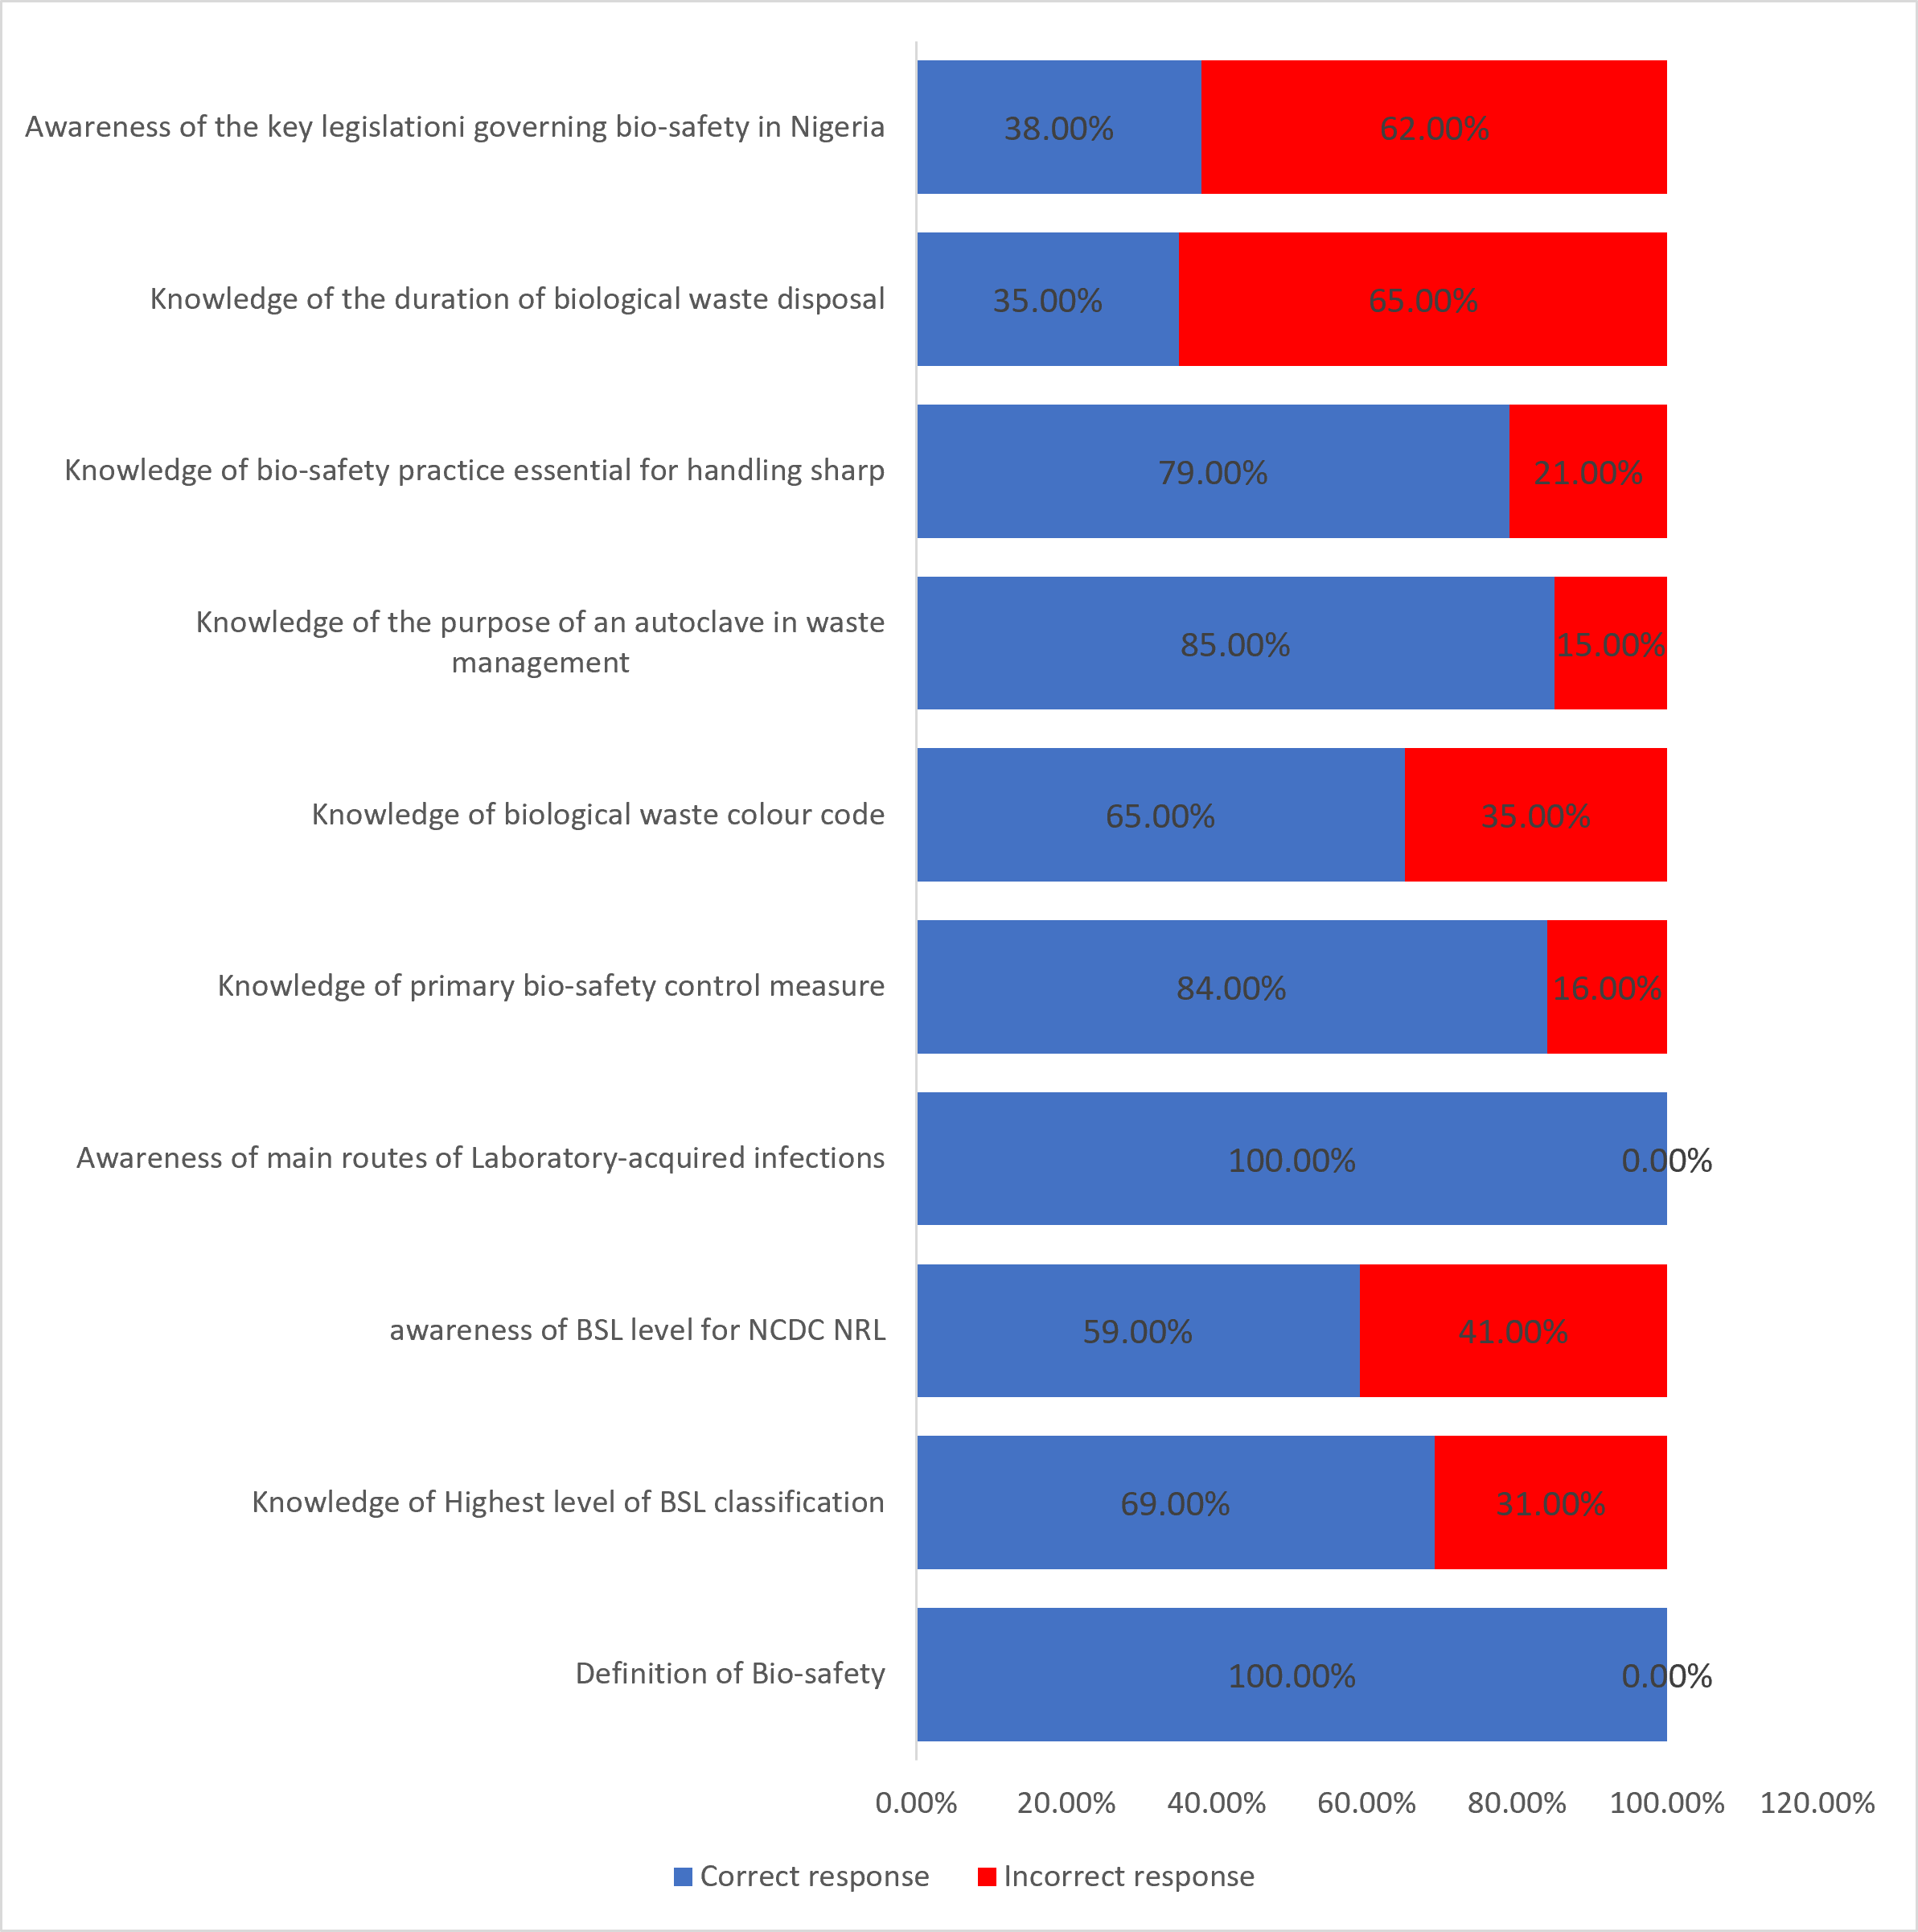
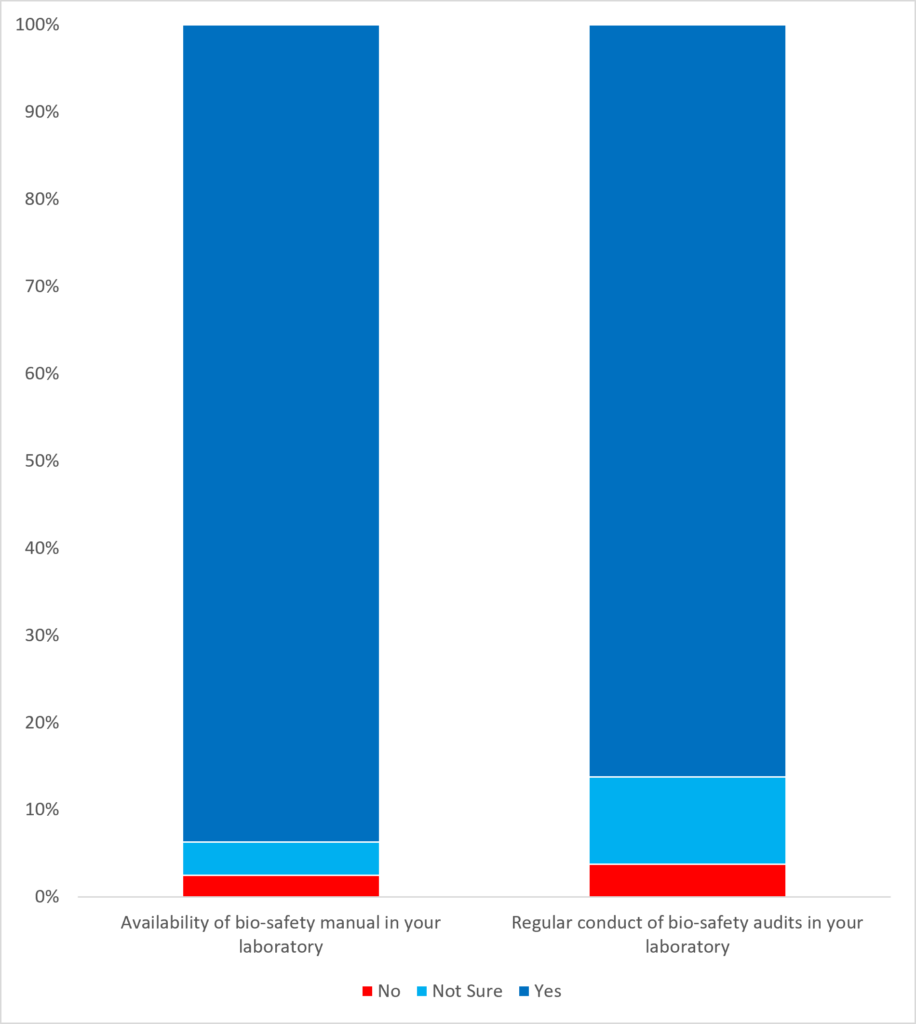
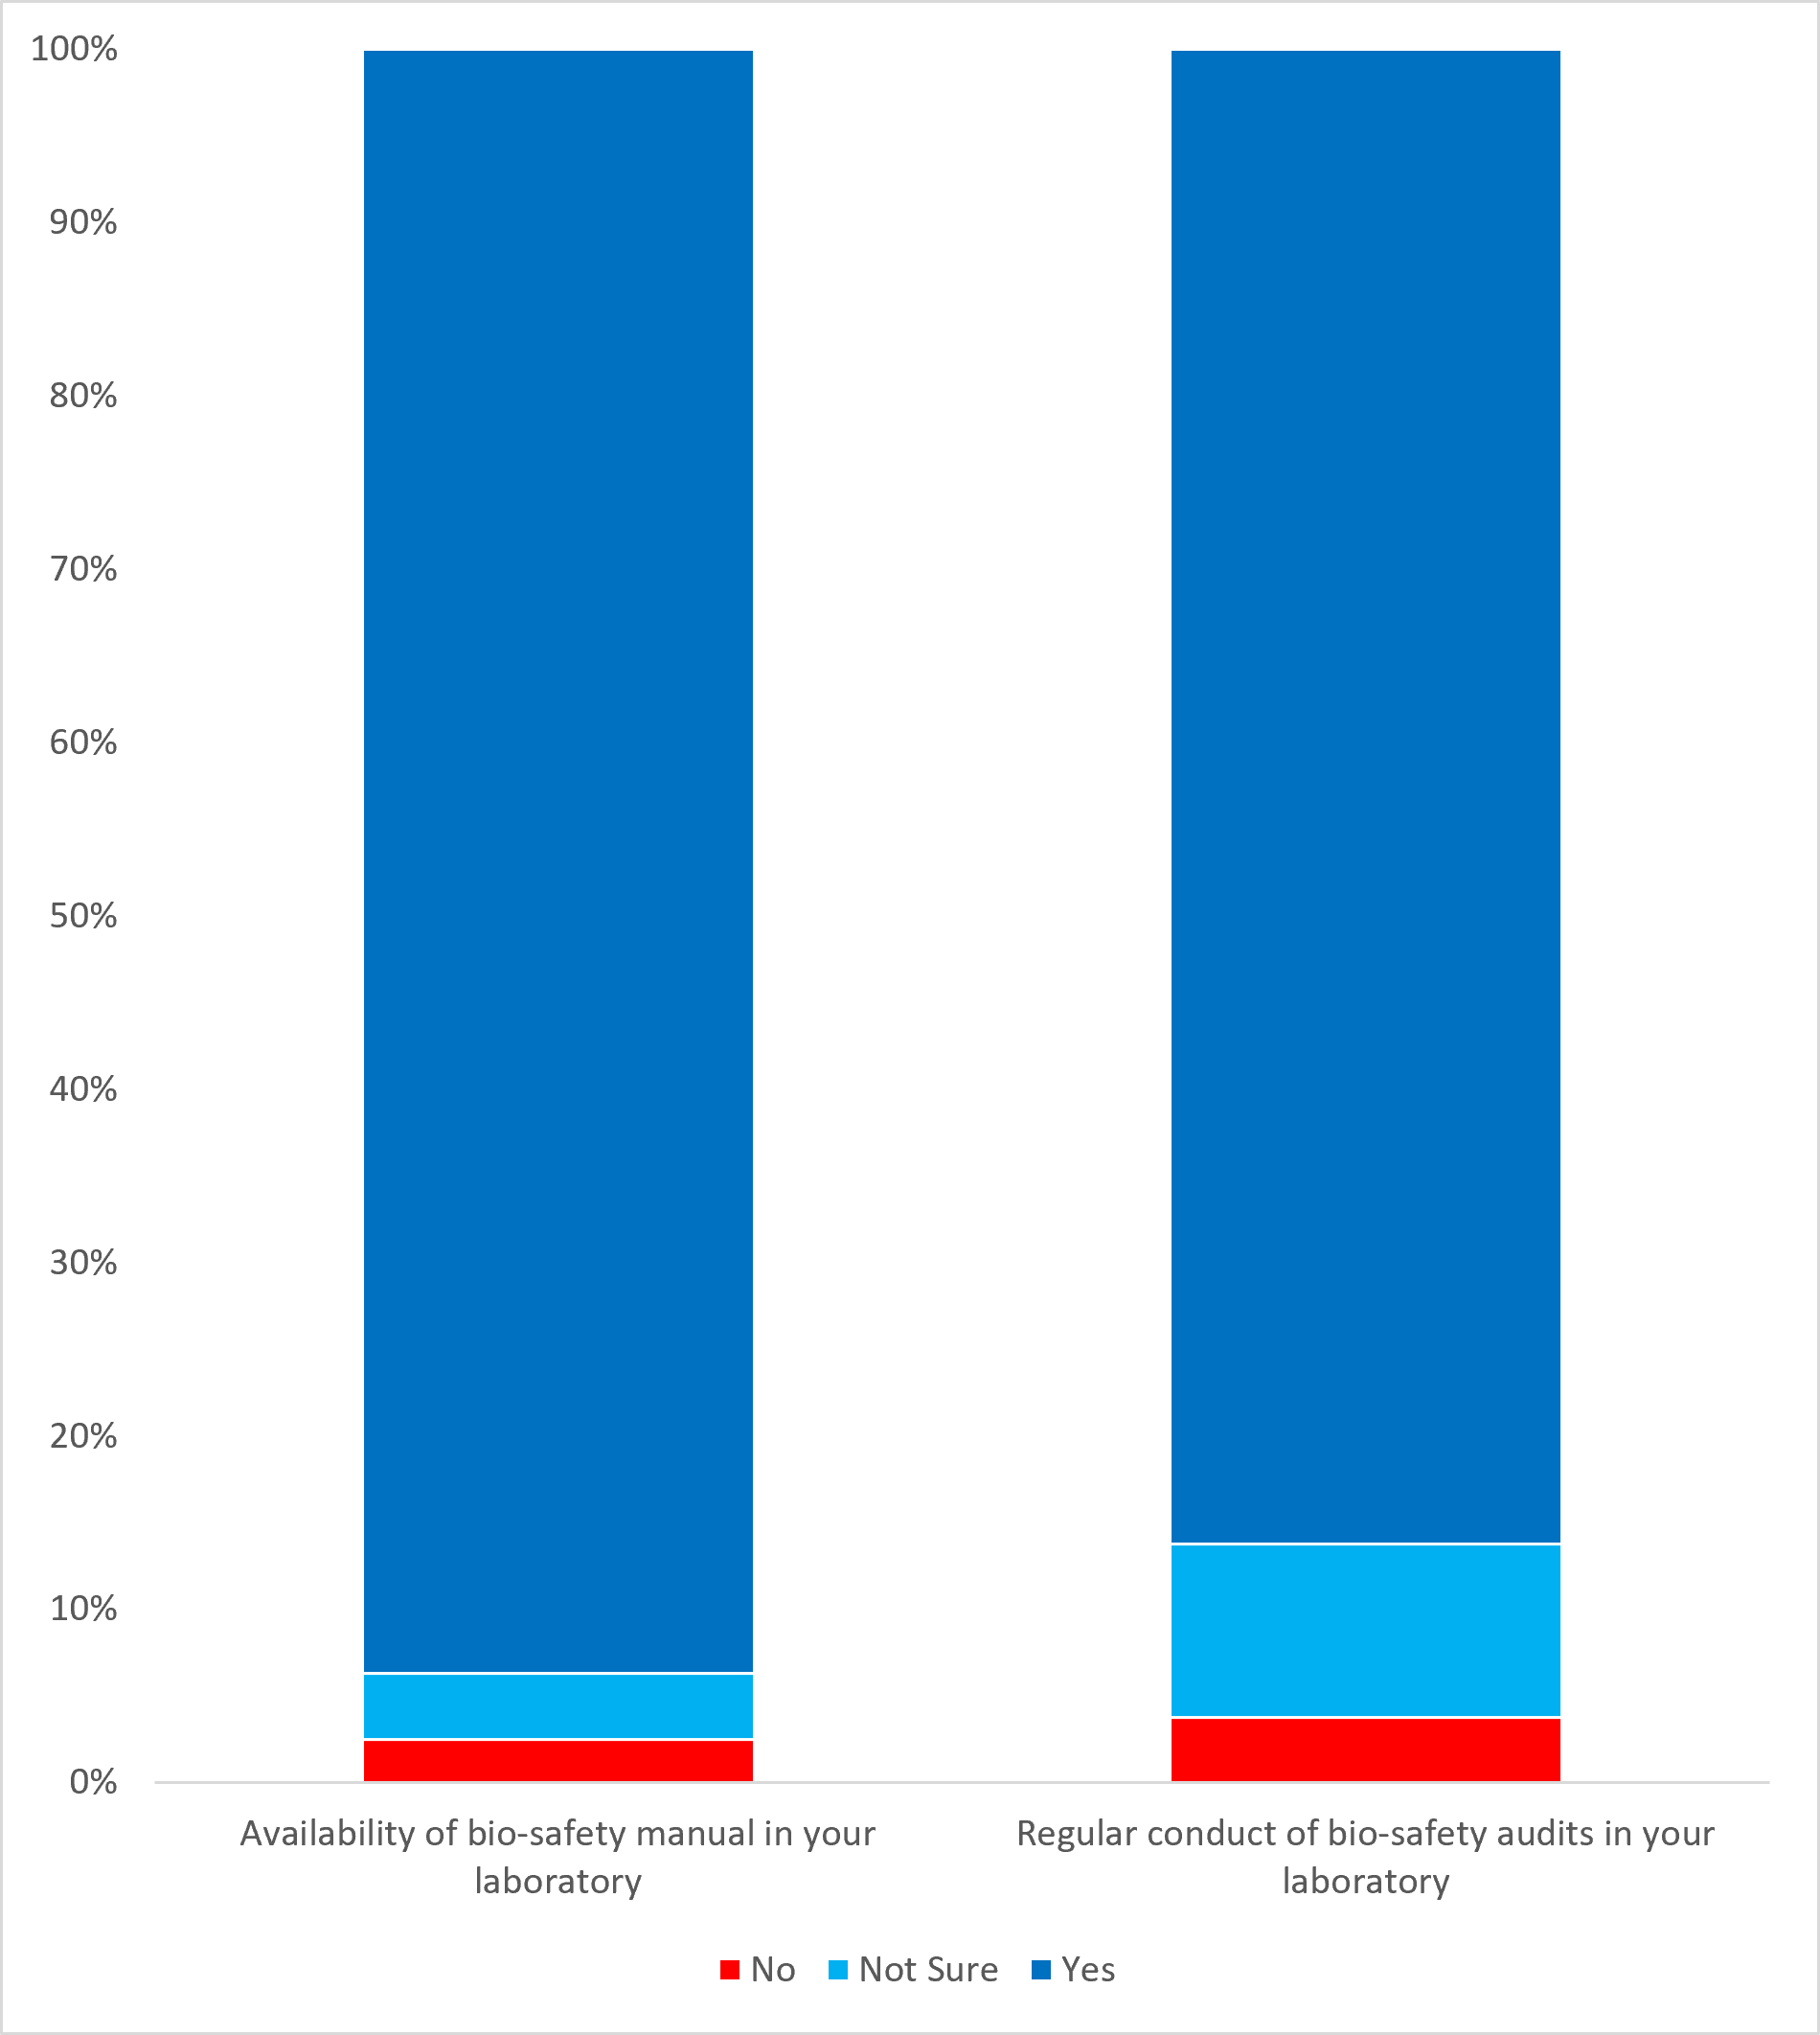
Knowledge levels among participants were generally high. Most participants (76%) correctly defined biosafety as the combination of safety measures, and 69% identified BSL-4 as the highest biosafety classification. While 59% of laboratories operated at BSL-2, a noteworthy 21% functioned at BSL-3 (Figure 1).
Participants showed good understanding of laboratory-acquired infection routes (88%), biological waste colour coding (65% correctly identified red), and autoclaving as a sterilisation method (85%). However, only 38% could correctly cite the Bio-safety Act 2015 as the key legislative instrument in Nigeria.
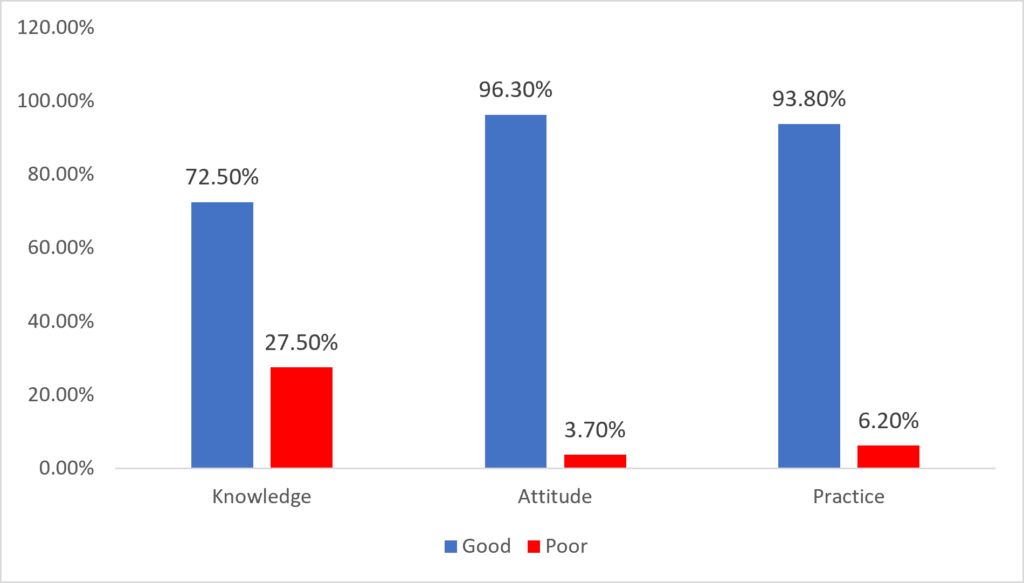
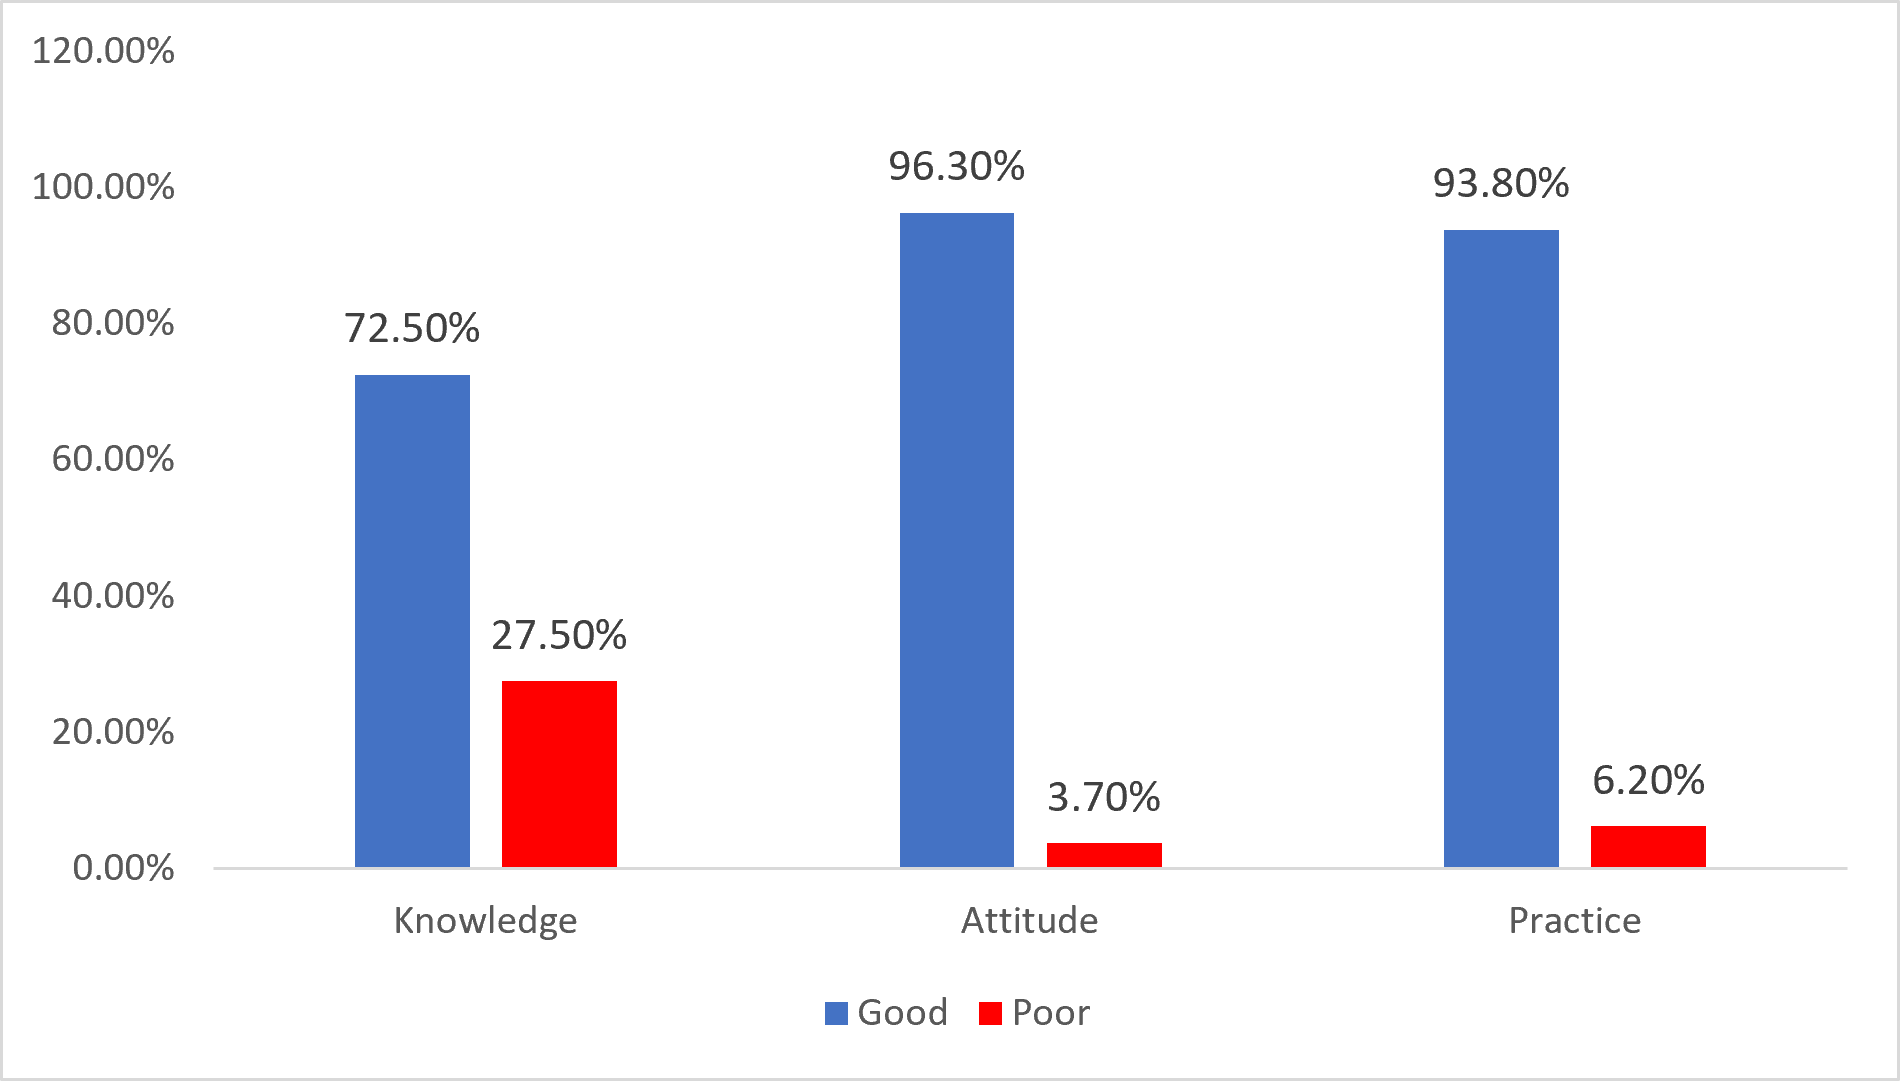
Using a predefined cut-off score of ≥70% of the total score for good knowledge, 58 respondents (72.5%) were classified as having good knowledge, while 22 (27.5%) demonstrated poor knowledge (Figure 2).
Attitudes toward biosafety
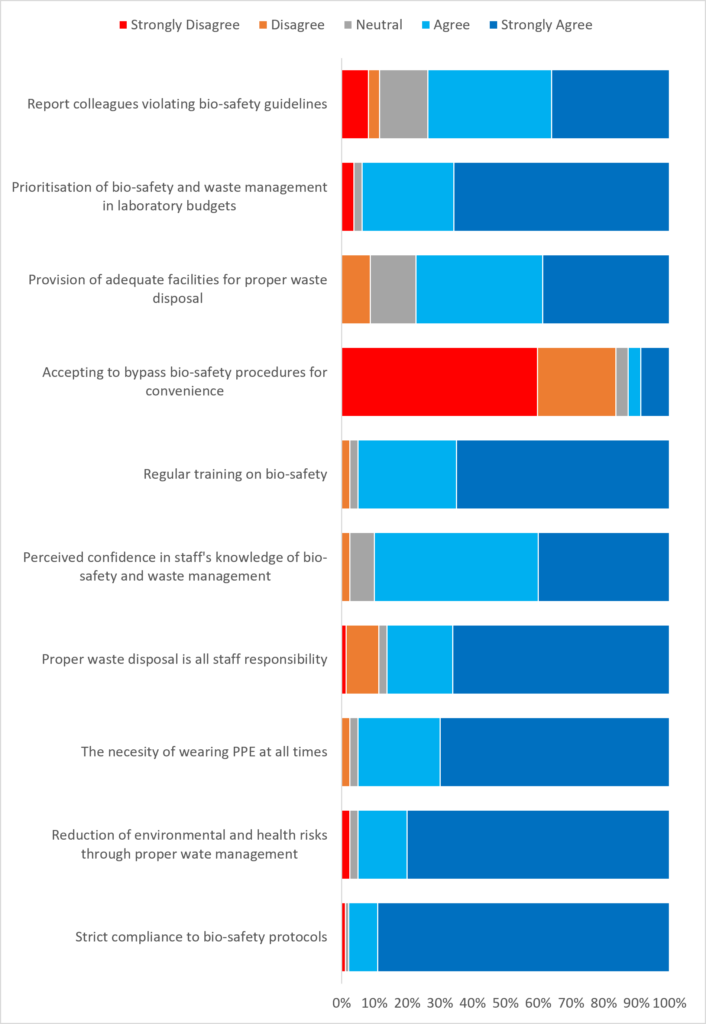
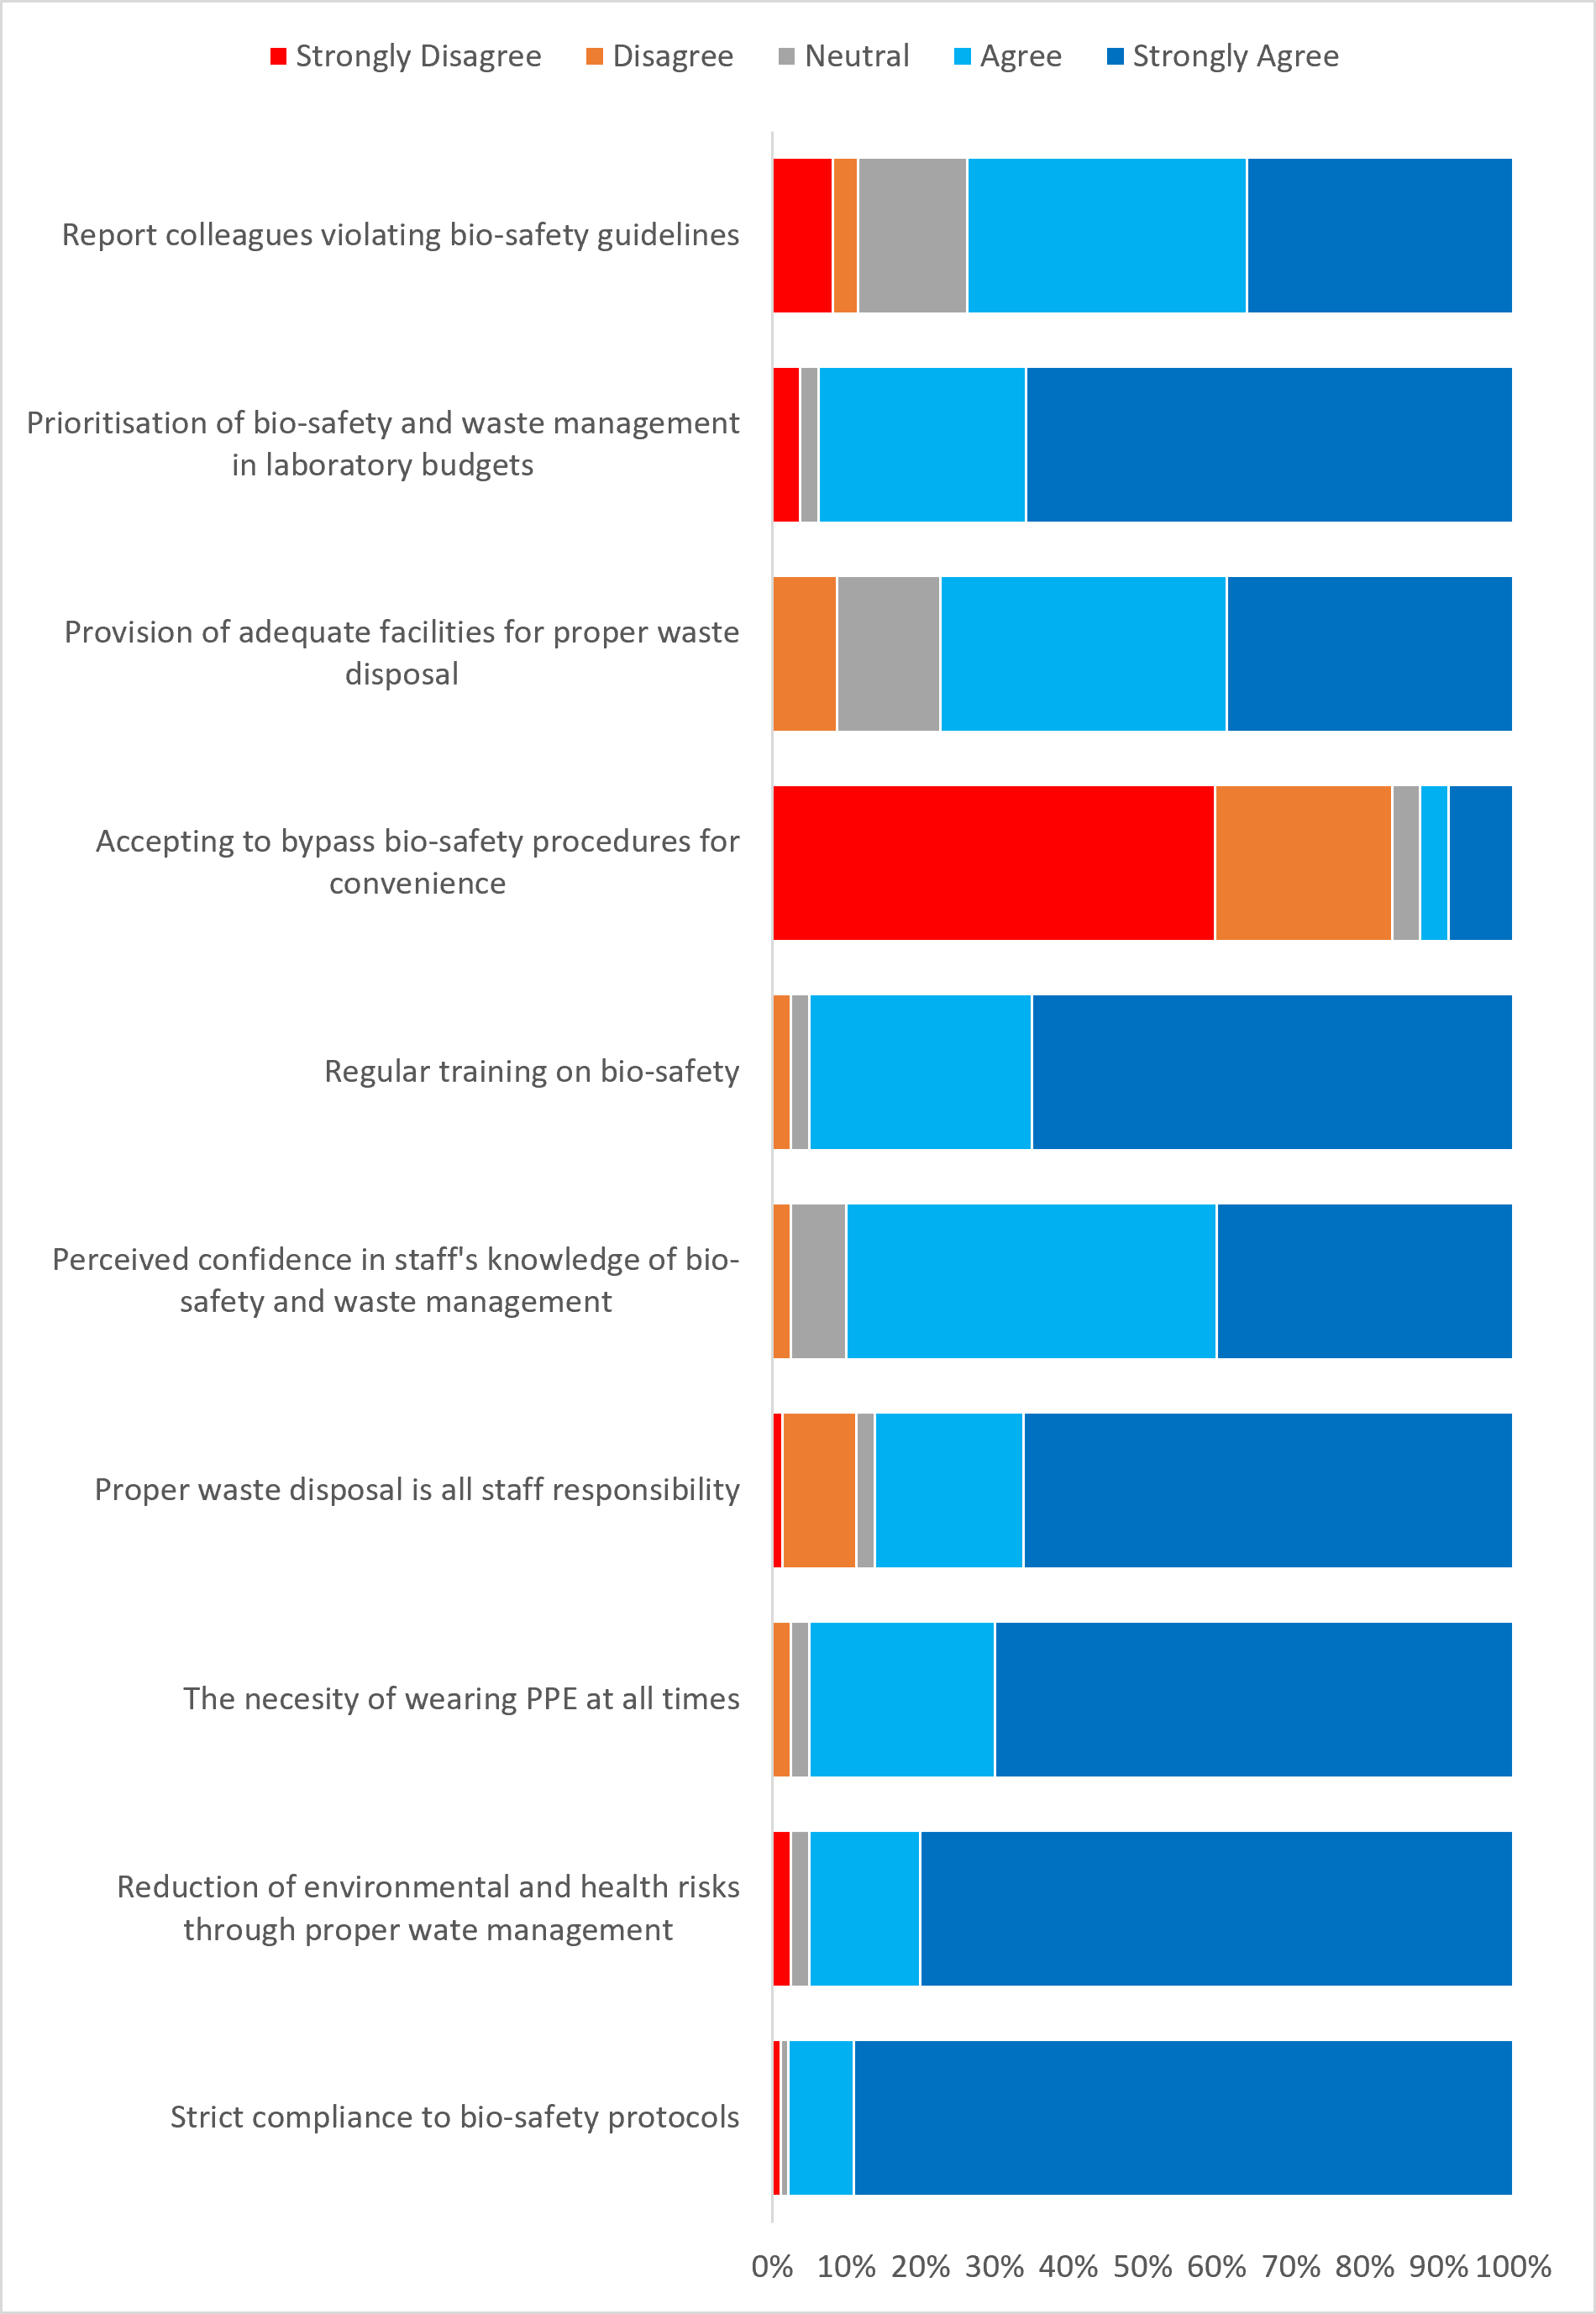
Respondents exhibited a predominantly positive attitude: 89% strongly agreed that biosafety protocols should be strictly followed; 80% strongly agreed that waste management reduces health and environmental risks; 70% strongly agreed on the importance of wearing PPE at all times; 96.3% overall demonstrated a good attitude, with only 3.8% scoring poorly; Interestingly, 3.8% believed it was acceptable to bypass bio-safety procedures occasionally, highlighting a small gap in safety culture (Figures 3 and 4)
Overall attitude towards biosafety and infectious waste management among respondents was generally high. Attitude and items were assessed using Likert-scale responses. For attitude items, responses reflecting favourable biosafety orientation e.g., “agree” or “strongly agree”, were assigned higher scores of 4 and 5, respectively, while unfavourable responses were assigned lower scores. Using a predefined cut-off score of ≥70% of the total score for positive attitude, 77 respondents (96.3%) demonstrated a positive attitude toward biosafety and infectious waste management, while 3 respondents (3.8%) exhibited a negative attitude.
Biosafety and waste management practices
The majority of respondents (94%) consistently wore PPE when handling biological materials. Waste disposal practices varied, with 39% using incineration and 36% combining autoclaving with disposal. Hand hygiene compliance was strong (90%), and 80% reported proper labelling and segregation of biological waste. Only 26% attended bio-safety training annually, while 10% had never attended. When bio-safety incidents occurred, 59% acted immediately using disinfectants. Regular equipment inspection was common, with 60% reporting monthly maintenance. Overall, 93.8% of participants exhibited good practices, with 6.2% demonstrating poor adherence (Figure 2). Practice items were scored based on adherence to recommended biosafety and waste management behaviours, with higher scores indicating better compliance. Applying the ≥70% threshold, 75 respondents (93.8%) were classified as having good biosafety and waste management practices, while 5 (6.2%) demonstrated poor practices.
Associations between sociodemographic variables and knowledge, attitude and practices
Knowledge was significantly associated with initial biosafety training (p = 0.006). No significant association was found with gender, age, education or work experience (Table 2). Attitude was significantly associated with education (p < 0.001), job role (p = 0.049), and bio-safety audit (p =0.021, Table 3). Laboratories that conducted regular bio-safety audits showed stronger positive attitudes (p = 0.021). Practice is significantly associated with job role (p=0.041, Table 4).
The present study assessed the NCDC-NRL, Abuja staff’s knowledge, attitudes, and practices regarding bio-safety and waste management. Results showed that respondents overall depicted good knowledge, positive attitudes, and acceptable bio-safety practices. These results demonstrate a high level of consciousness and adherence among NRL workers, a testament to the laboratory’s established bio-safety infrastructure as well as its status as Nigeria’s highest public health referral facility.
The socio-demographic breakdown of the respondents identified that the majority were male respondents aged 26–35 years, with most of them being laboratory scientists and technicians with Bachelor’s and Master’s degree qualifications. This is in alignment with similar studies in health institutions across Nigeria and sub-Saharan Africa, where younger, better-educated technical practitioners constituted the larger share of respondents to bio-safety-related questions [2]. The finding that level of education also strongly correlated with attitude further confirms the importance of academic qualification as a predictor of safety awareness and consciousness, as previously found in Nigeria and Uganda [9].
The research established that the majority of participants identified bio-safety classifications, means of laboratory-acquired infections (LAIs), and proper methods of sterilization accurately, demonstrating a sound grasp of primary bio-safety principles. This finding is consistent with a study in Ondo and Osun States, Nigeria, and Uganda, which showed that the awareness level of healthcare workers regarding the risk associated with poor infection control and waste management was high [10] [11]. Similarly, Siimane and Nts’ihlele [2] stated that the laboratory personnel mostly had good knowledge about the handling of infectious waste and sharps disposal, with the increasing significance of safety training in laboratory networks across Africa.
However, the relatively low rate (38%) of respondents that was capable of specifying the National Bio-safety Management Agency Act (2015) as policymaking legislation in Nigeria indicates a gap at the policy level. This outcome is in congruence with the findings of Uloma et al. [1], which showed that while operational knowledge is predominantly high among healthcare staff, regulatory awareness remains low. Such a lacuna suggests that while procedural compliance is enhanced through the practice mode of training, particular tutorial interventions on bio-safety policy and national regulatory regimes are no less required.
The study also revealed that early bio-safety training significantly influenced respondents’ knowledge levels (p = 0.006). This finding aligns with Munson et al. [7] and Brizee et al. [3], who reaffirmed that continuous capacity-building exercises improve laboratory personnel capability, reduce occupational risk, and encourage a long-lasting safety culture. Contrarily, only 26% of the interviewees took annual bio-safety training, with an additional 10% that never did, indicating a shocking lack of continuous professional education. This same issue was recorded in Enugu and Ilorin research [12] [13], where sporadic refresher training was associated with safety compliance failures and weak compliance during laboratory audits.
The extremely positive behaviour found here parallels accounts of other Nigerian and East African research in which health workers acknowledged the importance of PPE use, waste segregation, and infection prevention [9] [14] [11]. Nearly all the respondents (96.3%) agreed that bio-safety precautions should always be followed, which shows NRL’s institutional safety culture is well established. But the 3.8% of respondents who believed that bending around bio-safety procedures occasionally was acceptable indicates a highly subtle but critical attitude gap. The same findings were observed in Tanzania and Ethiopia, where some laboratory staff demonstrated complacency despite being aware of safety ideals [15] [16]. These articles collectively refer to the ongoing issue of translating knowledge to consistent, unshakeable practice.
In regard to bio-safety practices, the majority of the NRL staff demonstrated good compliance in terms of PPE, hand hygiene, and waste segregation. This is in agreement with the results of Okechukwu et al. [9] and Mehta et al. [14], who observed that health professionals in tertiary hospitals adhered to policies in managing waste and infection prevention. Application of autoclaving and incineration as the preferred treatments for waste in this study aligns with WHO standards [6] and also with other research conducted in Osun and Uganda, which referenced these practices as the most effective ways of eliminating infectious waste [10] [17].
Interestingly, training, job designation, and qualification were associated with knowledge and attitude, but no correlation was found between knowledge and practice in this study. This suggests that organizational systems of compliance enforcement are more significant than personal traits. Uloma et al. [1] and Okechukwu et al. [9] similarly indicated that institutional-level determinants of organised laboratory structures, SOPs, and supervisory oversight are more salient than individual characteristics in terms of influencing behavioural compliance.
Low levels of knowledge in national legislation and low levels of participation in recurrent bio-safety training have strong implications for the sustainability of its laboratory safety program. As noted in comparable studies[12], performance-based certification, regular audits, and frequent in-service training are critical to institutionalise compliance and safety culture. Incorporating simulation training and legislative training into existing capacity-building programs may also enhance laboratory staff readiness against new and emerging infectious disease risks.
Limitations
There are some limitations of the study that need to be taken into consideration while interpreting the results. First, due to its cross-sectional study design, it is difficult to assess causal relationships between knowledge, attitude, and practices. Secondly, results could be prone to biases due to self-reported responses. There are possibilities that the results might be influenced by biases of social desirability. In addition, the study was carried out at only the NRL; it can be assumed that results can be less applicable at smaller laboratories. Lastly, due to the use of structured interview questionnaires, there can be possibilities that precise biosafety practices might not be obtained due to measurement biases, and cofounders could not be checked with regression analysis due to the small counts in the outcome variables.
This self-reporting survey assessed knowledge, attitude, and practices for bio-safety and waste management among personnel at the Nigeria Centre for Disease Control (NCDC) National Reference Laboratory (NRL), Abuja. The findings show that the NRL staff have a high level of knowledge, appropriate attitudes, and good bio-safety practices, illustrating a culture of safety at one of Nigeria’s foremost public health laboratories. Overall, 72.5% of the participants had good knowledge, 96.3% had favourable attitudes, and 93.8% demonstrated good bio-safety practice.
The study is important in that education and training on bio-safety are prime movers of knowledge and attitude, implying that formal education and structured capacity-building programs have a direct bearing on laboratory personnel perceiving and following bio-safety protocols. Especially, interviewees who were first trained in bio-safety were most likely to possess good knowledge, and higher educational qualifications, particularly at the PhD level, were linked with a positive attitude. The relationship between the role within a job and good bio-safety practice also emphasises that practical lab personnel are the most critical custodians of bio-safety culture and operational compliance.
Despite the overall positive outcomes, there are some loopholes. Less than half of the participants could name the National Bio-Safety Management Agency Act 2015 as Nigeria’s bio-safety legislation tool, and only a quarter underwent yearly bio-safety training. Moreover, some classes believed that ignoring bio-safety protocols occasionally was acceptable, a sign that they need more emphasis on safety culture and ethical responsibility in laboratory environments. A key finding of this study was the absence of statistically significant associations between knowledge, attitude, and practice. While counterintuitive, this finding offers important insight into biosafety behavior within highly regulated laboratory environments. It suggests that good biosafety practice may be driven less by individual knowledge or attitudes and more by institutional enforcement mechanisms, such as standard operating procedures, infrastructural controls, supervision, and mandatory compliance systems. In such settings, practice may be relatively uniform across staff regardless of personal characteristics, thereby attenuating observable associations between knowledge, attitude and practice domains.
The study’s findings have significant implications for the sustenance of national bio-safety standards. Institutionalizing regular and compulsory bio-safety training, continuous professional development, and policy awareness programs would serve to sustain and reinforce the safety culture. Simulation exercises, refresher training, and periodic audits could ensure more rigorous compliance with infection prevention and waste management practices.
In summary, the NCDC National Reference Laboratory has a high bio-safety knowledge, attitude, and practice level, reflecting its role at the hub of the public health surveillance and response system in Nigeria. However, its sustainability is hinged on continuous training, legislative awareness, and leadership commitment to ensure the culture of bio-safety excellence. This not only protects laboratory personnel and the environment but also strengthens Nigeria’s capability to manage biological risks and respond well to emerging new public health threats.
What is already known about the topic
What this study adds
IN (Conceptualization, Project administration, Supervision, Writing – review & editing)
OEF (Data curation, Formal analysis, Visualization)
PND (Writing – original draft, Writing – review & editing)
ESB (Writing – original draft)
AJE (Investigation, Project administration, Supervision, Validation)
OAB (Project administration, Resources; Supervision, Validation)
JCA (Conceptualization, Project administration, Resources, Supervision, Validation)
OI (Project administration, Resources, Supervision, Validation)
MSM (Methodology, Writing – original draft)
AJE (Validation)
CEI (Investigation)
CCK (Investigation)
ORN (Validation)
NLU (Investigation)
CEO (Investigation)
NPA (Investigation)
OUD (Methodology; Supervision; Validation)
| Table 1: Socio-demographic characteristics of the respondents | ||
|---|---|---|
| Socio-demographic characteristics | n | % |
| Gender | ||
| Female | 32 | 40.0 |
| Male | 48 | 60.0 |
| Age (years) | ||
| 18 – 25 | 8 | 10.0 |
| 26 – 35 | 37 | 46.0 |
| 36 – 45 | 31 | 39.0 |
| 46 and above | 4 | 5.0 |
| Education Level | ||
| Ordinary level certificate | 5 | 6.3 |
| Diploma (Diploma, National Diploma and HND) | 10 | 12.5 |
| Bachelor’s Degree | 30 | 37.5 |
| Master’s Degree | 32 | 40.0 |
| PhD | 3 | 3.7 |
| Years of Work Experience | ||
| <1 year | 7 | 8.8 |
| 1 – 5 years | 37 | 46.2 |
| 6 – 10 years | 22 | 27.5 |
| >10 years | 14 | 17.5 |
| Table 2: Bivariate analysis between sociodemographic characteristic vs knowledge | ||||
|---|---|---|---|---|
| Characteristic | Good knowledge N = 58 (%) | Poor knowledge N = 22 (%) | Chi-square | p-value |
| Gender | ||||
| Female | 24 (41.0) | 8 (36.0) | 0.167 | 0.9 |
| Male | 34 (59.0) | 14 (64.0) | ||
| Age group | ||||
| 18 – 25 | 4 (6.9) | 4 (18.0) | 3.597 | 0.3 |
| 26 – 35 | 27 (47.1) | 10 (45.0) | ||
| 36 – 45 | 23 (40.1) | 8 (36.0) | ||
| 46 and above | 4 (6.9) | 0 (0) | ||
| Education Level | ||||
| O level | 1 (1.7) | 4 (18.2) | 9.237 | 0.055 |
| Diploma (Diploma, National Diploma and HND) | 6 (10.3) | 4 (18.2) | ||
| Bachelor’s Degree | 23 (39.7) | 7 (31.8) | ||
| Master’s Degree | 26 (44.8) | 6 (27.3) | ||
| PhD | 2 (3.4) | 1 (4.5) | ||
| Years of Work Experience | ||||
| <1 year | 4 (6.9) | 3 (14.0) | 7.098 | 0.069 |
| >10 years | 14 (24.1) | 0 (0.0) | ||
| 1 – 5 years | 26 (45.0) | 11 (50.0) | ||
| 6 – 10 years | 14 (24.0) | 8 (36.0) | ||
| Job Role | ||||
| Admin | 1 (1.7) | 0 (0.0) | 8.832 | 0.183 |
| Biomedical engineers | 3 (5.2) | 1 (4.5) | ||
| Data officer | 0 (0.0) | 1 (4.5) | ||
| Facility Managers | 7 (12.1) | 2 (9.0) | ||
| Interns | 5 (8.6) | 2 (9.0) | ||
| Laboratory scientists | 39 (67.2) | 11 (50.0) | ||
| Waste managers | 3 (5.2) | 5 (23.0) | ||
| Have you received an initial orientation training on bio-safety and waste management? | ||||
| No | 1 (1.7) | 5 (22.7) | 10.142 | 0.006* |
| yes | 57 (98.3) | 17 (77.3) | ||
| If yes, when was your last training? | ||||
| <1 year | 28 (48.0) | 11 (50.0) | 1.107 | 0.6 |
| >3 years ago | 4 (6.9) | 3 (14.0) | ||
| 1 – 3 years ago | 26 (45.1) | 8 (36.0) | ||
| How often do you handle biological materials? | ||||
| Daily | 44 (76.0) | 16 (73.0) | 3.308 | 0.347 |
| Monthly | 2 (3.4) | 3 (14.0) | ||
| Rarely | 6 (10.3) | 2 (9.1) | ||
| Weekly | 6 (10.3) | 1 (4.5) | ||
| Does your laboratory have a bio-safety manual? | ||||
| No | 1 (1.7) | 1 (4.5) | 2.993 | 0.224 |
| Not sure | 1 (1.7) | 2 (9.1) | ||
| Yes | 56 (97.0) | 19 (86.0) | ||
| Does your laboratory conduct bio-safety audits? | ||||
| No | 3 (5.2) | 0 (0.0) | 2.339 | 0.311 |
| Not sure | 7 (12.0) | 1 (4.5) | ||
| Yes | 48 (83.0) | 21 (95.0) | ||
| Table 3: Bivariate analysis between sociodemographic characteristics and attitude of biosafety and Waste Management among staff of NCDC National Reference Laboratory, Abuja, Nigeria | ||||
|---|---|---|---|---|
| Characteristic | Positive N = 77 (%) | Negative N = 3 (%) | Chi-square | p-value |
| Gender | ||||
| Female | 32 (42.0) | 0 (0.0) | 2.078 | 0.149 |
| Male | 45 (58.0) | 3 (100.0) | ||
| Age | ||||
| 18 – 25 | 8 (10.0) | 0 (0.0) | 3.622 | 0.305 |
| 26 – 35 | 34 (44.0) | 3 (100) | ||
| 36 – 45 | 31 (40.0) | 0 (0.0) | ||
| 46 and above | 4 (5.2) | 0 (0.0) | ||
| Education Level | ||||
| O level | 5 (6.5) | 0 (0.0) | 21.188 | <0.001* |
| Diploma (Diploma, National Diploma and HND) | 7 (9.1) | 3 (100) | ||
| Bachelor’s Degree | 30 (39.0) | 0 (0.0) | ||
| Master’s Degree | 32 (42.0) | 0 (0.0) | ||
| PhD | 3 (3.9) | 0 (0.0) | ||
| Years of Work Experience | ||||
| <1 year | 7 (9.1) | 0 (0.0) | 3.622 | 0.305 |
| >10 years | 14 (18.0) | 0 (0.0) | ||
| 1 – 5 years | 34 (44.0) | 3 (100.0) | ||
| 6 – 10 years | 22 (29.0) | 0 (0.0) | ||
| Job Role | ||||
| Admin | 1 (1.3) | 0 (0.0) | 12.660 | 0.049* |
| Biomedical engineers | 4 (5.2) | 0 (0.0) | ||
| Data officer | 1 (1.3) | 0 (0.0) | ||
| Facility Managers | 7 (9.1) | 2 (67.0) | ||
| Interns | 7 (9.1) | 0 (0.0) | ||
| Laboratory scientists | 50 (65.0) | 0 (0.0) | ||
| Waste managers | 7 (9.1) | 1 (33.0) | ||
| Have you received an initial orientation training on biosafety and waste management? | ||||
| No | 5 (6.5) | 1 (33.0) | 2.998 | 0.083 |
| yes | 72 (93.5) | 2 (67.0) | ||
| If yes, when was your last training? | ||||
| <1 year | 37 (48.0) | 2 (67.0) | 0.540 | 0.764 |
| >3 years ago | 7 (9.0) | 0 (0.0) | ||
| 1 – 3 years ago | 33 (43.0) | 1 (33.0) | ||
| How often do you handle biological materials? | ||||
| Daily | 58 (75.0) | 2 (67.0) | 4.271 | 0.234 |
| Monthly | 4 (5.2) | 1 (33.0) | ||
| Rarely | 8 (10.0) | 0 (0.0) | ||
| Weekly | 7 (9.1) | 0 (0.0) | ||
| Does your laboratory have a biosafety manual? | ||||
| No | 2 (2.6) | 0 (0.0) | 0.208 | 0.901 |
| Not sure | 3 (3.9) | 0 (0.0) | ||
| Yes | 72 (93.5) | 3 (100.0) | ||
| Does your laboratory conduct biosafety audits? | ||||
| No | 2 (2.6) | 1 (33.0) | 7.724 | 0.021* |
| Not sure | 8 (10.3) | 0 (0.0) | ||
| Yes | 67 (87.0) | 2 (67.0) | ||
| *-Significant at p-value < 0.05 | ||||
| Table 4: Bivariate analysis between sociodemographic characteristics and practice of biosafety and Waste Management among staff of NCDC National Reference Laboratory, Abuja, Nigeria | ||||
|---|---|---|---|---|
| Characteristic | Good N = 75 (%) | Poor N = 5 (%) | Chi-square | p-value |
| Gender | ||||
| Female | 29 (39.0) | 3 (60.0) | 0.889 | 0.346 |
| Male | 46 (61.0) | 2 (40.0) | ||
| Age | ||||
| 18 – 25 | 8 (11.0) | 0 (0.0) | 1.020 | 0.796 |
| 26 – 35 | 34 (45.0) | 3 (60.0) | ||
| 36 – 45 | 29 (39.0) | 2 (40.0) | ||
| 46 and above | 4 (5.3) | 0 (0.0) | ||
| Education Level | ||||
| O level | 5 (6.7) | 0 (0.0) | 2.027 | 0.731 |
| Diploma (Diploma, National Diploma and HND) | 9 (12.0) | 1 (20.0) | ||
| Bachelor’s Degree | 27 (36.0) | 3 (60.0) | ||
| Master’s Degree | 31 (41.0) | 1 (20.0) | ||
| PhD | 3 (4.0) | 0 (0.0) | ||
| Years of Work Experience | ||||
| <1 year | 7 (9.3) | 0 (0.0) | 0.813 | 0.846 |
| >10 years | 13 (17.0) | 1 (20.0) | ||
| 1 – 5 years | 34 (45.0) | 3 (60.0) | ||
| 6 – 10 years | 21 (28.0) | 1 (20.0) | ||
| Job Role | ||||
| Admin | 1 (1.3) | 0 (0.0) | 13.099 | 0.041* |
| Biomedical engineers | 4 (5.3) | 0 (0.0) | ||
| Data officer | 1 (1.3) | 0 (0.0) | ||
| Facility Managers | 6 (8.0) | 3 (60.0) | ||
| Interns | 7 (9.3) | 0 (0.0) | ||
| Laboratory scientists | 48 (64.0) | 2 (40.0) | ||
| Waste managers | 8 (11.0) | 0 (0.0) | ||
| Have you received an initial orientation training on biosafety and waste management? | ||||
| No | 5 (6.7) | 1 (20.0) | 1.201 | 0.330 |
| yes | 70 (93.3) | 4 (80.0) | ||
| If yes, when was your last training? | ||||
| <1 year | 37 (49.0) | 2 (40.0) | 0.935 | 0.627 |
| >3 years ago | 7 (9.3) | 0 (0.0) | ||
| 1 – 3 years ago | 31 (41.0) | 3 (60.0) | ||
| How often do you handle biological materials? | ||||
| Daily | 56 (75.0) | 4 (80.0) | 2.631 | 0.452 |
| Monthly | 4 (5.3) | 1 (20.0) | ||
| Rarely | 8 (11.0) | 0 (0.0) | ||
| Weekly | 7 (9.3) | 0 (0.0) | ||
| Does your laboratory have a biosafety manual? | ||||
| No | 2 (2.7) | 0 (0.0) | 0.356 | 0.837 |
| Not sure | 3 (4.0) | 0 (0.0) | ||
| Yes | 70 (93.3) | 5 (100.0) | ||
| Does your laboratory conduct biosafety audits? | ||||
| No | 2 (2.7) | 1 (20.0) | 4.313 | 0.116 |
| Not sure | 8 (11.3) | 0 (0.0) | ||
| Yes | 65 (87.0) | 4 (80.0) | ||
| *-Significant at p-value < 0.05 | ||||