
Research | Open Access | Volume 9 (Suppl 12): Article 14 | Published: 28 Aug 2026

Views: 1,323
Menu, Tables and Figures
| State | Rainfall (mm) | NDVI | LST (°C) | Population | Confirmed | Deaths | CFR (%) |
|---|---|---|---|---|---|---|---|
| Abia | 2,072 | 5,482 | 29.4 | 2,845,380 | 34 | 6 | 17.6 |
| Abuja | 1,357 | 4,610 | 33.5 | 1,406,239 | 28 | 3 | 10.7 |
| Akwa Ibom | 2,453 | 4,724 | 29.2 | 3,902,051 | 17 | 3 | 17.6 |
| Anambra | 1,563 | 4,753 | 30.6 | 4,177,828 | 1 | 0 | 0.0 |
| Bauchi | 1,022 | 3,834 | 35.0 | 4,653,066 | 225 | 31 | 12.4 |
| Benue | 1,370 | 4,787 | 32.7 | 4,253,641 | 119 | 16 | 12.5 |
| Delta | 2,018 | 4,794 | 28.9 | 4,112,445 | 32 | 4 | 12.5 |
| Ebonyi | 1,706 | 4,854 | 31.3 | 2,176,947 | 172 | 27 | 17.6 |
| Edo | 1,520 | 5,576 | 29.6 | 3,233,366 | 417 | 63 | 14.8 |
| Enugu | 1,480 | 5,278 | 30.6 | 3,267,837 | 34 | 6 | 17.6 |
| Imo | 2,032 | 5,151 | 29.8 | 3,927,563 | 8 | 0 | 0.0 |
| Kaduna | 1,313 | 4,386 | 32.7 | 6,113,503 | 121 | 16 | 10.5 |
| Kogi | 1,247 | 5,499 | 31.0 | 3,314,043 | 41 | 6 | 13.7 |
| Nasarawa | 1,277 | 4,550 | 34.1 | 1,869,377 | 24 | 5 | 22.1 |
| Ondo | 1,465 | 5,692 | 28.8 | 3,460,877 | 403 | 63 | 16.4 |
| Plateau | 1,083 | 4,183 | 34.6 | 3,206,531 | 147 | 22 | 14.5 |
| Taraba | 1,549 | 4,979 | 32.3 | 2,294,800 | 185 | 28 | 13.6 |
Table 1: State-level distribution of confirmed Lassa fever cases, deaths, case fatality, population, and selected environmental characteristics in Nigeria, 2021
| Variable | Estimate (β) | Std. Error | z-value | p-value | IRR = exp(β) |
|---|---|---|---|---|---|
| Intercept | -23.8000 | 4.1000 | -5.804 | <0.001 | ~0.0000 |
| Lagged cases (t−1) | 0.002179 | 0.001890 | 1.153 | 0.2489 | 1.0022 |
| Lagged cases (t−2) | 0.007094 | 0.002580 | 2.750 | 0.0060 | 1.0071 |
| Rainfall (mm) | 0.001094 | 0.000349 | 3.131 | 0.0017 | 1.0011 |
| NDVI | 0.000476 | 0.000273 | 1.742 | 0.0816 | 1.0005 |
| Land Surface Temperature (°C) | 0.2121 | 0.0843 | 2.515 | 0.0119 | 1.2362 |
| Seasonality (sin52) | 0.6573 | 0.0927 | 7.089 | <0.001 | 1.9296 |
| Seasonality (cos52) | 0.3869 | 0.1397 | 2.769 | 0.0056 | 1.4724 |
Table 2: Estimated effects of epidemiological, environmental and seasonal factors on Lassa fever incidence
| Category | State / Method | n | RMSE | MAE | MAPE (%) |
|---|---|---|---|---|---|
| State-Level Holdout Validation | Plateau | 1 | 20.50 | 20.50 | 70.8 |
| Bauchi | 3 | 13.90 | 11.40 | 40.5 | |
| Taraba | 2 | 13.30 | 10.60 | 51.9 | |
| Kaduna | 1 | 12.30 | 12.30 | 44.0 | |
| Ondo | 8 | 10.10 | 6.96 | 48.0 | |
| Edo | 8 | 9.51 | 6.31 | 41.6 | |
| Benue | 2 | 5.55 | 4.70 | 395.0 | |
| Nasarawa | 1 | 4.76 | 4.76 | 47.6 | |
| Ebonyi | 2 | 2.49 | 2.38 | 23.8 | |
| Kogi | 1 | 0.997 | 0.997 | 49.8 | |
| Overall Forecast Validation Metrics | In-sample (Training) | — | 6.94 | 5.18 | — |
| Holdout Test (20%) | — | 10.42 | 7.39 | 68.7 | |
| Rolling-origin Cross-Validation | — | 8.29 | 6.20 | — | |
| Additional Forecast Evaluation Results | Gap (Holdout RMSE − In-sample RMSE) | — | 3.48 | — | — |
| Theta (Dispersion Parameter) | — | 7.07 | — | — |
Table 3: Forecast validation performance of the Negative Binomial Lassa fever model across Nigerian states
Oluwafemi Lawal Bisiriyu1,&, Gloria Oluwaseun Olatunji2, Adetumi Adetunji Subulade3
1Department of Statistics, Obafemi Awolowo University, Ile-Ife, Nigeria, 2Department of Epidemiology, School of Public Health, University of Medical Sciences, Ondo, Nigeria, 3Infectious Disease & Research Centre Unit, Community Health Department, Federal Medical Centre, Owo, Ondo State, Nigeria.
&Corresponding author: Oluwafemi Lawal Bisiriyu, Department of Statistics, Obafemi Awolowo University, Ile-Ife, Nigeria, Email: olbisiriyu@oauife.edu.ng
Received: 04 Jan 2026, Accepted: 21 Aug 2026, Published: 28 Aug 2026
Domain: Infectious Disease Epidemiology
Keywords: Lassa fever, Predictive Analytics, Geographic Information Systems (GIS), Epidemic Forecasting, Infectious Disease Modelling
©Oluwafemi Lawal Bisiriyu et al. Journal of Interventional Epidemiology and Public Health (ISSN: 2664-2824). This is an Open Access article distributed under the terms of the Creative Commons Attribution International 4.0 License (https://creativecommons.org/licenses/by/4.0/), which permits unrestricted use, distribution, and reproduction in any medium, provided the original work is properly cited.
Cite this article: Oluwafemi Lawal Bisiriyu et al. The digital epidemic shield: Revolutionizing Lassa fever preparedness with predictive analytics. Journal of Interventional Epidemiology and Public Health. 2026; 9(Suppl 12):14. https://doi.org/10.37432/jieph-d-26-00006
Introduction: Lassa fever is a significant threat to the public health of West Africa, as it is endemic in areas with frequent outbreaks that lead to high morbidity and mortality. The greatest burden of the disease in the region is experienced in Nigeria, and this disease is persistent and spreads across several ecological zones. Preparedness and response to outbreaks require quick identification of risky areas and proper prediction of outbreaks. This paper uses the concepts of spatial epidemiology and predictive modelling in order to describe the geographic patterns and dynamic trends of Lassa fever in Nigeria.
Methods: The study employs a retrospective observational method utilising the epidemiological surveillance data that is publicly available, environmental covariates (rainfall, land surface temperature, and vegetation index), and administrative boundary datasets. R was used to conduct spatial analyses to determine geographic clusters and hotspots of Lassa fever at the state level. Negative Binomial regression was used to model temporal dynamics that incorporated overdispersion and temporal dependence. The prediction of weekly incidence was performed in a 12-week prediction horizon with the help of past trends of cases and environmental predictors.
Results: There was a strong spatial clustering of Lassa fever cases with a high burden consistently recorded in Edo, Ondo, Ebonyi, Bauchi, and Taraba states, which is similar to results reported in earlier studies. The rainfall, land surface temperature, and vegetation density were environmental factors which were significantly correlated with the disease incidence (p < 0.01). The predictive accuracy of the forecasting models revealed the possible persistence of the transmission risk in high-burden states during the project period.
Conclusion: Spatial analytics blended with environmental information and predictive modelling offers localised, actionable information on the dynamics of Lassa fever transmission. Enhancing state-level surveillance, environmental surveillance, as well as capacity building in the area of diagnostics to respond and intervene early, specifically to allow a decreased effect of Lassa fever outbreaks in Nigeria.
Lassa fever (LF) is a viral hemorrhagic disease caused by the Lassa virus harboured in the multi-mammate rat (Mastomys natalensis), usually abundant in the tropical zone of West Africa, with about 100,000 – 300,000 cases each year and results in about 5000 deaths annually [1]. High fatality rates recorded from previous LF outbreaks further confirm the public health risk and potential future outbreaks [2]. More than 80% of Lassa virus (LASV) infections are either asymptomatic or mild, with usual clinical signs of pyrexia and haemorrhage associated with nervous morbidity, respiratory distress, and encephalitis [3]. Lassa fever is endemic in Nigeria. The year 2025 registered 758 total confirmed cases in epidemiological week 23, with 18 states reporting at least one case. Ninety per cent of the cases were reported in Ondo, Edo, Bauchi, Ebonyi and Taraba states, with Ondo State accounting for over 31% of total cases [4].
The case fatality rate reported was 18.9%, and all age groups could be affected, though the predominant age group was 21 to 30 years [4, 5]. In these endemic areas, there are seasonal outbreaks of Lassa fever because the weather conditions can influence the rodent population and distribution in the environment [6]. The correlation between the environmental, climatic, ecological and social changes and the population level of rodents, which are the principal reservoir for Lassa fever, is documented in the literature [7]. Outbreaks of Lassa fever in Nigeria often begin in November and continue until May, with the most cases typically seen in the first four months of the year; however, there are also a few cases reported from time to time throughout the year [7, 8].
Previous studies emphasized the importance of community hygiene in preventing transmission, the effectiveness of machine learning models, especially ensemble boosted trees, in analysing mortality rates, and severity biases in Lassa fever data [9]. However, understanding of various factors associated with Lassa fever outbreaks, including environmental changes and the possibility of early forecasting, will contribute to effective prevention and control measures of the disease. Hence, this study aims to improve early detection, forecasting, and targeted response to Lassa fever outbreaks in Nigeria by integrating spatial epidemiological analysis, statistical assessment of key determinants and predictive modelling to support evidence-based and public health response.
Study design
We used a retrospective observational analytical design combining spatial epidemiology, statistical modelling, and prediction of Lassa fever cases in Nigeria. The study draws secondary data on reported cases of Lassa fever for the year 2021 as well as all relevant epidemiological, environmental, climatic and demographic variables. The most important determinants of Lassa fever transmission were assessed and quantified by inferential statistical methods, and geographic hotspots and high-risk areas of transmission were identified through spatial analytical techniques. Additionally, predictive modelling methods were developed to predict the future patterns of incidence and possible dynamics of outbreaks in affected geographic areas.
Data source
Weekly data on confirmed and suspected Lassa fever cases were obtained from the Nigeria Centre for Disease Control (NCDC). Environmental and climatic variables, including rainfall, temperature, land surface temperature (LST), and normalized difference vegetation index (NDVI), were derived from Google Earth Engine. Population data were obtained from the Nigeria National Data Archive (NADA), and administrative boundary shapefiles were sourced from the Global Administrative Areas (GADM) database.
Statistical analysis
Datasets were harmonized to ensure temporal alignment and spatial consistency at the state level. Environmental variables were normalized to reduce seasonal bias, and all layers were merged using unique location–time identifiers. Missing records were excluded. Annual datasets (approximately 204 observations) were analysed solely for hotspot identification and structural inference using negative-binomial regression modelling. This prevented conflation of structural geographic risk with transient outbreak dynamics and generated interpretable risk maps to guide resource allocation.
Spatial weights matrix
Prior to hotspot classification, a spatial contiguity structure was established using Queen’s contiguity (first-order), whereby two states i and j were defined as neighbours if they shared any boundary point or vertex. The neighbour list was encoded as a row-standardised spatial weights matrix W, with elements:
\[W_{ij} = a_{ij}/\varepsilon_j[a_{ij}]\]
where \(a_{ij} = 1\) if states \(i\) and \(j\) are contiguous and 0 otherwise, ensuring each row sums to unity: \(\sum_j W_{ij} = 1\).
where a_ij = 1 if states i and j are contiguous and 0 otherwise, ensuring each row sums to unity: Σ_j W_ij= 1.
Global spatial autocorrelation (Moran’s I)
Global spatial autocorrelation in Lassa fever incidence (cases per 100,000) and confirmed case counts was evaluated using Moran’s I statistic (Moran, 1950):
\[I = \frac{\left( \frac{n}{\sum_i \sum_j W_{ij}} \right) \cdot \left( \sum_i \sum_j W_{ij}(x_i – \bar{x})(x_j – \bar{x}) \right)}{\sum_i (x_i – \bar{x})^2}\]
where n is the number of states; xi is the observed value (incidence or confirmed cases) at state i; x̅ is the global mean; and wij are elements of the spatial weights matrix. Values of I approaching +1 indicate positive spatial autocorrelation (geographic clustering), while values near −1 indicate spatial dispersion. Inference was conducted under a randomization assumption, with statistical significance assessed at α = 0.05.
Getis–Ord Gi* hotspot statistic
Hotspot classification was performed using the Getis–Ord G*i statistic, which evaluates whether the local sum of attribute values at state i and its neighbours is significantly larger (or smaller) than expected under spatial randomness. The statistic is defined as:
\[G_i^* = \frac{\sum_j W_{ij} x_j – \bar{x} \sum_j W_{ij}}{s \sqrt{\frac{\left[n \sum_j W_{ij}^2 – \left(\sum_j W_{ij}\right)^2\right]}{n – 1}}}\]
Where:
The resulting G*i values follow an asymptotic standard normal distribution under the null hypothesis of complete spatial randomness. Two-sided p-values were derived as p = 2Φ(−|z|), where Φ is the standard normal cumulative distribution function.
Hotspot classification criteria
States were classified according to the direction and statistical significance of the Getis–Ord Gi∗ statistic [10]. A statistical significant positive G*i z-score (z > +1.96, p < 0.05) indicates a hotspot; a state where both the focal state and its spatial neighbors report disproportionately high Lassa fever burden relative to the national distribution. Conversely, a negative and significant z-score (z < −1.96, p < 0.05) indicates a cold spot. States where p ≥ 0.05 were classified as not significant. All analyses were conducted at α = 0.05 without multiple-testing correction, consistent with exploratory spatial analysis.
Temporal hotspot analysis
The G*i statistic was additionally computed independently for each epidemiological week, using the weekly panel dataset of confirmed cases and incidence per 100,000 population. For each week, a state-specific spatial weights matrix was constructed from the subset of states with non-missing observations (n ≥ 2). The resulting weekly G*i z-scores were mapped to visualise the spatiotemporal evolution of Lassa fever hotspot clusters across the transmission season.
Negative binomial analysis and prediction
Let Y_it denote the observed number of confirmed Lassa fever cases in state i at time t because the outcome variable exhibits overdispersion, Y_it is assumed to follow a Negative Binomial distribution.
Assumption:
\[Y_{it} \sim NegBin(\mu_{it}, \theta)\]
Where:
\[\mu_{it} = E(Y_{it}) \text{ is the mean number of cases}\]
\[\theta > 0 \text{ is the dispersion (overdispersion) parameter}\]
The variance is given by:
\[Var(Y_{it}) = \mu_{it} + \frac{\mu_{it}^2}{\theta}\]
Allowing the variance to exceed the mean
A log-link function is used to relate the mean μ_it to a set of covariates:
\[
\log(\mu_{it}) = \log(Pop_{it}) + \beta_0 + \beta_1 Y_{i,t-1} + \beta_2 Y_{i,t-2} + \beta_3 \text{Rainfall}_{it} + \beta_4 \text{NDVI}_{it} + \beta_5 \text{LST}_{it} + \beta_6 \sin\left(\frac{2\pi t}{52}\right) + \beta_7 \cos\left(\frac{2\pi t}{52}\right)
\]
Where:
Exponentiation the linear predictor gives the conditional mean:
\[\mu_{it} = Pop_{it} \exp\left(\beta_0 + \beta_1 Y_{i,t-1} + \beta_2 Y_{i,t-2} + \beta_3 \text{Rainfall}_{it} + \beta_4 \text{NDVI}_{it} + \beta_5 \text{LST}_{it} + \beta_6 \sin\left(\frac{2\pi t}{52}\right) + \beta_7 \cos\left(\frac{2\pi t}{52}\right)\right)\]
Given observations (\(Y_{it}\)), the log-likelihood for the negative binomial model is:
\[
\ell(\beta, \theta) = \sum_{i,t} \left[ \log \Gamma(y_{it} + \theta) – \log \Gamma(\theta) – \log(y_{it}!) + \theta \log \left( \frac{\theta}{\theta + \mu_{it}} \right) + y_{it} \log \left( \frac{\mu_{it}}{\theta + \mu_{it}} \right) \right]
\]
Which was maximised to estimate \(\beta\) and \(\theta\).
Short-term forecasting used weekly datasets containing nearly 5,900 observations. Negative binomial regression modelling with lagged covariates was implemented to predict weekly Lassa fever incidence.
For a new observation with covariates, \( X_{it}^* \), the predicted mean number of cases is:
\[\hat{\mu}_{it}^* = Pop_{it}^* \exp(X_{it}^* \hat{\beta})\]
Future cases are generated from:
\[Y_{it}^* \mid X_{it}^* \sim NegBin(X_{it}^* \hat{\beta}, \hat{\theta})\]
Allowing probability forecasting and uncertainty quantification.
\(\exp(\beta_j)\) represents the multiplicative change in incidence rate associated with a one-unit increase in covariate \( j \), holding other variables constant.
The offset ensures interpretation in terms of population-standardised incidence rates.
The dispersion parameter θ quantifies the degree of overdispersion relative to a Poisson model.
In this study, the Negative Binomial regression model was chosen since the counts of Lassa fever cases showed overdispersion, that is, the variance of the outcome variable is larger than its mean. This is typical in the context of infectious disease surveillance data, where clustering of cases, unobserved heterogeneity across states, and fluctuations in outbreaks over time lead to this. It assumes equality of mean and variance, as the standard Poisson regression does and is therefore inappropriate for overdispersed count data, as it tends to underestimate standard errors and produces inaccurate statistical inferences. The Negative Binomial model, on the other hand, introduces an extra-Poisson dispersion parameter to address the additional variability, and offers more accurate coefficient estimates, confidence intervals and forecasts. Moreover, the model is suitable for epidemiological time-series forecasting as it allows high skewness in the number of disease cases and location- and week-to-week differences in transmission intensity. Predictor variables included historical case counts, rainfall, temperature, NDVI, and humidity [11].
Goodness-of-fit
Evaluation metrics included root mean square error (RMSE) and mean absolute error. All datasets were publicly available, aggregated, and contained no personal identifiers. Analyses complied with Nigerian data protection and governance standards. In-sample goodness-of-fit measures such as Root Mean Square Error (RMSE) and Mean Absolute Error (MAE) were used to initially evaluate model performance. A further validation strategy used was a rolling-origin validation whereby the model was built each time on a subset of data up to that point in time and then validated against the next week or two of data that were not included in the training set. A further validation strategy used is the rolling-origin validation approach, where the model is repeatedly trained on a smaller and smaller subset of data and then validated on the following one or two weeks of data that is not included in the training set to reduce overfitting bias and increase predictive validity. This approach gave more robust out-of-sample forecast performance evaluation for the prediction of Lassa fever incidence.
Ethical consideration
The data used for this study were publicly sourced and do not require ethical approval.
The results presented the distribution and determinants of Lassa fever across the study areas from complementary demographic, geographical, environmental, and epidemiological perspectives. The findings were organized into five components: demographic factors; geographical distribution and hotspot analysis; environmental drivers of Lassa fever hotspots in Nigeria; statistical assessment of key determinants; and predictive analysis using the Negative Binomial model.
Demographic factors
There are variations in the burden of confirmed Lassa fever cases and deaths across Nigerian states, alongside differences in environmental conditions, population size, and case fatality (Table 1). The highest number of confirmed cases was recorded in Edo State (417 cases), followed closely by Ondo State (403 cases). Both states also recorded the highest number of deaths, with 63 deaths each, indicating a persistent and substantial burden of Lassa fever. Edo had relatively high vegetation density (NDVI = 5,576) and moderate rainfall (1,520 mm), while Ondo had the highest NDVI (5,692) among the states and moderate rainfall (1,465 mm). This pattern suggested that established ecological suitability, together with continued human exposure and transmission opportunities, might have contributed to the sustained burden observed in these known endemic areas. Bauchi State recorded the third-highest burden, with 225 confirmed cases and 31 deaths, despite having considerably lower rainfall (1,022 mm) and vegetation density (NDVI = 3,834). Its relatively high land surface temperature (35.0°C) further demonstrated that Lassa fever transmission was not restricted to the wetter and more vegetated southern parts of Nigeria. Taraba and Plateau States also recorded substantial numbers of confirmed cases, with 185 and 147 cases and 28 and 22 deaths, respectively. Taraba had moderate rainfall (1,549 mm), relatively high vegetation density (NDVI = 4,979), and a moderate temperature of 32.3°C. Plateau, in contrast, had lower rainfall (1,083 mm) and NDVI (4,183), but recorded a relatively high case fatality rate (CFR) of 14.5%. These findings suggested that disease outcomes were influenced not only by environmental conditions but also potentially by factors such as timely diagnosis, access to appropriate clinical care, referral systems, and availability of treatment.
Benue and Kaduna states also had a significant disease burden of 119 and 121 confirmed cases, respectively, with 16 deaths each. The environmental profiles they had were relatively moderate, with Kaduna showing the highest population in the table (6.11 million). Ebonyi State had 172 confirmed cases and 27 deaths, with fairly moderate rainfall (1,706 mm), NDVI (4,854) and temperature (31.3°C). It had a relatively high CFR of 17.6%. Likewise, Abia and Enugu States had 34 confirmed cases each, with 6 deaths and a CFR of 17.6%.
The State of Nasarawa had 24 confirmed cases and 5 deaths, with the highest CFR in the table (22.1%). In spite of its rather limited number of confirmed cases, the remarkably high mortality among confirmed cases was an issue of concern. The moderate rainfall (1,247 mm), relatively high NDVI (5,499) and temperature (31.0°C) were seen in Kogi State, where 41 confirmed cases and 6 deaths were recorded. Its CFR was 13.7%.
In the city of Abuja, there were 28 confirmed cases and 3 deaths, while the rainfall was relatively low (1,357 mm), the vegetation density was moderate (NDVI = 4,610), and the temperature was relatively high (33.5°C). Its CFR was 10.7%. The CFR rates were also similar, such as Kaduna with 10.5 % and Benue with 12.5 %. These relatively lower CFRs could reflect variations in case detection, access to health care, diagnosis, referral and clinical management. Relatively low disease burden was observed in Akwa Ibom (17 cases) and Delta States (32 cases) with rainfall of 2,453 and 2,018 mm respectively. The number of confirmed cases was very low in Anambra (1) and Imo (8), while no death reported in either state.
However, Anambra, with moderate rainfall of 1,563 mm and NDVI of 4,753, experienced comparatively low rainfall and NDVI, whereas IMO had relatively high rainfall (2,032 mm) and NDVI (5,151)
Geographical distribution and hotspot analysis
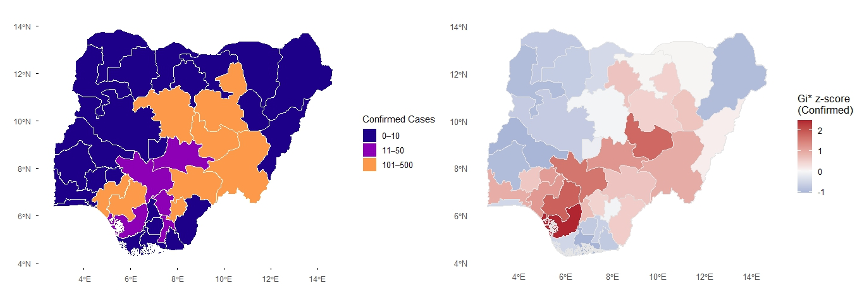
The spatial distribution of the confirmed Lassa fever cases in Nigeria as presented in Figure 1 indicated a high degree of spatial clustering of Lassa burden and risk. States in the Southwestern and North Central parts, especially in Ondo State and Edo State, have the largest cumulative total number of confirmed cases, meaning continued transmission of the disease in these areas. The hotspot analysis also reveals Ondo, Edo, Ebonyi, and Taraba States as the high-risk hotspots, as they indicate statistically significant and repetitive clustering of incidence of Lassa fever. Kogi, Benue, Plateau, Bauchi and Delta States are identified as medium-risk hotspots.
Environmental drivers of Lassa fever hotspots in Nigeria
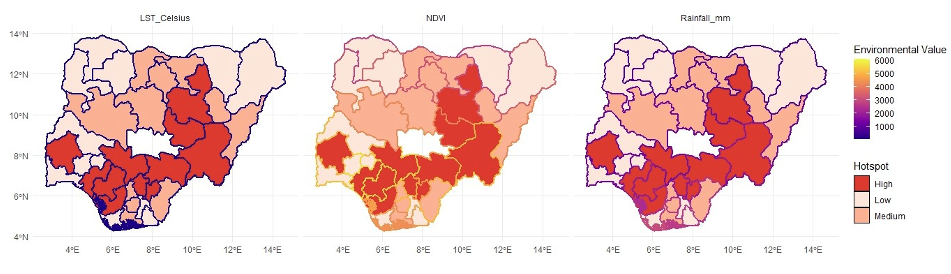
Figure 2 shows the spatial distribution of the main environmental factors: Land Surface Temperature (LST), vegetation density (NDVI), and rainfall on Lassa fever hotspot intensity (low, medium, high) in Nigeria. The combination of them indicates the correspondence between the environmental appropriateness and observed risk of diseases. The Land Surface Temperature (LST) map indicated that high Lassa fever hotspots were found to be mainly concentrated in areas that have moderate to high temperatures, especially in the southwest, southeast and north-central belt of Nigeria. Hotspots in the North are very hot, suggesting they will not be ecologically active and support sustainable transmission, while hotspots in the high-hotspot states exist within a range of hot temperatures that would allow rodent reservoir maintenance and human-rodent interaction. The NDVI map shows that the states with high hotspots are nearly directly and considerably correlated with southern and central states with moderate and high vegetation density.
The rainfall map also follows this pattern; the high/medium hotspot states are located in the regions with moderate to high annual rainfall, which are conducive to the growth of vegetation and the dynamics of rodents. However, areas of very high rainfall in the coastal strip show mixed hotspot intensity, suggesting that the excess rainfall contributes to high transmission, but likely that this risk will be influenced by other ecological or socioenvironmental factors.
Statistical assessment of key determinants
The Negative Binomial regression model in Table 3 was fitted to account for over-dispersion in weekly Lassa fever case counts across Nigerian states. The estimated dispersion parameter (theta = 7.07) confirms that the Negative Binomial distribution was more appropriate than a standard Poisson model for the data. The model demonstrated substantial improvement over the null model, with the residual deviance decreasing from 404.54 to 113.63, indicating good explanatory performance. The Akaike Information Criterion (AIC = 664.4) also suggests a reasonably good model fit. Among the autoregressive terms, the first lag variable ((y_{lag1})) was not statistically significant ((p = 0.249)), implying that cases from the immediately preceding week did not strongly influence current transmission after adjusting for environmental variables. However, the second lag term ((y_{lag2})) was significant ((p = 0.006)), suggesting delayed temporal dependence in Lassa fever transmission dynamics. Environmental predictors played an important role in explaining disease incidence. Rainfall was positively associated with Lassa fever cases ((p = 0.0017)), indicating that wetter conditions may favor rodent population growth and disease transmission. Land Surface Temperature (LST) was also significant ((p = 0.0119)), with each unit increase associated with approximately 23.6% higher expected incidence ((IRR = 1.236)). NDVI showed only marginal significance ((p = 0.082)), suggesting vegetation may have a weaker or indirect influence. The seasonal harmonic terms ((sin52) and (cos52)) were highly significant, confirming strong cyclical seasonal patterns in Lassa fever occurrence across epidemiological weeks. This aligns with known seasonal outbreaks during dry-season periods in Nigeria
Predictive analysis
To strengthen the assessment of predictive performance, Table 3 shows both holdout validation and rolling-origin cross-validation were conducted in addition to standard in-sample evaluation. The in-sample model fit produced an RMSE of 6.94 and MAE of 5.18, indicating reasonably good agreement between observed and fitted values within the training dataset. However, in-sample metrics alone may overestimate predictive performance because the model is evaluated on the same data used for estimation. The holdout validation, which reserved 20% of the observations for testing, produced higher prediction errors (RMSE = 10.42; MAE = 7.39).
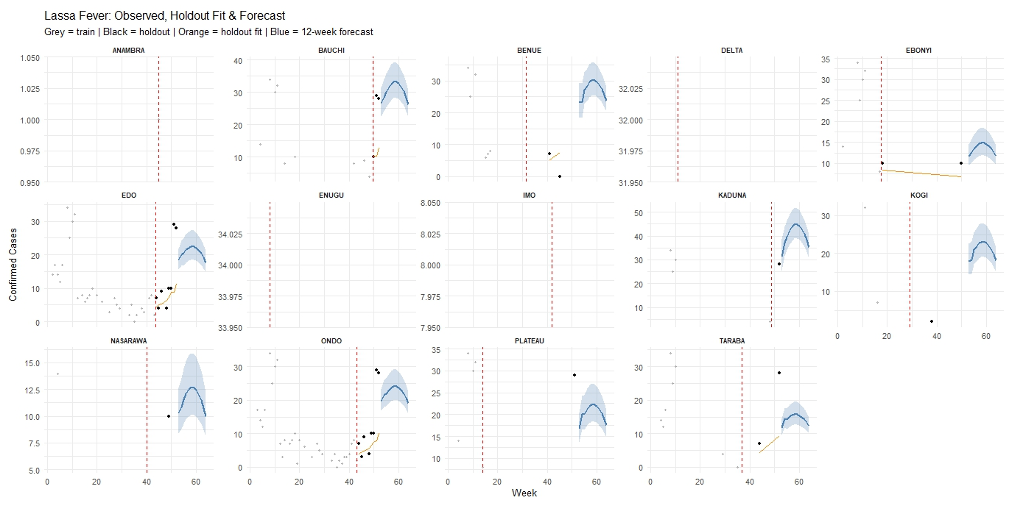
The increase in RMSE relative to the training error (gap = 3.48) suggests moderate overfitting, though the model retained acceptable predictive capability on unseen data. Rolling-origin cross-validation yielded intermediate performance (RMSE = 8.29; MAE = 6.20), indicating that the forecasting model maintained relatively stable predictive accuracy across sequential forecasting windows. This provides stronger evidence that the model generalizes reasonably well over time. At the state level, predictive performance varied substantially. Ondo and Edo showed relatively strong predictive correlations, reflecting more stable temporal patterns and larger sample sizes. Conversely, states with very small validation samples (e.g., Plateau, Kaduna, Nasarawa, and Kogi) produced unstable or undefined correlation estimates. Benue exhibited an unusually high MAPE (395%), likely due to very low observed counts during validation periods, where small absolute errors inflate percentage-based metrics. Figure 3 presents the observed, holdout-fit, and 12-week forecasted Lassa fever cases across selected Nigerian states using a Negative Binomial time-series model. Grey points represent the training observations used for model fitting, black points indicate the holdout observations reserved for validation, the orange line shows model predictions on the holdout set, while the blue line and shaded ribbon represent the 12-week forecast and its 95% confidence interval.
The vertical red dashed line separates the training period from the validation and forecasting periods. Overall, the model demonstrated reasonable predictive performance across most states, as the holdout predictions generally followed the observed holdout cases, suggesting that the forecasting framework possesses moderate generalisation ability beyond the training data. Forecast uncertainty increased progressively over the forecast horizon, which is expected in recursive time-series prediction due to cumulative propagation of prediction errors.
States such as Edo, Ondo, Bauchi, and Benue exhibited comparatively strong predictive performance, with the holdout predictions closely matching the observed case counts. In Edo and Ondo particularly, the model successfully captured the declining and stabilising transmission patterns, indicating that the autoregressive and environmental covariates effectively represented the temporal dynamics of Lassa fever transmission in these endemic states. Forecasts for these states suggested sustained moderate transmission during the subsequent 12-week period. Bauchi and Taraba also demonstrated acceptable forecasting behavior, with predicted trajectories reflecting the overall direction of observed transmission trends.
The widening confidence intervals in these states indicate increasing uncertainty further into the forecast period, although the central forecast trajectories remained epidemiologically plausible. In contrast, states such as Anambra, Enugu, Imo, and Delta displayed almost constant or highly sparse time series with minimal variability in observed cases. Because of the limited temporal variation in these datasets, the model had restricted capacity to estimate meaningful transmission dynamics, and interpretation of forecasts for these states should therefore be approached cautiously.
This study demonstrated that Lassa fever (LF) had remained an important and geographically concentrated public health problem in Nigeria, although transmission was not restricted to a single ecological zone. A large proportion of reported cases and deaths were concentrated in a few states, including Ondo, Edo, Bauchi, Taraba and Ebonyi. The concentration of disease in these states highlighted the importance of geographically targeted surveillance and preparedness rather than relying solely on uniform national interventions. The findings were consistent with previous evidence identifying Nigeria as an important hotspot of Lassa fever transmission in West Africa and recognising the continuing evolution of the disease as a regional public health threat [12,13].
The high burden observed in Ondo and Edo was consistent with their longstanding recognition as important Lassa fever endemic areas. Previous studies had associated Lassa fever transmission with interactions among human populations, environmental conditions and the rodent reservoir, particularly Mastomys natalensis [14-16]. The persistence of high disease burden in these states suggested that Lassa fever control required sustained surveillance and preparedness rather than interventions implemented only during recognized outbreaks. At the same time, the substantial burden observed in Bauchi and Taraba demonstrated that Lassa fever had not been confined to the humid southern belt. Previous studies had similarly indicated that the potential ecological niche of Lassa fever extended across diverse areas of West Africa [17,18]. These findings had important implications for surveillance. States with persistent transmission required continuous case detection, laboratory readiness and clinical preparedness, while states with lower reported burden still required sufficient surveillance sensitivity to detect emerging transmission.
The environmental findings showed that Lassa fever occurred under a range of climatic and ecological conditions. High-risk areas included locations with moderate-to-high rainfall and vegetation density, although substantial disease burden was also observed under relatively lower rainfall or vegetation conditions. This suggested that no single environmental factor could adequately explain transmission. Rather, rainfall, vegetation and temperature could have influenced transmission indirectly through their effects on rodent habitat, food availability and human–rodent interactions. Previous studies had similarly identified ecological and climatic conditions as important components of the Lassa fever transmission environment [17,18]. These findings reinforced the need a One-Health approach as to integrate human health, environmental and animal health information. Such an approach would have been particularly relevant in rural and peri-urban communities where household conditions, food storage and sanitation could facilitate contact between humans and rodents.
Sustained risk communication was also necessary to improve awareness of symptoms, transmission routes and the importance of early healthcare seeking. Evidence from Nigeria had shown that knowledge and risk perception were relevant to Lassa fever prevention and control [18,19]. Community engagement should therefore have involved local leaders, health workers and other community structures rather than relying only on periodic outbreak-related campaigns. The variation in case fatality across states had important implications for clinical care. Higher case fatality in some states could have reflected delayed diagnosis, limited access to appropriate treatment, referral delays or differences in case detection and reporting. Early diagnosis remained essential for improving outcomes in patients with Lassa fever [19].
Previous research in Nigerian Lassa fever treatment centres had identified inconsistencies in the use of appropriate personal protective equipment [20]. The present findings reinforced the need for health facilities in high-risk areas to maintain IPC capacity throughout the year. This included adequate PPE, staff training, isolation arrangements, safe waste management and clear procedures for managing suspected and confirmed cases. Sustained IPC systems would have protected healthcare workers and reduced the potential for healthcare-associated transmission.
The temporal patterns observed in the study also had implications for outbreak preparedness. The recurring seasonal pattern of Lassa fever suggested that public health authorities could have strengthened preparedness before periods of anticipated increased transmission. Previous studies had linked rainfall and environmental conditions with Lassa fever transmission dynamics in Nigeria [21]. Environmental information could therefore have complemented epidemiological surveillance as part of an early-warning system.
The implications extended beyond Nigeria. Lassa fever represented a regional health security concern as migration across West African countries could facilitate cross-border transmission. The findings therefore supported stronger collaboration among ECOWAS countries through timely sharing of surveillance information, harmonization of case definitions and preparedness procedures, laboratory collaboration and coordinated outbreak response. Regional cooperation would have been particularly important for countries sharing borders with Nigeria and those experiencing substantial population movement.
Limitations
The analysis was restricted to 52 weeks of surveillance data from 2021, limiting the ability to assess longer-term temporal trends and seasonal patterns. The temporal analysis was based on available weekly reported surveillance data, which may be affected by variations in reporting completeness and data availability. The hotspot analysis identified geographical patterns and clustering of confirmed cases but did not establish causal relationships between the observed spatial patterns and potential underlying risk factors.
This study showed that Lassa fever had remained a geographically concentrated but nationally important public health problem in Nigeria, with a substantial burden occurring in Ondo, Edo, Bauchi, Taraba, and Ebonyi. The findings also demonstrated that transmission had occurred across diverse environmental settings, indicating that preparedness could not have been restricted to traditionally recognized endemic areas. The public health implications were substantial. High-burden states required strengthened and sustained surveillance, laboratory capacity and clinical preparedness, while lower-burden states also required sufficient surveillance systems to detect emerging transmission early. The environmental findings supported the incorporation of ecological and climatic information into Lassa fever early-warning systems, but these factors needed to be considered alongside human behaviour, healthcare access and other determinants of exposure. Effective control also required stronger clinical systems, including early recognition, laboratory diagnosis, timely referral, appropriate treatment and infection prevention and control. At community level, sustained risk communication, improved sanitation, appropriate food storage and measures to reduce human–rodent contact remained important preventive strategies.
What is already known about the topic
What this study adds
The authors gratefully acknowledge the Economic Community of West African States (ECOWAS) for providing the scholarly platform through the Second ECOWAS Lassa Fever Conference, where this work was an Oral Presentation at the 2nd ECOWAS Lassa Fever International Conference scheduled held from 8th to 12th September 2025 at Abidjan, Côte d’Ivoire.
Conceptualization: Oluwafemi Lawal Bisiriyu, Gloria Oluwaseun Olatunji, Adetumi Adetunji Subulade
Methodology: Oluwafemi Lawal Bisiriyu
Software: Oluwafemi Lawal Bisiriyu
Formal analysis: Oluwafemi Lawal Bisiriyu
Visualization: Oluwafemi Lawal Bisiriyu
Writing – original draft: Oluwafemi Lawal Bisiriyu, Gloria Oluwaseun Olatunji, Adetumi Adetunji Subulade
Writing – review & editing: Oluwafemi Lawal Bisiriyu, Gloria Oluwaseun Olatunji, Adetumi Adetunji Subulade
| State | Rainfall (mm) | NDVI | LST (°C) | Population | Confirmed | Deaths | CFR (%) |
|---|---|---|---|---|---|---|---|
| Abia | 2,072 | 5,482 | 29.4 | 2,845,380 | 34 | 6 | 17.6 |
| Abuja | 1,357 | 4,610 | 33.5 | 1,406,239 | 28 | 3 | 10.7 |
| Akwa Ibom | 2,453 | 4,724 | 29.2 | 3,902,051 | 17 | 3 | 17.6 |
| Anambra | 1,563 | 4,753 | 30.6 | 4,177,828 | 1 | 0 | 0.0 |
| Bauchi | 1,022 | 3,834 | 35.0 | 4,653,066 | 225 | 31 | 12.4 |
| Benue | 1,370 | 4,787 | 32.7 | 4,253,641 | 119 | 16 | 12.5 |
| Delta | 2,018 | 4,794 | 28.9 | 4,112,445 | 32 | 4 | 12.5 |
| Ebonyi | 1,706 | 4,854 | 31.3 | 2,176,947 | 172 | 27 | 17.6 |
| Edo | 1,520 | 5,576 | 29.6 | 3,233,366 | 417 | 63 | 14.8 |
| Enugu | 1,480 | 5,278 | 30.6 | 3,267,837 | 34 | 6 | 17.6 |
| Imo | 2,032 | 5,151 | 29.8 | 3,927,563 | 8 | 0 | 0.0 |
| Kaduna | 1,313 | 4,386 | 32.7 | 6,113,503 | 121 | 16 | 10.5 |
| Kogi | 1,247 | 5,499 | 31.0 | 3,314,043 | 41 | 6 | 13.7 |
| Nasarawa | 1,277 | 4,550 | 34.1 | 1,869,377 | 24 | 5 | 22.1 |
| Ondo | 1,465 | 5,692 | 28.8 | 3,460,877 | 403 | 63 | 16.4 |
| Plateau | 1,083 | 4,183 | 34.6 | 3,206,531 | 147 | 22 | 14.5 |
| Taraba | 1,549 | 4,979 | 32.3 | 2,294,800 | 185 | 28 | 13.6 |
| Variable | Estimate (β) | Std. Error | z-value | p-value | IRR = exp(β) |
|---|---|---|---|---|---|
| Intercept | -23.8000 | 4.1000 | -5.804 | <0.001 | ~0.0000 |
| Lagged cases (t−1) | 0.002179 | 0.001890 | 1.153 | 0.2489 | 1.0022 |
| Lagged cases (t−2) | 0.007094 | 0.002580 | 2.750 | 0.0060 | 1.0071 |
| Rainfall (mm) | 0.001094 | 0.000349 | 3.131 | 0.0017 | 1.0011 |
| NDVI | 0.000476 | 0.000273 | 1.742 | 0.0816 | 1.0005 |
| Land Surface Temperature (°C) | 0.2121 | 0.0843 | 2.515 | 0.0119 | 1.2362 |
| Seasonality (sin52) | 0.6573 | 0.0927 | 7.089 | <0.001 | 1.9296 |
| Seasonality (cos52) | 0.3869 | 0.1397 | 2.769 | 0.0056 | 1.4724 |
| Category | State / Method | n | RMSE | MAE | MAPE (%) |
|---|---|---|---|---|---|
| State-Level Holdout Validation | Plateau | 1 | 20.50 | 20.50 | 70.8 |
| Bauchi | 3 | 13.90 | 11.40 | 40.5 | |
| Taraba | 2 | 13.30 | 10.60 | 51.9 | |
| Kaduna | 1 | 12.30 | 12.30 | 44.0 | |
| Ondo | 8 | 10.10 | 6.96 | 48.0 | |
| Edo | 8 | 9.51 | 6.31 | 41.6 | |
| Benue | 2 | 5.55 | 4.70 | 395.0 | |
| Nasarawa | 1 | 4.76 | 4.76 | 47.6 | |
| Ebonyi | 2 | 2.49 | 2.38 | 23.8 | |
| Kogi | 1 | 0.997 | 0.997 | 49.8 | |
| Overall Forecast Validation Metrics | In-sample (Training) | — | 6.94 | 5.18 | — |
| Holdout Test (20%) | — | 10.42 | 7.39 | 68.7 | |
| Rolling-origin Cross-Validation | — | 8.29 | 6.20 | — | |
| Additional Forecast Evaluation Results | Gap (Holdout RMSE − In-sample RMSE) | — | 3.48 | — | — |
| Theta (Dispersion Parameter) | — | 7.07 | — | — |