Research | Open Access | Volume 9 (2): Article 103 | Published: 22 Jun 2026
Views: 64
Menu, Tables and Figures
| Variable | Frequency (n) | Percentage (%) |
|---|---|---|
| Age (months) | ||
| 0 – 11 | 153 | 44.5 |
| 12 – 23 | 147 | 42.7 |
| ≥ 24 | 44 | 12.8 |
| Gender | ||
| Male | 152 | 44.2 |
| Female | 192 | 55.8 |
| Type of admission | ||
| New admission | 329 | 95.6 |
| Re-admission | 15 | 4.4 |
| Country | ||
| Gambia | 278 | 80.8 |
| Senegal | 66 | 19.2 |
| Facility | ||
| Bureng Health Center | 68 | 19.8 |
| Darsilameh Village Health Service | 33 | 9.6 |
| Pakaliba Health Centre | 66 | 19.2 |
| Sutukung Village Health Service | 17 | 4.9 |
| Wellingaraba Village Health Service | 160 | 46.5 |
| Season | ||
| Dry | 158 | 45.9 |
| Rainy | 186 | 54.0 |
| Outcome | ||
| Died | 1 | 0.3 |
| Lost to follow up | 94 | 27.3 |
| Referred | 17 | 4.9 |
| Recovered | 232 | 67.4 |
| Year | ||
| 2020 | 5 | 1.5 |
| 2021 | 29 | 8.4 |
| 2022 | 59 | 17.2 |
| 2023 | 113 | 32.9 |
| 2024 | 138 | 40.1 |
| Circuit | ||
| Wellingaraba Circuit | 175 | 50.9 |
| Other Areas | 94 | 27.3 |
| Darsilameh Circuit | 51 | 14.8 |
| Sutukung Circuit | 24 | 7.0 |
| Predictors of recovery | OR | 95% CI | p-value |
|---|---|---|---|
| Age (months) | |||
| 0–11 (Ref) | 1.00 | – | – |
| 12–23 | 1.00 | 0.62 – 1.63 | 0.992 |
| ≥ 24 | 0.83 | 0.41 – 1.66 | 0.590 |
| Gender | |||
| Female (Ref) | 1.00 | – | – |
| Male | 1.08 | 0.69 – 1.71 | 0.730 |
| Season | |||
| Rainy (Ref) | 1.00 | – | – |
| Dry | 1.27 | 0.81 – 2.00 | 0.305 |
| Type of admission | |||
| New admission (Ref) | 1.00 | – | – |
| Re-admission | 0.23 | 0.07 – 0.67 | 0.008 |
| MUAC (cm) | |||
| < 10.0 (Ref) | 1.00 | – | – |
| 10.0–11.4 | 0.28 | 0.22 – 2.79 | 0.756 |
| 11.5–12.4 | 0.16 | 0.04 – 0.61 | 0.007 |
| 12.5–13.4 | 0.23 | 0.05 – 1.01 | 0.051 |
| > 13.4 | 0.23 | 0.02 – 2.37 | 0.217 |
| Weight (kg) | |||
| ≥ 10 (Ref) | 1.00 | – | – |
| 7.0–9.9 | 0.87 | 0.16 – 4.66 | 0.874 |
| 5.0–6.9 | 0.82 | 0.15 – 4.34 | 0.811 |
| < 5.0 | 0.62 | 0.10 – 3.92 | 0.614 |
| Height/Length (cm) | |||
| ≥ 85 (Ref) | 1.00 | – | – |
| 75–84.9 | 0.11 | 0.01 – 0.82 | 0.031 |
| 65–74.9 | 0.10 | 0.01 – 0.76 | 0.026 |
| < 65 | 0.10 | 0.01 – 0.81 | 0.031 |
| Oedema | |||
| Nil (Ref) | 1.00 | – | – |
| Present | 0.15 | 0.03 – 0.77 | 0.023 |
| Country of residence | |||
| Gambia (Ref) | 1.00 | – | – |
| Senegal | 0.50 | 0.29 – 0.87 | 0.014 |
| Number of visits | |||
| ≥ 5 (Ref) | 1.00 | – | – |
| 3–5 | 0.65 | 0.38 – 1.11 | 0.112 |
| < 3 | 0.14 | 0.07 – 0.28 | < 0.001 |
| Bold indicates significant association at p < 0.05. 1.00 = reference group; n = frequency; OR = odds ratio; CI = confidence interval. | |||
Table 2: Bivariate Logistic Regression of Factors Associated with SAM Recovery in Jarra East District, 2020–2024 (n = 344)
| Predictors of recovery | Null Model [p-value (95% CI)] | Model 2 Adjusted OR (95% CI) p-value | Model 3 Adjusted OR (95% CI) p-value |
|---|---|---|---|
| Age group (months) | |||
| 0–11 (Ref) | – | 1.00 | 1.00 |
| 12–23 | – | 1.24 (0.63–2.44) 0.54 | 1.32 (0.60–2.92) 0.48 |
| ≥ 24 | – | 1.15 (0.44–2.97) 0.78 | 2.12 (0.70–6.44) 0.18 |
| Gender | |||
| Female (Ref) | – | 1.00 | 1.00 |
| Male | – | 0.97 (0.57–1.68) 0.94 | 1.39 (0.74–2.64) 0.31 |
| Season | |||
| Dry (Ref) | – | 1.00 | 1.00 |
| Rainy | – | 0.91 (0.53–1.57) 0.73 | 1.02 (0.54–1.91) 0.96 |
| Type of admission | |||
| New admission (Ref) | – | 1.00 | 1.00 |
| Re-admission | – | 0.20 (0.06–0.75) 0.02* | 0.47 (0.12–1.86) 0.28 |
| MUAC (cm) | |||
| < 10.0 (Ref) | – | 1.00 | 1.00 |
| 10.0–11.4 | – | 0.49 (0.10–2.32) 0.37 | 0.78 (0.10–6.04) 0.91 |
| 11.5–12.4 | – | 0.10 (0.02–0.50) 0.01* | 0.98 (0.10–9.55) 0.99 |
| 12.5–13.4 | – | 0.18 (0.30–1.12) 0.07 | 1.32 (0.12–17.66) 0.82 |
| > 13.4 | – | 0.13 (0.01–1.83) 0.13 | 0.68 (0.03–17.66) 0.82 |
| Weight (kg) | |||
| ≥ 10 (Ref) | – | 1.00 | 1.00 |
| 7.0–9.9 | – | 0.28 (0.22–3.51) 0.32 | 0.32 (0.02–6.15) 0.45 |
| 5.0–6.9 | – | 0.83 (0.39–1.78) 0.63 | 1.16 (0.49–2.74) 0.74 |
| < 5.0 | – | 0.28 (0.05–1.49) 0.13 | 0.35 (0.04–3.28) 0.36 |
| Height/Length (cm) | |||
| < 65 (Ref) | – | 1.00 | 1.00 |
| 65–74.9 | – | 1.62 (0.32–1.18) 0.15 | 0.95 (0.18–5.09) 0.96 |
| 75–84.9 | – | 0.92 (0.21–3.94) 0.91 | 0.74 (0.12–4.72) 0.75 |
| ≥ 85 | – | 4.93 (0.30–81.19) 0.27 | 1.97 (0.10–37.07) 0.65 |
| Oedema | |||
| Nil (Ref) | – | 1.00 | 1.00 |
| Present | – | 0.28 (0.05–1.66) 0.16 | 0.88 (0.13–5.99) 0.89 |
| Country of residence | |||
| Gambia (Ref) | – | 1.00 | 1.00 |
| Senegal | – | 0.62 (0.32–1.18) 0.15 | 1.37 (0.61–3.08) 0.45 |
| Number of visits | |||
| < 3 (Ref) | – | 1.00 | 1.00 |
| 3–5 | – | 5.01 (2.24–11.23) 0.001* | 3.19 (1.26–8.06) 0.01* |
| ≥ 5 | – | 5.96 (2.80–12.71) 0.001* | 2.29 (0.93–5.68) 0.07 |
| Model Comparison | |||
| Log likelihood | −152.159 | −171.784 | −143.178 |
| AIC | 308.318 | 383.568 | 328.355 |
| BIC | 315.999 | 460.323 | 408.948 |
| ICC | 0.377 (95% CI: 0.140–0.691) | – | 0.414 (95% CI: 0.152–0.736) |
| Random intercept variance | 1.989 | – | 2.327 |
| OR = odds ratio; CI = confidence interval; ICC = intracluster correlation coefficient; AIC = Akaike Information Criterion; BIC = Bayesian Information Criterion. Null model checks if clustering matters (are outcomes different across facilities?). Model 2 includes all individual-level predictors (Adjusted ORs). Model 3 adds standardised cluster-level (health facility) random effects. * p < 0.05. | |||
Table 3: Multilevel Logistic Regression of Factors Associated with SAM Recovery in Jarra East District, 2020–2024 (n = 344)


Biran Touray1,2,&, Bakalilu Kijera2,3, Sheriffo Darboe2,4, Obafemi Joseph Babalola5
1Pakaliba Minor Health Centre, Lower River Region, Ministry of Health, The Gambia, 2Gambia Field Epidemiology Training Program (GFETP), Banjul, The Gambia, 3Expanded Program on Immunisation, Ministry of Health, The Gambia, 4Epidemiology and Disease Control Unit, Ministry of Health, The Gambia, 5African Field Epidemiology Training Program, Plot 42, Lugogo Bypass, Kampala, Uganda
&Corresponding author: Biran Touray, Pakaliba Minor Health Centre, Lower River Region, Ministry of Health, The Gambia, Email: birantouray13@gmail.com, ORCID: https://orcid.org/0009-0009-0248-6431
Received: 04 Feb 2026, Accepted: 17 Jun 2026, Published: 22 Jun 2026
Domain: Public Health Nutrition
Keywords: Severe acute malnutrition, sentinel surveillance, treatment recovery, cross-border health, seasonal variation
©Biran Touray et al. Journal of Interventional Epidemiology and Public Health (ISSN: 2664-2824). This is an Open Access article distributed under the terms of the Creative Commons Attribution International 4.0 License (https://creativecommons.org/licenses/by/4.0/), which permits unrestricted use, distribution, and reproduction in any medium, provided the original work is properly cited.
Cite this article: Biran Touray et al., Factors associated with recovery among children treated for severe acute malnutrition in Jarra East District, The Gambia, 2020–2024. Journal of Interventional Epidemiology and Public Health. 2026; 9(2):103. https://doi.org/10.37432/jieph-d-26-00035
Introduction: Severe acute malnutrition (SAM) remains a critical driver of paediatric morbidity and mortality in sub-Saharan Africa. In The Gambia, rural districts such as Jarra East face persistent nutritional challenges exacerbated by seasonal and socioeconomic vulnerabilities. This study characterised the epidemiological distribution, seasonal dynamics, and determinants of recovery among children under five years of age treated for SAM.
Methods: A retrospective analysis of routine nutritional surveillance data was conducted for the period 2020–2024 in Jarra East District. Data were extracted via Kobo Toolbox and analysed using Stata 18. Seasonal variation was assessed by comparing SAM incidence during the rainy (June–October) and dry seasons. A multilevel logistic regression analysis was performed to identify predictors of recovery while accounting for clustering at the health facility level, and spatial mapping using QGIS identifies high-burden community clusters.
Results: A total of 344 cases were analysed. Most children were aged 0-23 months (87.2%), females (55.8%), and new admissions (95.6%). SAM cases were more frequent during the rainy season, accounting for 54.1%. Spatially, the Wellingaraba Circuit exhibited the highest burden (50.9%). The mortality rate was low (0.3%), the successful recovery rate was 67.4%, and a high proportion of cases (27.3%) were lost to follow-up. In multilevel analysis, after accounting for both individual- and facility-level factors, children attending 3–5 visits were three times more likely to recover than those attending fewer than 3 visits (AOR=3.19, 95% CI: 1.26–8.06).
Conclusions: SAM recovery rates in Jarra East remain below international Sphere standards, primarily driven by high default rates and cross-border barriers to care. The concentration of cases during the rainy season and among children under 24 months suggests that interventions must prioritise seasonal scaling and infant-targeted nutritional support. Strengthening community-based follow-up and cross-border health coordination is crucial for enhancing treatment outcomes.
Globally, malnutrition remains a prominent public health concern and disproportionately affects an estimated 51.5 million children under the age of five, accounting for approximately 45% of all under-five deaths worldwide [1]. In low- and middle-income countries, malnutrition among children under five is largely driven by food insecurity and poverty [2]. Child undernutrition is responsible for an estimated 3.5 million deaths annually. It contributes substantially to the global disease burden, including a significant proportion of disability-adjusted life years (DALYs) lost among young children [3].
The Global Hunger Index in 2020 reported the highest levels of hunger severity in Sub-Saharan Africa as one of the worst-affected regions. alongside South Asia [4]. Structural and environmental challenges, including poor food quality, climate variability, poverty, inadequate education, and poor healthcare systems, are major contributors to malnutrition and undernutrition [2, 5], which are reflected in elevated Global Hunger Index (GHI) scores[4]. Childhood malnutrition remains a critical issue in the Gambia [6]. Severe Acute Malnutrition (SAM), defined by weight-for-height z-scores (WHZ) below -3 standard deviations, mid-upper arm circumference (MUAC) below 115 mm, or the presence of nutritional oedema [7], is more prevalent in rural areas due to poor dietary diversity, limited access to healthcare, and seasonal food shortages [8]. The prevalence of SAM is significantly influenced by seasonal variations, with higher rates observed during the lean season when food availability is limited. During this period, peaks in infectious diseases such as diarrhoea and malaria further exacerbate malnutrition and negatively affect child health outcomes [9].
Programmatic management of SAM in children is centred on the provision of nutritionally rich therapeutic foods to promote weight gain, improve infant and young child feeding practices, and provide caregiver counselling[10]. Over the past two decades, the introduction of ready-to-use therapeutic foods (RUTF) has enabled a shift from inpatient to outpatient management of SAM [11]. However, the continued high incidence of SAM, despite the implementation of Community-Based Management of Acute Malnutrition (CMAM) and supplementary feeding interventions, highlights persistent policy gaps and programmatic weaknesses [12]. A clearer understanding of the epidemiologic determinants and distribution of SAM is therefore essential to guide more effective and targeted interventions.
Previous studies on child malnutrition in the Gambia have largely focused on national-level analyses, with relatively few examining district-level specific dynamics [8]. The Gambia Nutrition Surveillance Programme (GNSP) is an institutionalised nutrition surveillance initiative that conducts biannual assessments of children between 6-59 months across primary health care (PHC) villages[13]. However, expansion into non-PHC villages is necessary to strengthen the development of an effective Early Warning System and to better inform intervention strategies for nutritional problems [13]. The absence of disaggregated data on SAM in Jarra East District limits evidence-based policymaking and targeted programme implementation. Consequently, analysing SAM data at the district level can provide insights into geographic hotspots and the epidemiological distribution of SAM in Jarra East District, thereby informing more targeted and effective interventions. This study aimed to assess the epidemiological distribution, seasonal patterns, and determinants of recovery among children under five years treated for severe acute malnutrition (SAM) in Jarra East District, The Gambia.
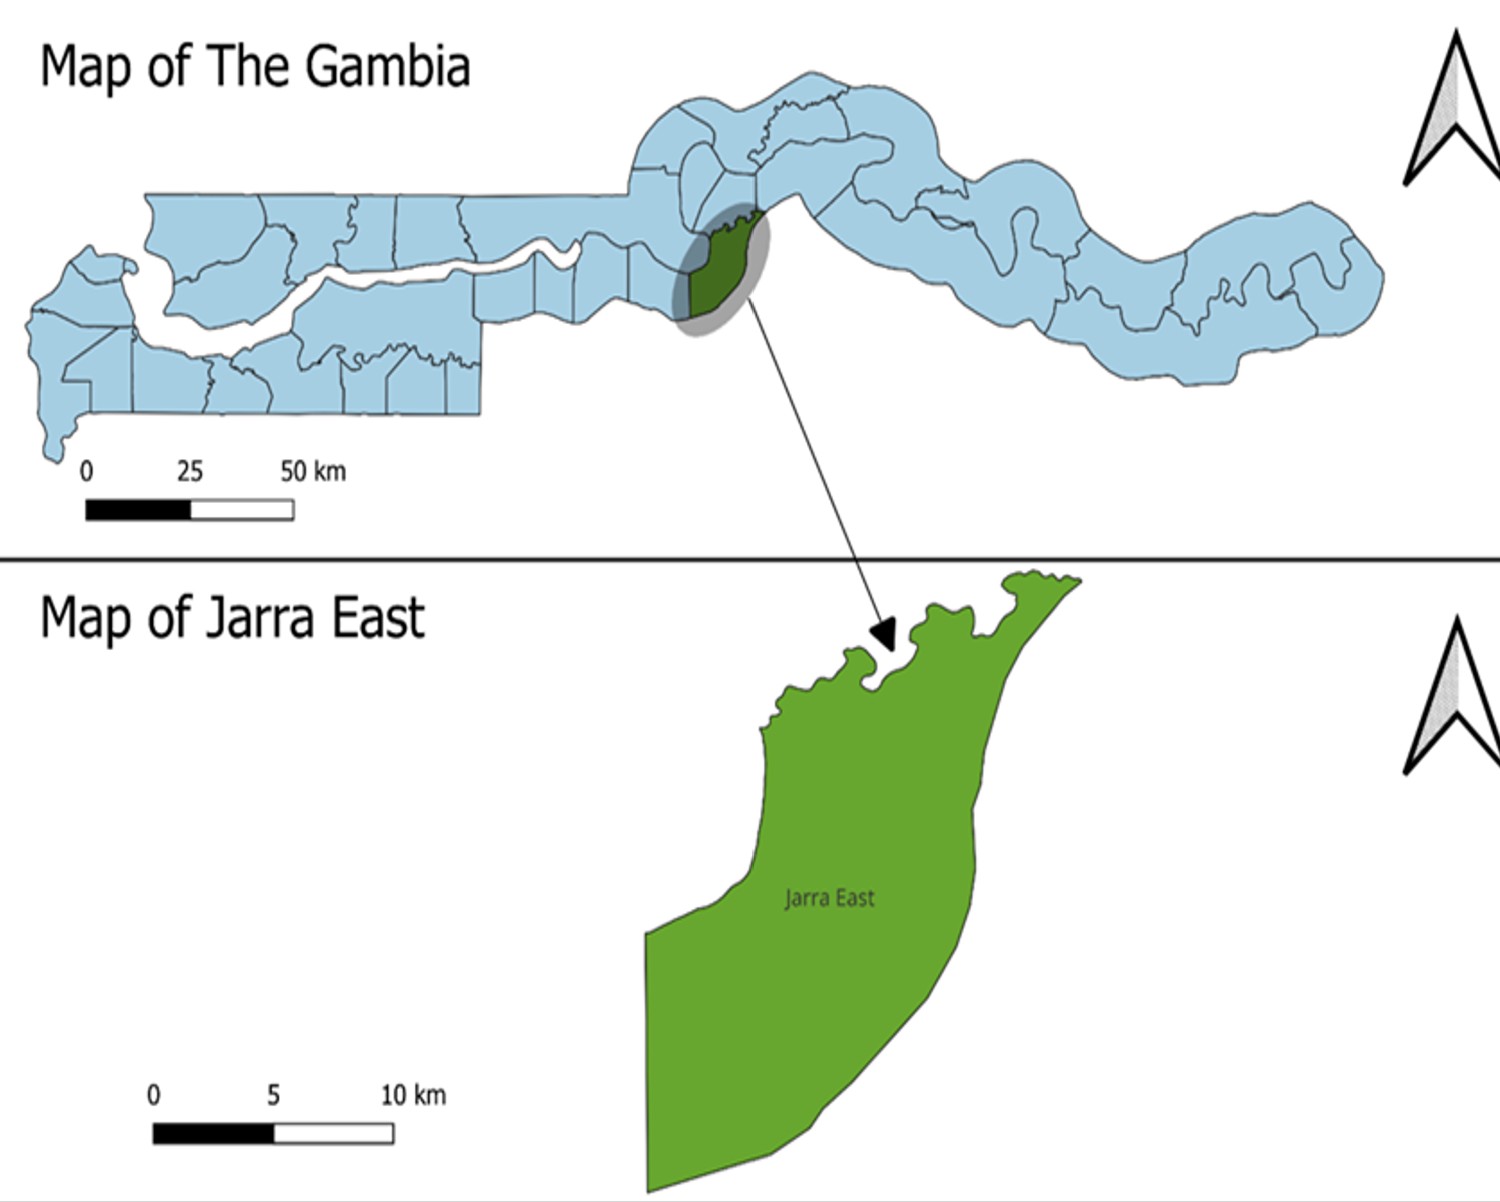
Study setting
The study was conducted in Jarra East District, one of the six health districts in the Lower River Region of The Gambia. The district comprises 28 communities, one major health centre, two minor health centres, and one community clinic. It has 21 Primary Health Care (PHC) villages and three Village Health Service (VHS) posts, with an estimated population of 18,068 and an under-five population of 2,834. Nutrition surveillance activities are conducted at Bureng Major Health Centre, Pakaliba Minor Health Centre, and three Village Health Services posts, Sutukung, Darsilameh, and Wellingaraba.
At the health facility level, patients presenting with malnutrition are assessed based on the WHO diagnostic criteria for Severe Acute Malnutrition (SAM). Those who meet the criteria are admitted into the SAM register and initiated on treatment. At the Village Health Services (VHS) posts, nutritional surveillance is conducted biannually to identify cases, which are subsequently registered and treated. Additionally, some cases are detected during routine Reproductive and Child Health (RCH) clinics and are also admitted for treatment. So, these registers at each of the facilities and Village Health Services posts were used to extract data for the study. The study area is predominantly rural, where malnutrition remains a major public health concern (Figure 1).
Study design and population
This study employed a retrospective analysis of routine surveillance data, utilising secondary data analysis of nutrition surveillance records. All records of 344 children under five years of age diagnosed with severe acute malnutrition (SAM) and registered in the Jarra East nutrition surveillance system between 2020 and 2024 were included in the study.
Study size and study variables
The study included all available SAM records between January 2020 and December 2024 from Jarra East District. Severe acute malnutrition (SAM) was classified according to the WHO diagnostic criteria: MUAC < 115 mm or WHZ < -3 standard deviations, or the presence of nutritional oedema. The outcome variable was the treatment outcome of children diagnosed with SAM, categorised as recovered or not recovered. Recovered SAM was defined as a child who met the programme discharge criteria (e.g., achieving MUAC ≥ 115 mm and/or WHZ ≥ −2 SD with no oedema for at least two consecutive visits), and not recovered SAM are either children who died during, or were lost to follow-up (defaulted), or referred to health facilities outside the catchment area for further medical care. The independent variables included sociodemographic characteristics such as age in months, gender, and place of residence, as well as health facility or circuit of treatment. Anthropometric and clinical variables included weight (kg), height/length (cm),mid-upper arm circumference (MUAC, mm), weight-for-height z-score (WHZ), and the presence of nutritional oedema. Admission-related variables included the type of admission classified as new admission (first-time enrolment into the SAM treatment programme) or readmission (child previously discharged but re-enrolled due to relapse or non-recovery), and the number of visits.
Data sources and management
Data were extracted from nutrition surveillance registers maintained at the district health facilities and Village Health Services posts. A structured Kobo Toolbox data abstraction form, designed specifically for this study, was used to extract relevant variables from existing programme data records, which included health facility or circuit, age in months, sex, place of residence, type of admission, weight in kg, height/length (cm), weight-for-height z-score (WHZ), MUAC, number of visits, and treatment outcome. The season was determined according to the Gambia weather system. Data were captured using the Kobo Collect mobile application installed on Android devices and uploaded to the Kobo Toolbox server. The dataset was subsequently exported to Microsoft Excel 2016 for data cleaning and validation before being imported into Stata version 18 for analysis. Double-entry verification was conducted during data cleaning to minimise transcription errors, and records with incomplete or inconsistent information were excluded to reduce misclassification bias.
Statistical analysis and data handling
Data were analysed using Stata version 18 and Microsoft Excel for reporting. Descriptive analyses of sociodemographic, anthropometric, and clinical characteristics were summarised using means, standard deviations, frequencies, and percentages. Geographic Information System (GIS) analysis using QGIS desktop version 3.44.1 was conducted to map the spatial distribution of SAM cases per 100 under-five population.
SAM case rates were calculated as the number of SAM cases among children aged 0–59 months in each community divided by the community’s under-five population, multiplied by 100. The resulting rates were mapped using GIS software to visualise the spatial distribution of SAM using the communities’ geo-locations. A time-series analysis of monthly SAM admissions was performed to assess temporal trends over the five-year study period. Comparative analyses were conducted to assess differences in the proportion of SAM cases admitted between the rainy season (June–October) and dry season (November–May). Each SAM case was assigned to a season according to the month of admission recorded in the surveillance registers. Annual and seasonal SAM case rates were calculated by dividing the total number of SAM cases (new and readmissions) by the estimated under-five population for the corresponding year and season and expressed per 100 children under five. To assess trends over time, yearly SAM rates were computed for the period 2020–2024 and disaggregated by season.
Comparative analysis between rainy and dry seasons was conducted using proportions and rate differences. Bivariate logistic regression analyses were performed to examine associations between potential predictors and outcome variables. A multilevel logistic regression analysis was performed to identify predictors of recovery while accounting for clustering at the health facility level. All the variables in the bivariate analyses were entered into a multilevel logistic regression model to identify independent predictors of treatment success (recovery).
Three models were fitted: the null model (Model 1), which contained no independent variables and was used to assess the presence of clustering in recovery outcomes across health facilities such as Bureng Health Centre, Darsilameh Village Health Service, Pakaliba Health Centre, Sutukung Village Health Service and Wellingaraba Village Health Service. Model 2 included individual-level variables such as age, sex, season, type of admission, MUAC, weight, height/length, oedema status, country of residence, and number of visits. Model 3 included both individual-level variables and facility-level (cluster) effects. Adjusted odds ratios (AORs) with 95% confidence intervals (CIs) were reported. Statistical significance was set at p < 0.05. Model fit was assessed using log-likelihood, Akaike Information Criterion (AIC), and Bayesian Information Criterion (BIC). The intracluster correlation coefficient (ICC) and random intercept variance were used to assess the extent of clustering at the facility level. Sensitivity analyses were conducted by excluding incomplete records and repeating regression analyses to assess the robustness of the findings.
Ethical considerations
This study was conducted as an operational research analysis utilising de-identified secondary data within the framework of the national Integrated Disease Surveillance and Response (IDSR). Formal administrative authorisation was secured from the Epidemiology and Disease Control unit of the Ministry of Health following a technical review of the study protocol. In accordance with surveillance activities guidelines, the study was classified as a routine public health program evaluation under the Field Epidemiology Training Program and was subsequently granted exemption from formal Institutional Review Board (IRB) review.
To ensure the highest standards of participant protection, all datasets were anonymised at the source; no personally identifiable information (PII) was accessed or stored by the research team. Data management protocols were implemented on encrypted servers to maintain strict confidentiality, and findings are reported in aggregate to prevent deductive identification. This study adhered to the ethical principles of the Declaration of Helsinki and complied with the Gambia National Data Protection Act.
Sociodemographic characteristics of children and the geo-spatial distribution of SAM
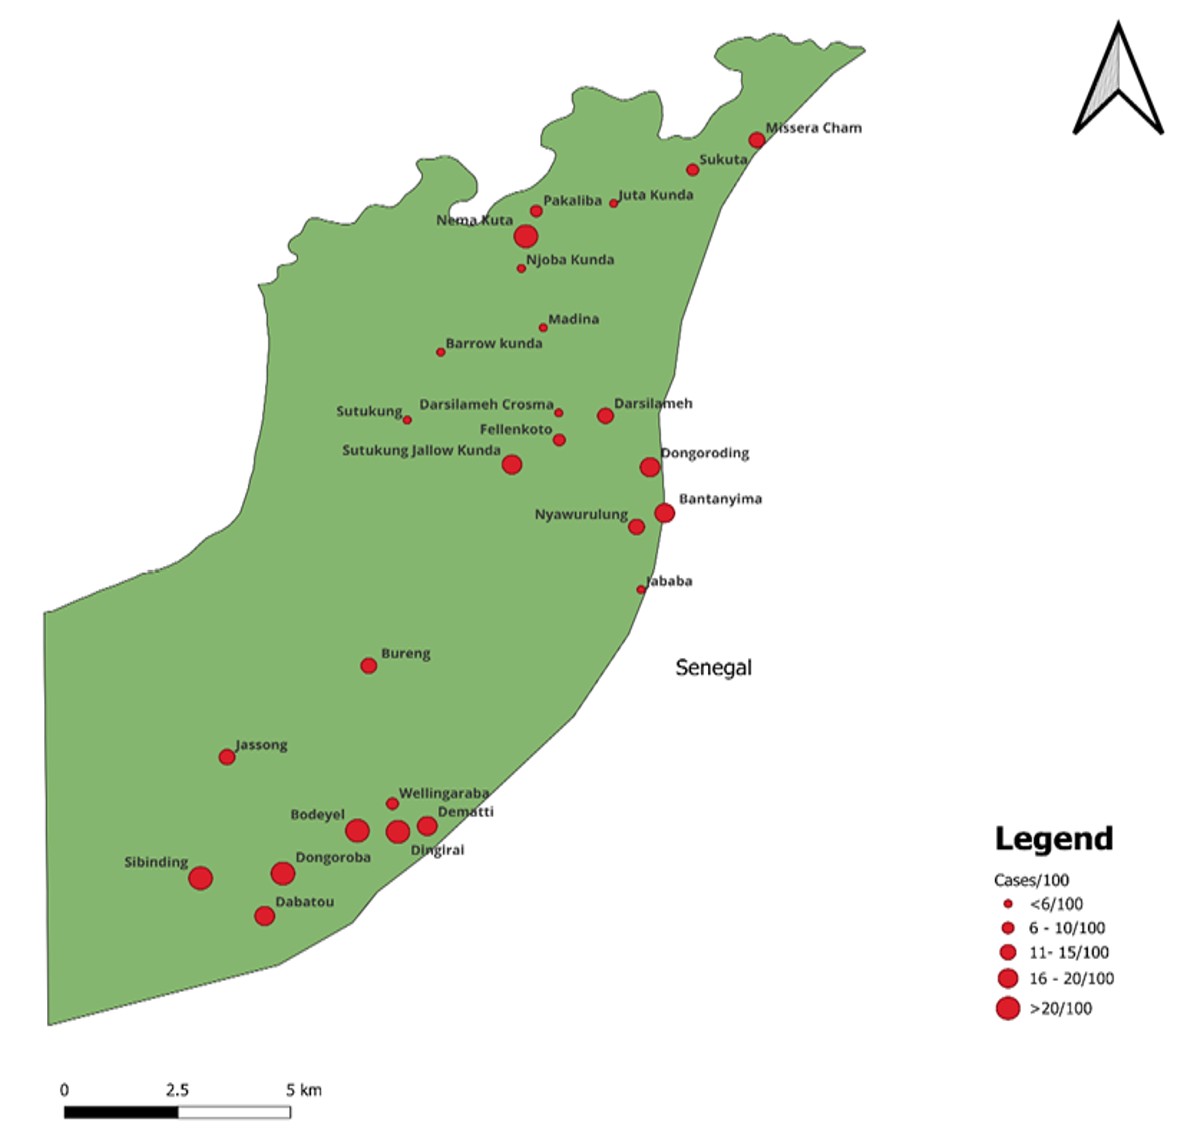
Between 2020 and 2024, a total of 344 children under the age of five with severe acute malnutrition (SAM) were registered in Jarra East District. The mean (±SD) age was 14.3 (±7.2) months. The mean (±SD) MUAC was 11.3 (±0.9) cm, the mean weight (±SD) was 6.8 (±1.3) kg, the mean (±SD) height was 72.9 (±7.5) cm, and the mean (±SD) WHZ was -3.4 ±0.6. As shown in Table 1, children aged 0–11 months accounted for the highest proportion of cases (153, 44.5%), followed by those aged 12–23 months (147, 42.7%). Females comprised 192 (55.8%) of cases, and 66 (19.2%) were cross-border referrals from Senegal. Wellingaraba Village Health Service reported the highest number of cases (160, 46.5%), followed by Bureng Health Centre (68, 19.8%), and Pakaliba Health Centre (66, 19.2%). Most children were newly admitted cases (329, 95.6%), with a mean (SD) number of visits of 5.6 (±2.5). Only 8 children (2.3%) presented with nutritional oedema. Treatment outcomes showed that 232 children (67.4%) recovered, i.e., treated successfully, 94 (27.3%) were lost to follow-up, 17 (4.94%) were referred, and 1 (0.3%) died. Bodeyel, Nema Kuta, Dingirai, and Dongoroba communities recorded the highest SAM case rates per 100 children under five, with rates of 44, 41, 27, and 26 per 100 under-five population, respectively (Figure 2).
Seasonal variations in SAM incidence and presentation
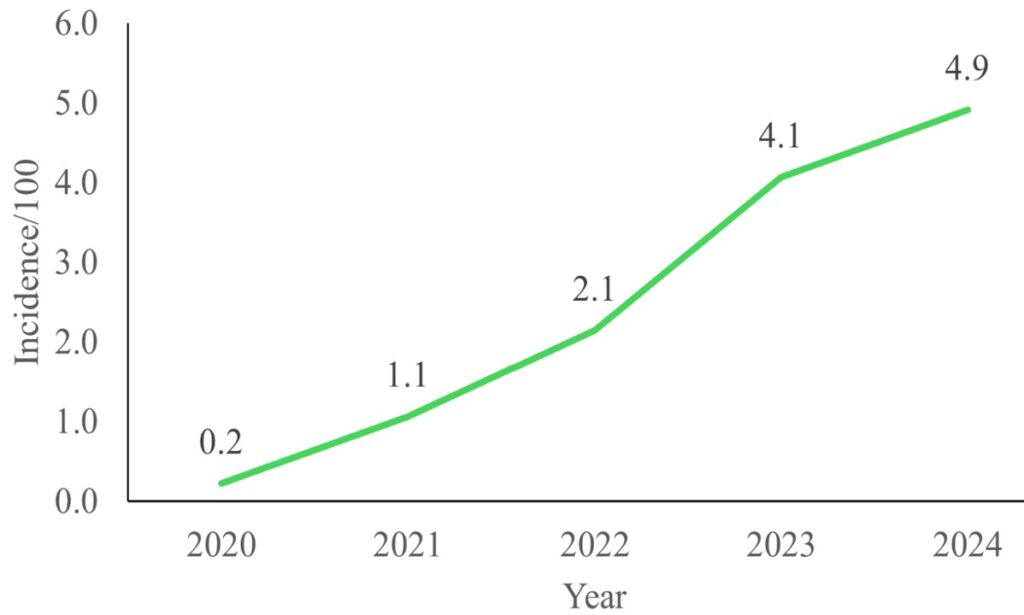
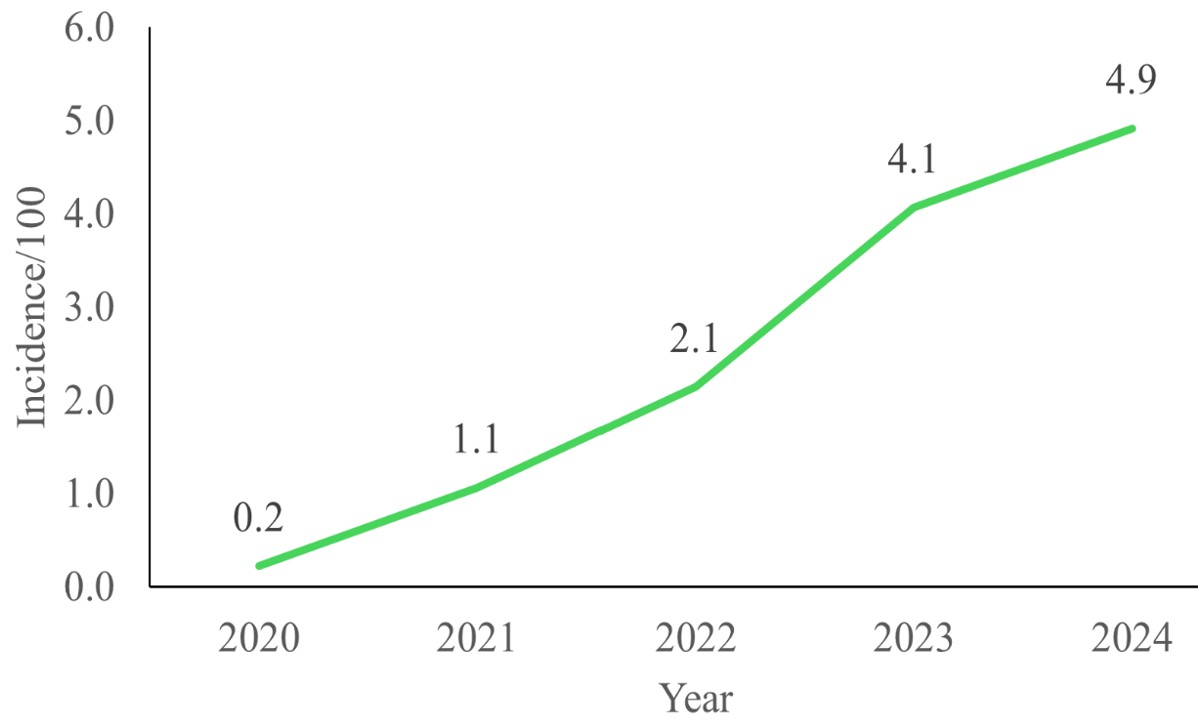
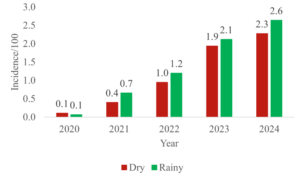
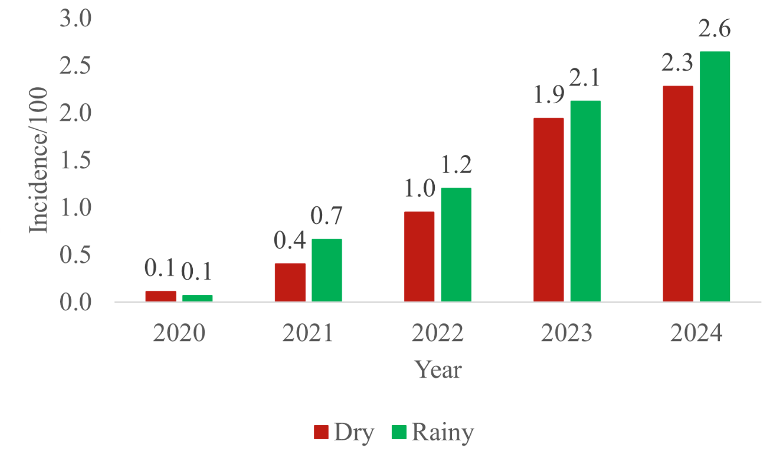
The annual SAM rate per 100 under-five population increased from 0.2 in 2020 to 4.9 in 2024 (Figure 3). A total of 186 cases (54.1%) were reported during the rainy season. SAM case rates per 100 under-five population increased steadily over the five years and were consistently higher in the rainy season compared with the dry season. In 2020, case rates were low at 0.1 per 100 under-five population in both seasons but increased markedly by 2024 to 2.3 per 100 in the dry season and 2.6 per 100 in the rainy season (Figure 4).
Determinants of SAM recovery
Several factors were significantly associated with recovery in unadjusted analyses (Table 2). Nutritional status at admission was a primary driver: children with a MUAC of 11.5–12.4 cm were significantly less likely to recover than those with a MUAC <10.0 cm (OR=0.16, 95% CI: 0.04–0.61). However, this finding should be interpreted cautiously due to the small subgroup size and the possibility of residual confounding. Re-admission and the presence of oedema were also significant negative predictors of recovery (OR=0.23 and OR=0.15, respectively). Geography played a role, with children from Senegal exhibiting lower odds of recovery than their counterparts in The Gambia (OR=0.50, 95% CI: 0.29–0.87). Notably, frequency of facility visits was a strong positive predictor; children with fewer than three visits had markedly lower odds of recovery (OR=0.14, 95% CI: 0.07–0.28).
Multilevel analysis of facility-level variability
The multilevel analysis confirmed substantial clustering of recovery outcomes within health facilities (ICC=0.377 in the null model) (Table 3). In the fully adjusted model (Model 3), visit frequency emerged as the most consistent independent predictor of recovery. After accounting for both individual and facility-level factors, children attending 3–5 visits were three times more likely to recover than those attending fewer than three (AOR=3.19, 95% CI: 1.26–8.06). While individual factors such as MUAC appeared significant in Model 2, these associations lost statistical significance after adjustment for facility-level clustering in the fully adjusted model, suggesting that differences in facility-level service delivery may partly explain variations in recovery outcomes. The final ICC of 0.414 confirms that a significant proportion of the variance in recovery is attributable to the facility level rather than individual characteristics alone.
This study provides a comprehensive longitudinal analysis of the epidemiological distribution, seasonal dynamics, and determinants of recovery for severe acute malnutrition (SAM) in the Jarra East District of The Gambia. Our findings indicate a temporal escalation in reported SAM cases, peaking in 2024. This trend likely reflects a synergistic effect of worsening regional food insecurity and the enhanced diagnostic sensitivity of community-based nutritional surveillance systems [8, 14]. Similar escalations in SAM prevalence have been documented across West and East Africa, where socioeconomic volatility and environmental shocks continue to destabilise local food systems [12,15].
The concentration of SAM among children aged 6.0–23.0 months highlights a critical “vulnerability window” associated with the transition from exclusive breastfeeding to complementary feeding. This developmental period is characterised by high metabolic demands and increased exposure to enteric pathogens, necessitating meticulous caregiver adherence to optimal young child feeding (IYCF) practices [16, 17]. Several studies have also noted that this age group is most at risk, primarily due to poor complementary feeding practices and higher exposure to infections [1,5,12]. Conversely, some research indicates higher malnutrition rates in older children (24-59 months), often associated with long-term food insecurity and persistent nutritional deficits [6, 16]. This variation may be specific to The Gambia, where inadequate feeding practices and frequent childhood illnesses mainly impact children in the 6-23 months age range. Additionally, community-based screening might lead to earlier detection in younger children, resulting in greater representation of younger children in the data [2, 8]. While gender was not a significant predictor of treatment outcomes, aligning with broader West African literature [11, 8], the data revealed that readmitted children faced significantly lower odds of recovery, consistent with studies showing that relapse cases often experience poorer outcomes due to persistent malnutrition, comorbidities, and interruptions in care[18]. In contrast, some evidence suggests no difference in outcomes when treatment and follow-up are optimal [14, 19]. This difference may reflect contextual challenges in The Gambia, where food insecurity and poor treatment adherence can lead to repeated cycles of malnutrition, reducing recovery among readmitted children [2, 8]. This suggests that repeated episodes of malnutrition may be a marker for underlying chronic comorbidities, healthcare system gaps (e.g., inadequate follow-up or continuity of care), or profound household-level barriers to treatment adherence.
Geospatial analysis identified specific community hotspots, including Bodeyel and Nema Kuta, reflecting deep-seated socioeconomic disparities. The Lower River Region remains one of The Gambia’s most impoverished areas, with 64.5% of the population living below the poverty line [20]. In Jarra East, this structural poverty is compounded by low maternal education and a reliance on subsistence farming, creating a precarious environment where seasonal lean periods rapidly translate into clinical SAM [1, 2].
Furthermore, the significantly lower recovery rates among cross-border populations from Senegal highlight a critical “transboundary health gap.” The lower recovery observed among cross-border populations may reflect challenges related to continuity of care, follow-up, healthcare access, and treatment adherence; however, these factors were not directly assessed in this study and should therefore be interpreted cautiously [21]. These barriers may lead to treatment interruption and repeated cycles of malnutrition. Addressing these challenges requires strengthening community-based follow-up through active defaulter tracing, improving caregiver education on treatment adherence, and enhancing access to services through outreach programs. Additionally, integrating nutrition services with other child health interventions and improving coordination within the health system could support continuity of care and reduce re-admissions.
A pivotal finding of this study is that the recovery rate (67.4%) fell below the 75% minimum standard recommended by the Sphere guidelines [19]. Similar recovery rates below Sphere standards have been reported in studies from Ethiopia, Nigeria, and Cameroon, where high default rates and weak continuity of care were major contributors to poor treatment outcomes. However, some CMAM programmes in other African settings have achieved recovery rates above Sphere standards, particularly in contexts with stronger community follow-up systems and improved caregiver support mechanisms. These differences may reflect variations in health system performance, programme implementation quality, and socioeconomic conditions [22, 23, 24]. In addition, the high default rate (27.3%) is of particular concern, as it indicates substantial loss to follow-up during treatment. This may be attributed to indirect barriers to care, including long travel distances to health facilities, caregiver fatigue, and the opportunity costs associated with missed work or household responsibilities[14]. Although mortality among children who completed treatment was low, this finding should be interpreted with caution. The high default rate may conceal unreported deaths (“hidden mortality”) among children who failed to return for follow-up, particularly those in more vulnerable conditions[24, 25].
Our multilevel analysis highlights the importance of both individual and facility-level factors in influencing recovery among children treated for acute malnutrition. At the individual level, admission status, MUAC, and, in particular, the number of follow-up visits were key determinants of recovery. Re-admitted children showed poorer recovery outcomes, which may reflect relapse, delayed care-seeking, or incomplete nutritional rehabilitation during previous treatment episodes. Similar patterns of relapse and poor outcomes among previously treated children have been reported in CMAM and community nutrition programmes, where repeated episodes of malnutrition are linked to underlying household vulnerability and gaps in sustained recovery [7, 15]. This highlights the importance of strengthening post-discharge monitoring to prevent recurrence. The finding related to MUAC should be interpreted cautiously. Although MUAC is a well-established predictor of recovery and mortality in acute malnutrition, the observed association between relatively higher MUAC categories and lower recovery may reflect programmatic or methodological factors rather than a direct clinical relationship. Possible explanations include small subgroup sizes, residual confounding, inconsistent follow-up, or early discharge practices among children with borderline anthropometric measurements.
Furthermore, the association was no longer statistically significant after adjustment for facility-level clustering in the final multilevel model, suggesting that facility-level factors may partly explain the observed relationship [7, 10, 18, 25]. This may reflect programmatic challenges in correctly identifying recovery readiness and ensuring sufficient treatment duration for borderline cases. The strong positive association between follow-up visits and recovery is consistent with evidence from CMAM programmes emphasizing continuity of care as a key determinant of treatment success. Regular follow-up improves clinical monitoring, early detection of complications, and reinforcement of caregiver adherence, all of which contribute to improved outcomes [10, 11, 18]. Similarly, the WHO (2013) guidelines and Sphere Association (2018) standards emphasize structured follow-up as a core component of effective management of acute malnutrition. However, contrasting findings exist where follow-up frequency was not a strong predictor of recovery, with some studies instead identifying baseline severity and anthropometric status as stronger determinants [7]. Variations in health system performance, caregiver adherence, and access to services may explain these differences. In this study context, barriers such as distance to health facilities, indirect costs, and competing household responsibilities may limit consistent attendance, as also highlighted in nutrition and food security studies in The Gambia and similar settings [2, 8]. This underscores the need to strengthen community-based follow-up and retention strategies.
After adjusting for both individual and facility-level factors, follow-up visits remained the most consistent predictor of recovery, reinforcing the importance of treatment continuity. Although the strength of association was reduced in the fully adjusted model, the relationship remained significant, indicating robustness across different analytical levels. This aligns with findings from CMAM programme evaluations that emphasise sustained engagement in treatment as essential for nutritional recovery[10, 18, 19]. The study also revealed substantial variation in recovery outcomes across health facilities, suggesting that facility-level factors significantly influence treatment success. This indicates differences in quality of care, availability of therapeutic supplies, staffing levels, and adherence to CMAM protocols across facilities. Similar findings have been reported in evaluations of malnutrition management systems, where implementation capacity and health system readiness were major determinants of outcome variability [11, 16]. This highlights the need for stronger health system support, including standardized protocols, supervision, and equitable resource distribution to ensure uniform quality of care. Several demographic and clinical variables, including age, sex, season, oedema, weight, and height, were not significantly associated with recovery. This suggests that once children are enrolled in a structured CMAM programme, recovery is more strongly influenced by programmatic and service delivery factors than baseline demographic characteristics. Although seasonal variation in malnutrition prevalence has been widely documented [3, 9], its influence on recovery outcomes may be reduced in the presence of continuous therapeutic interventions and standardised treatment protocols [25].
A key implication of this study is that continuity of care, reflected through follow-up visits, is the most consistent determinant of recovery. This underscores the need to strengthen adherence systems through caregiver counselling, community health worker follow-up, and defaulter tracing mechanisms. Additionally, the observed variation between health facilities highlights the importance of improving health system performance to ensure equitable service delivery. From a paediatric practice perspective, these findings emphasise that improving recovery from acute malnutrition requires not only appropriate clinical management but also strong programme implementation systems that ensure consistent follow-up and standardized care across all facilities [19, 25].
Seasonal variation was strongly associated with increased SAM cases, with cases peaking during the rainy season. This “hunger season” periodicity, also observed in Ethiopia and elsewhere in The Gambia, is driven by the depletion of household grain reserves, rising market prices, and a simultaneous surge in malaria and diarrheal diseases [3, 9]. Children admitted in the dry season showed slightly higher recovery, but the difference was not statistically significant, indicating the season likely has minimal impact on recovery. Some studies in Africa show that the season has little effect on recovery from severe acute malnutrition [9, 18], while others report lower recovery during rainy or lean periods due to food shortages or infections [1,5]. In Jarra East District, recovery may be less affected by season because SAM programs are consistently delivered, and infections are well managed year-round.
Strengths and limitations
The primary strength of this study lies in its five-year longitudinal dataset, which enabled a robust analysis of spatiotemporal trends and determinants of recovery. However, several limitations must be acknowledged. The secondary nature of the surveillance data meant that key confounding variables, including maternal nutritional status, household income, and WASH (water, sanitation, and hygiene) indicators, were not available for analysis. In the analysis, treatment results like default, death, and referral were combined into a single “not recovered” category. While this method simplifies the modelling process, it might have hidden important differences among these outcomes. Additionally, some subgroup analyses produced wide confidence intervals, likely due to small sample sizes within certain categories, which may reduce the precision and stability of some estimates. Each outcome has its own clinical and programmatic implications. Furthermore, the outcomes of children who defaulted remain unknown, potentially introducing bias into the mortality and recovery estimates.
The determinants of SAM recovery in Jarra East are multifactorial, spanning individual clinical indicators and broad socioeconomic structures. To improve program performance, we recommend strengthening follow-up mechanisms by implementing community-based “defaulter tracing” to ensure children complete the requisite number of visits. Establishing a cross-border coordination with effective and formal health data exchange and nutrition referral pathways between The Gambia and Senegal could be a game-changer in successful intervention. While cross-border health system challenges may play a role in treatment interruption, this study did not directly assess these factors; as such, the recommendation for cross-border coordination should be considered tentative and requires further investigation. Finally, seasonal scaling and pre-positioning Ready-to-Use Therapeutic Food (RUTF) and intensifying screening during the rainy season to mitigate “hunger season” spikes in SAM cases should be incorporated in the targeted intervention implementation.
What is already known about the topic
What this study adds
The authors did not receive any specific funding for this work.
List of abbreviations
AOR: Adjusted Odds Ratio
CI: Confidence Interval
COR: Crude odds ratios
CMAM: Community Management of Acute Malnutrition
GNSP: Gambia Nutrition Surveillance Programme
GIS: Geographic Information System
LRR: Lower River Region
MUAC: Mid-Upper Arm Circumference
RUTF: Ready-To-Use Therapeutic Foods
SAM: Severe Acute Malnutrition
SD: Standard Deviation
WASH: Water Hygiene and Sanitation
| Variable | Frequency (n) | Percentage (%) |
|---|---|---|
| Age (months) | ||
| 0 – 11 | 153 | 44.5 |
| 12 – 23 | 147 | 42.7 |
| ≥ 24 | 44 | 12.8 |
| Gender | ||
| Male | 152 | 44.2 |
| Female | 192 | 55.8 |
| Type of admission | ||
| New admission | 329 | 95.6 |
| Re-admission | 15 | 4.4 |
| Country | ||
| Gambia | 278 | 80.8 |
| Senegal | 66 | 19.2 |
| Facility | ||
| Bureng Health Center | 68 | 19.8 |
| Darsilameh Village Health Service | 33 | 9.6 |
| Pakaliba Health Centre | 66 | 19.2 |
| Sutukung Village Health Service | 17 | 4.9 |
| Wellingaraba Village Health Service | 160 | 46.5 |
| Season | ||
| Dry | 158 | 45.9 |
| Rainy | 186 | 54.0 |
| Outcome | ||
| Died | 1 | 0.3 |
| Lost to follow up | 94 | 27.3 |
| Referred | 17 | 4.9 |
| Recovered | 232 | 67.4 |
| Year | ||
| 2020 | 5 | 1.5 |
| 2021 | 29 | 8.4 |
| 2022 | 59 | 17.2 |
| 2023 | 113 | 32.9 |
| 2024 | 138 | 40.1 |
| Circuit | ||
| Wellingaraba Circuit | 175 | 50.9 |
| Other Areas | 94 | 27.3 |
| Darsilameh Circuit | 51 | 14.8 |
| Sutukung Circuit | 24 | 7.0 |
| Predictors of recovery | OR | 95% CI | p-value |
|---|---|---|---|
| Age (months) | |||
| 0–11 (Ref) | 1.00 | – | – |
| 12–23 | 1.00 | 0.62 – 1.63 | 0.992 |
| ≥ 24 | 0.83 | 0.41 – 1.66 | 0.590 |
| Gender | |||
| Female (Ref) | 1.00 | – | – |
| Male | 1.08 | 0.69 – 1.71 | 0.730 |
| Season | |||
| Rainy (Ref) | 1.00 | – | – |
| Dry | 1.27 | 0.81 – 2.00 | 0.305 |
| Type of admission | |||
| New admission (Ref) | 1.00 | – | – |
| Re-admission | 0.23 | 0.07 – 0.67 | 0.008 |
| MUAC (cm) | |||
| < 10.0 (Ref) | 1.00 | – | – |
| 10.0–11.4 | 0.28 | 0.22 – 2.79 | 0.756 |
| 11.5–12.4 | 0.16 | 0.04 – 0.61 | 0.007 |
| 12.5–13.4 | 0.23 | 0.05 – 1.01 | 0.051 |
| > 13.4 | 0.23 | 0.02 – 2.37 | 0.217 |
| Weight (kg) | |||
| ≥ 10 (Ref) | 1.00 | – | – |
| 7.0–9.9 | 0.87 | 0.16 – 4.66 | 0.874 |
| 5.0–6.9 | 0.82 | 0.15 – 4.34 | 0.811 |
| < 5.0 | 0.62 | 0.10 – 3.92 | 0.614 |
| Height/Length (cm) | |||
| ≥ 85 (Ref) | 1.00 | – | – |
| 75–84.9 | 0.11 | 0.01 – 0.82 | 0.031 |
| 65–74.9 | 0.10 | 0.01 – 0.76 | 0.026 |
| < 65 | 0.10 | 0.01 – 0.81 | 0.031 |
| Oedema | |||
| Nil (Ref) | 1.00 | – | – |
| Present | 0.15 | 0.03 – 0.77 | 0.023 |
| Country of residence | |||
| Gambia (Ref) | 1.00 | – | – |
| Senegal | 0.50 | 0.29 – 0.87 | 0.014 |
| Number of visits | |||
| ≥ 5 (Ref) | 1.00 | – | – |
| 3–5 | 0.65 | 0.38 – 1.11 | 0.112 |
| < 3 | 0.14 | 0.07 – 0.28 | < 0.001 |
| Bold indicates significant association at p < 0.05. 1.00 = reference group; n = frequency; OR = odds ratio; CI = confidence interval. | |||
| Predictors of recovery | Null Model [p-value (95% CI)] | Model 2 Adjusted OR (95% CI) p-value | Model 3 Adjusted OR (95% CI) p-value |
|---|---|---|---|
| Age group (months) | |||
| 0–11 (Ref) | – | 1.00 | 1.00 |
| 12–23 | – | 1.24 (0.63–2.44) 0.54 | 1.32 (0.60–2.92) 0.48 |
| ≥ 24 | – | 1.15 (0.44–2.97) 0.78 | 2.12 (0.70–6.44) 0.18 |
| Gender | |||
| Female (Ref) | – | 1.00 | 1.00 |
| Male | – | 0.97 (0.57–1.68) 0.94 | 1.39 (0.74–2.64) 0.31 |
| Season | |||
| Dry (Ref) | – | 1.00 | 1.00 |
| Rainy | – | 0.91 (0.53–1.57) 0.73 | 1.02 (0.54–1.91) 0.96 |
| Type of admission | |||
| New admission (Ref) | – | 1.00 | 1.00 |
| Re-admission | – | 0.20 (0.06–0.75) 0.02* | 0.47 (0.12–1.86) 0.28 |
| MUAC (cm) | |||
| < 10.0 (Ref) | – | 1.00 | 1.00 |
| 10.0–11.4 | – | 0.49 (0.10–2.32) 0.37 | 0.78 (0.10–6.04) 0.91 |
| 11.5–12.4 | – | 0.10 (0.02–0.50) 0.01* | 0.98 (0.10–9.55) 0.99 |
| 12.5–13.4 | – | 0.18 (0.30–1.12) 0.07 | 1.32 (0.12–17.66) 0.82 |
| > 13.4 | – | 0.13 (0.01–1.83) 0.13 | 0.68 (0.03–17.66) 0.82 |
| Weight (kg) | |||
| ≥ 10 (Ref) | – | 1.00 | 1.00 |
| 7.0–9.9 | – | 0.28 (0.22–3.51) 0.32 | 0.32 (0.02–6.15) 0.45 |
| 5.0–6.9 | – | 0.83 (0.39–1.78) 0.63 | 1.16 (0.49–2.74) 0.74 |
| < 5.0 | – | 0.28 (0.05–1.49) 0.13 | 0.35 (0.04–3.28) 0.36 |
| Height/Length (cm) | |||
| < 65 (Ref) | – | 1.00 | 1.00 |
| 65–74.9 | – | 1.62 (0.32–1.18) 0.15 | 0.95 (0.18–5.09) 0.96 |
| 75–84.9 | – | 0.92 (0.21–3.94) 0.91 | 0.74 (0.12–4.72) 0.75 |
| ≥ 85 | – | 4.93 (0.30–81.19) 0.27 | 1.97 (0.10–37.07) 0.65 |
| Oedema | |||
| Nil (Ref) | – | 1.00 | 1.00 |
| Present | – | 0.28 (0.05–1.66) 0.16 | 0.88 (0.13–5.99) 0.89 |
| Country of residence | |||
| Gambia (Ref) | – | 1.00 | 1.00 |
| Senegal | – | 0.62 (0.32–1.18) 0.15 | 1.37 (0.61–3.08) 0.45 |
| Number of visits | |||
| < 3 (Ref) | – | 1.00 | 1.00 |
| 3–5 | – | 5.01 (2.24–11.23) 0.001* | 3.19 (1.26–8.06) 0.01* |
| ≥ 5 | – | 5.96 (2.80–12.71) 0.001* | 2.29 (0.93–5.68) 0.07 |
| Model Comparison | |||
| Log likelihood | −152.159 | −171.784 | −143.178 |
| AIC | 308.318 | 383.568 | 328.355 |
| BIC | 315.999 | 460.323 | 408.948 |
| ICC | 0.377 (95% CI: 0.140–0.691) | – | 0.414 (95% CI: 0.152–0.736) |
| Random intercept variance | 1.989 | – | 2.327 |
| OR = odds ratio; CI = confidence interval; ICC = intracluster correlation coefficient; AIC = Akaike Information Criterion; BIC = Bayesian Information Criterion. Null model checks if clustering matters (are outcomes different across facilities?). Model 2 includes all individual-level predictors (Adjusted ORs). Model 3 adds standardised cluster-level (health facility) random effects. * p < 0.05. | |||