Research | Open Access | Volume 9 (2): Article 109 | Published: 30 June 2026

Views: 22
Menu, Tables and Figures
Table 1: Health facilities under study
| Health Facility | District/Region |
|---|---|
| Kanawata | Kotido (Karamoja) |
| Rengen | Kotido (Karamoja) |
| Mirembe | Wakiso (Central) |
| Nadangira | Wakiso (Central) |
| Juru | Yumbe (West Nile) |
| Nakivale | Isingiro (Western) |
| Yoyo | Arua (West Nile) |
| Barakala | Arua (West Nile) |
Table 1: Health facilities under study
| Table 2: Sensitivity analysis: comparison of district-month and facility-month environmental effect estimates | ||||||
|---|---|---|---|---|---|---|
| Exposure | Primary Analysis District-Month Level (n = 1,343 observations) | Sensitivity Analysis Facility-Month Level (n = 864 observations) | ||||
| IRR | 95% CI | P | IRR | 95% CI | P | |
| NDVI (per 0.1 units) | 1.18 | 1.13–1.23 | <0.001 | 1.16 | 1.05–1.28 | 0.004 |
| LULC Urban (per 10%) | 0.92 | 0.87–0.97 | <0.001 | 0.94 | 0.82–1.08 | 0.382 |
| Temperature (per 1°C) | 1.08 | 1.04–1.12 | <0.001 | 1.07 | 0.98–1.17 | 0.143 |
Table 2: Sensitivity analysis: comparison of district-month and facility-month environmental effect estimates
| Table 3: Variables, measurement methods, data sources, units, and spatial resolution | ||||
|---|---|---|---|---|
| Variable | Measurement Method | Data Source | Units of Measurement | Spatial Resolution |
| Dependent Variable | ||||
| Malaria cases | Confirmed malaria cases among children 0–5 years per health facility | Local Health Centers | Confirmed cases among children 0–5 years | – |
| Independent Variables | ||||
| Vegetation Cover | Derived from satellite reflectance (NIR and RED bands) | MODIS | NDVI (-1 to +1) | 250 m |
| Rainfall | Measured via satellite-based precipitation estimates and ground stations | CHIRPS, Weather Stations | mm per month | 0.05° |
| Land Use and Land Cover | Classified into eight classes: trees, shrubs, agriculture, wetlands, built-up areas | Sentinel-2 multispectral imagery (processed in Google Earth Engine) | Proportion (%) of each category per facility | 10 m |
| Temperature | Measured via satellite or ground-based meteorological stations | ERA5, Weather Stations | °C (minimum and maximum) | 0.1° / 9 km |
Table 3: Summary of Variables and their measurements
| Table 4: Correlation Results | |||||
|---|---|---|---|---|---|
| Variable | Malaria Cases | Total Rainfall Amounts | Minimum Temperature | Maximum Temperature | Vegetation Cover |
| Malaria Cases | 1.000 | ||||
| Total Rainfall Amounts | 0.080*** | 1.000 | |||
| Minimum Temperature | 0.194*** | 0.328*** | 1.000 | ||
| Maximum Temperature | 0.175*** | 0.019*** | 0.702*** | 1.000 | |
| Vegetation Cover | 0.048*** | 0.355*** | 0.217*** | 0.130*** | 1.000 |
Note: *** p<0.001.
Table 4: Correlation Results
| Table 5: Model Diagnostics – Fixed Effects vs Random Effects | ||||||
|---|---|---|---|---|---|---|
| Diagnostic | Fixed-Effects | Random-Effects | ||||
| Log Likelihood | -5852.0 | -5902.6 | ||||
| AIC | 11740.0 | 11819.2 | ||||
| BIC | 11832.3 | 11855.1 | ||||
| Theta (dispersion) | 6.9716 | 0.0211 | ||||
| Alpha (overdispersion) | 0.1434 | 47.4238 | ||||
| Overdispersed? | Yes | Yes | ||||
| Residual Mean | 0.0017 | 0.0014 | ||||
| Residual Variance | 1.1010 | 1.0885 | ||||
| Residual Skewness | 1.3374 | 1.3345 | ||||
| Residual Kurtosis | 3.4370 | 3.4273 | ||||
| Note: Overdispersion (alpha > 0) confirms that the Negative Binomial model is appropriate. Residuals should be approximately normally distributed to support model adequacy. | ||||||
| Table 6: Relationship between vegetation density and Malaria cases | ||||||
|---|---|---|---|---|---|---|
| Malaria Cases | Coef. | St. Err. | t-value | p-value | 95% Confidence Interval | Sig. |
| NDVI | 0.38635 | 0.0240 | 16.0900 | 0.0000 | 0.3393 – 0.4334 | *** |
| Constant | -0.0696 | 0.0138 | -5.0400 | 0.0000 | -0.0966 – -0.0424 | *** |
| ln(alpha) | -0.0293 | 0.3446 | -0.7050 – 0.6463 | |||
| ln(s) | 3.3455 | 0.4406 | 2.4820 – 4.2091 | ** | ||
| Mean dependent var | 85.850 | SD dependent var | 135.895 | |||
| Number of obs | 44,624 | Chi-square | 258.975 | |||
| Prob > chi² | 0.000 | Akaike crit. (AIC) | 454291.604 | |||
| Note: *** p<0.01, ** p<0.05, * p<0.10. | ||||||
Table 6: Relationship between vegetation density and Malaria cases
| Table 7: Summary of Hot and Cold Spots by Region | |||
|---|---|---|---|
| Region | Hotspot Characteristics | Cold Spot Characteristics | Interpretation |
| Wakiso | Dense vegetation, wetlands, lakeshore proximity (Lake Victoria) | Built-up urban areas, low vegetation, distant from water bodies | Strong clustering driven by vegetation and hydrology |
| West Nile | Woodland/grassland near rivers and seasonal wetlands | Sparse vegetation, drier areas, far from major water sources | Moderate clustering influenced by seasonal water availability |
| Central (Other Districts) | Mixed vegetation, peri-urban wetlands, agricultural zones | Urbanized areas with infrastructure and drainage systems | Mixed clustering influenced by both environment and urbanization |
| Eastern Region | Irrigated farmland, wetlands, and flood-prone areas | Elevated or drier zones with less vegetation | Clustering linked to irrigation and flood dynamics |
| Northern Region | Bushland and seasonal water bodies | Arid/semi-arid zones with minimal vegetation | Weaker clustering due to limited stable breeding sites |
Table 7: Summary of Hot and Cold Spots by Region

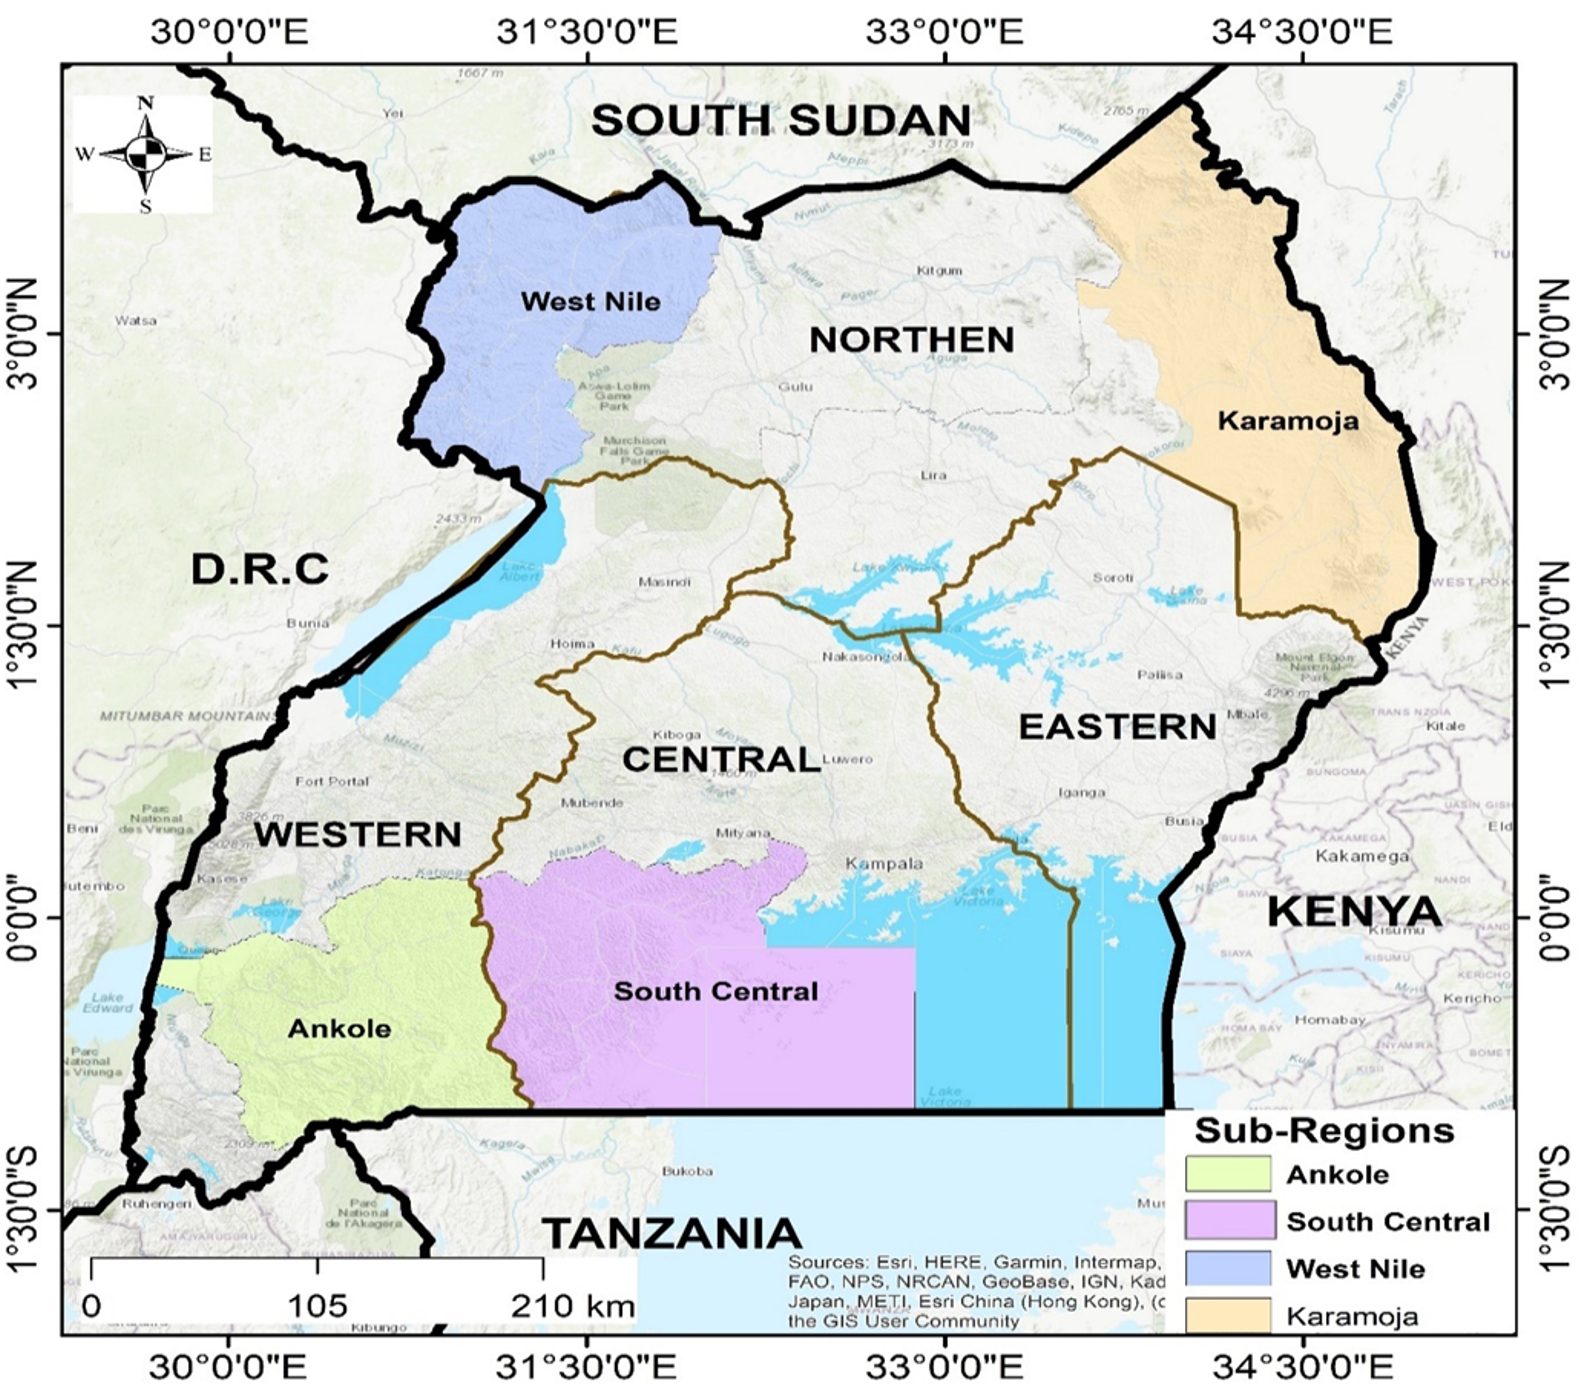
Figure 1: Regions of study

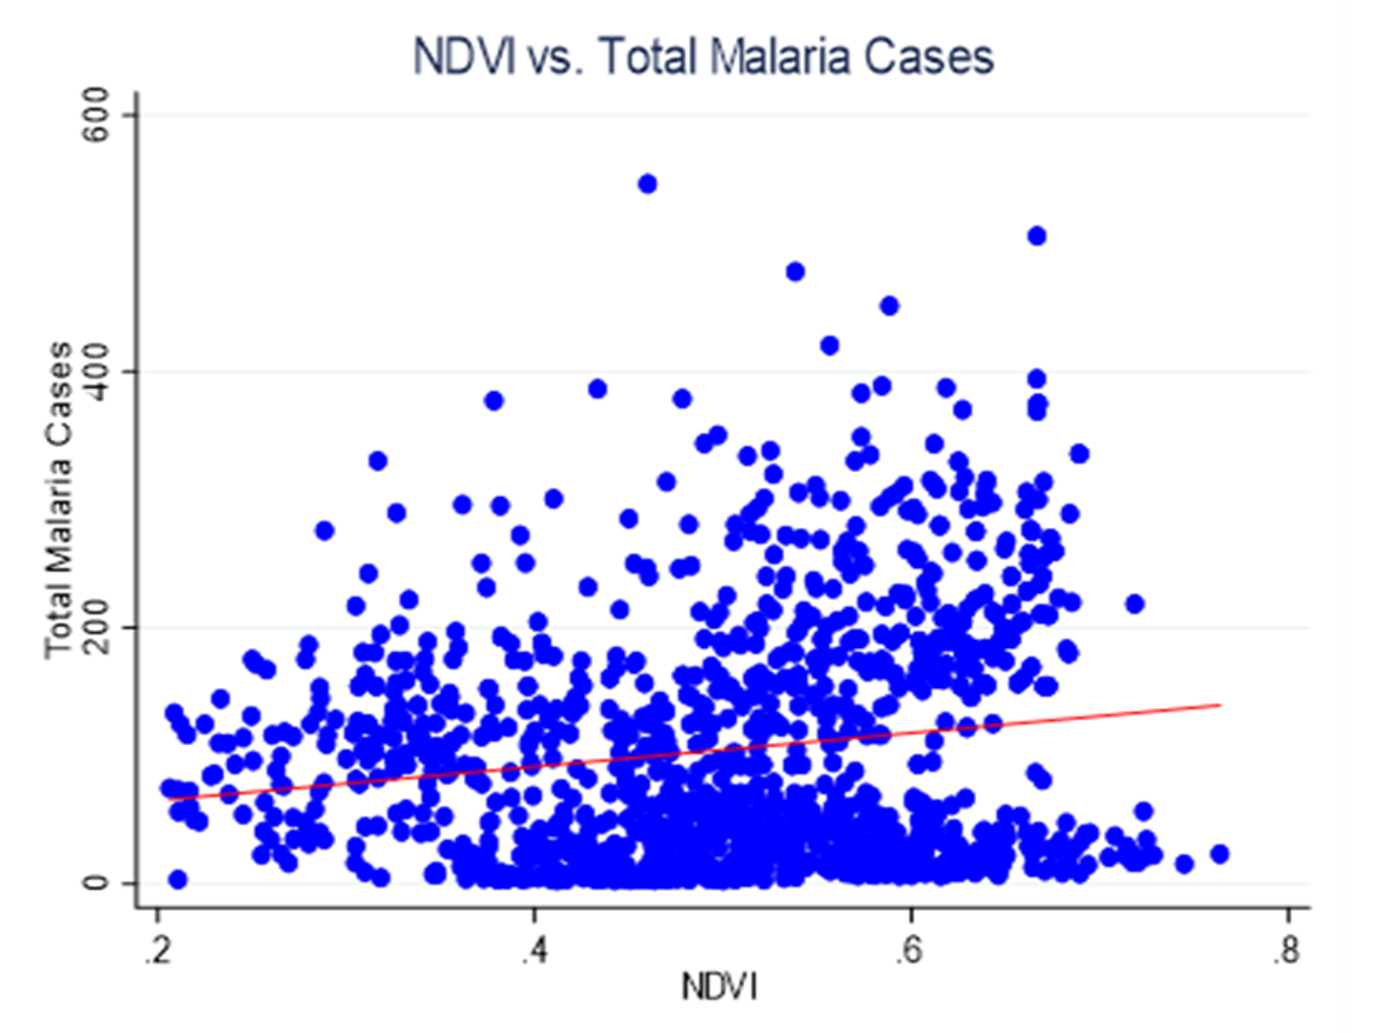
Figure 2: Scatter plot depicting the relationship NDVI and total Malaria cases

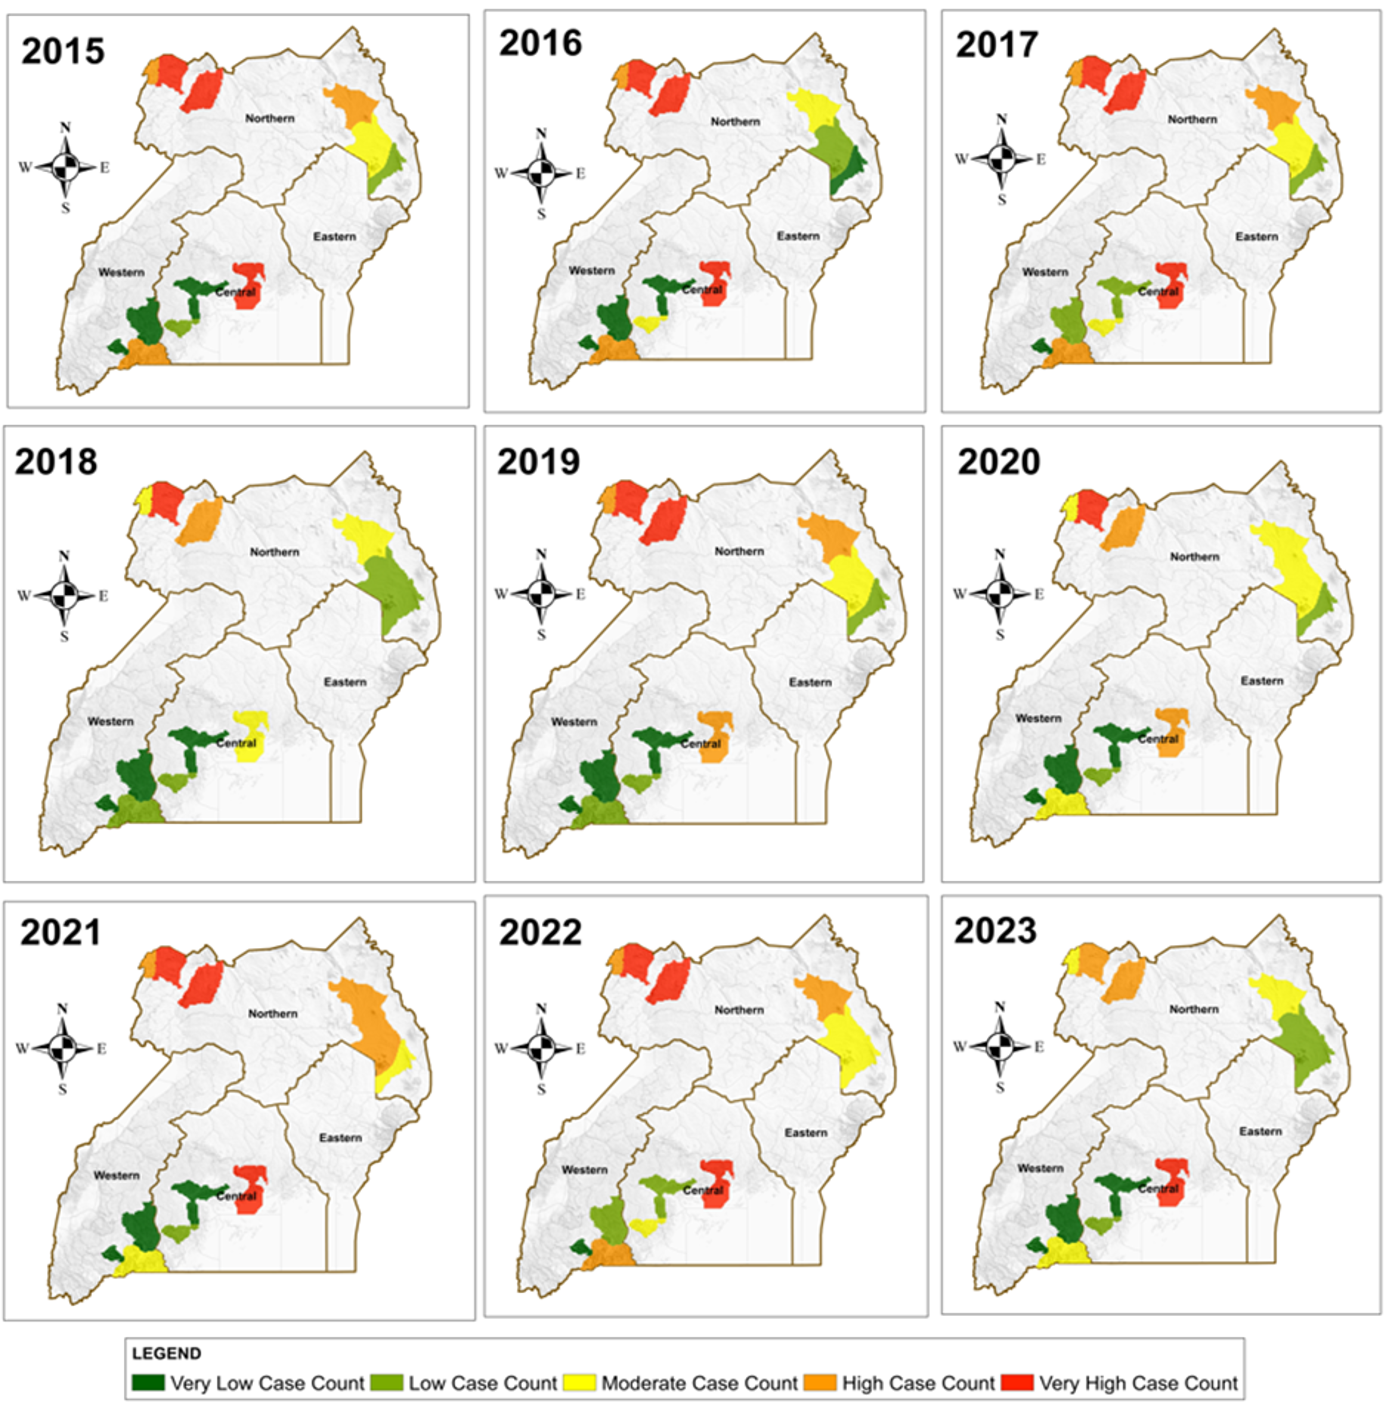
Figure 3: Maps displaying the annual trends of malaria cases within the four study regions
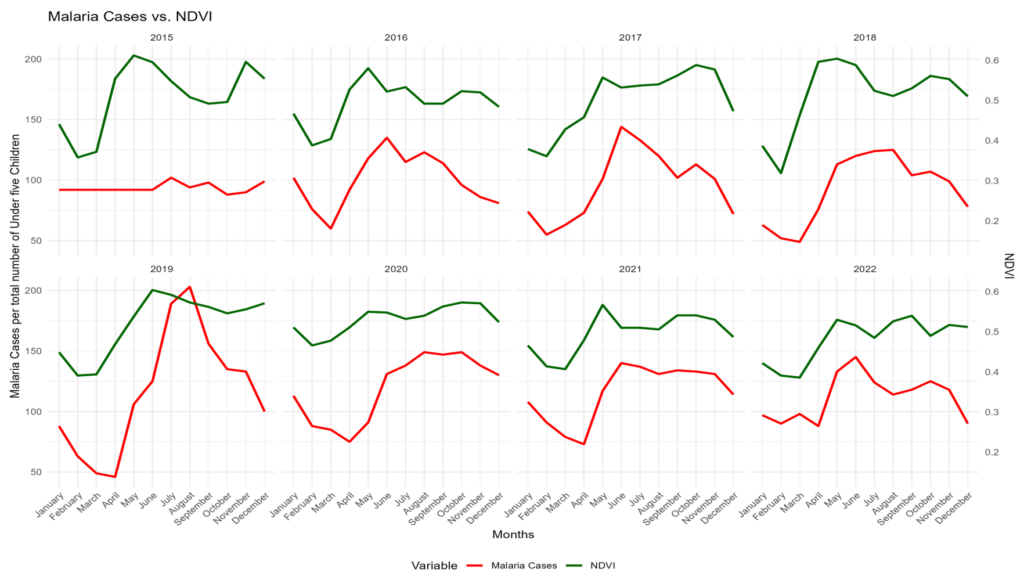
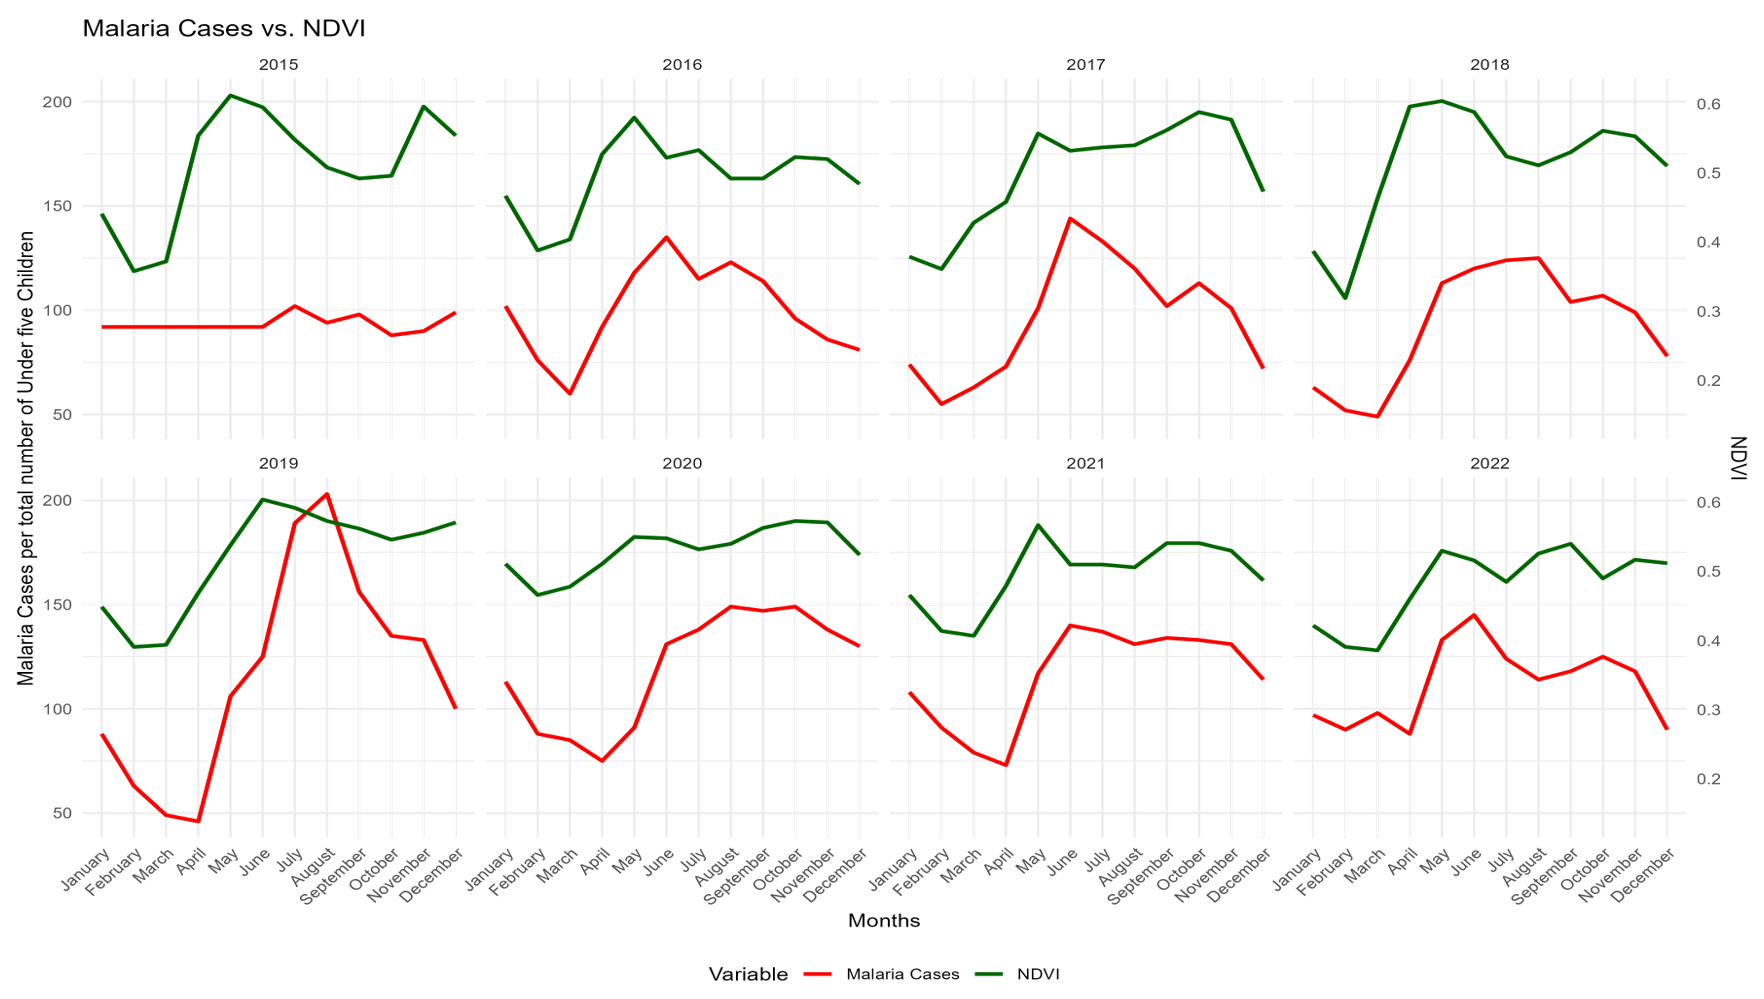
Figure 4: Monthly trends in Malaria casess and Normalized Difference Vegetation Index (NDVI)
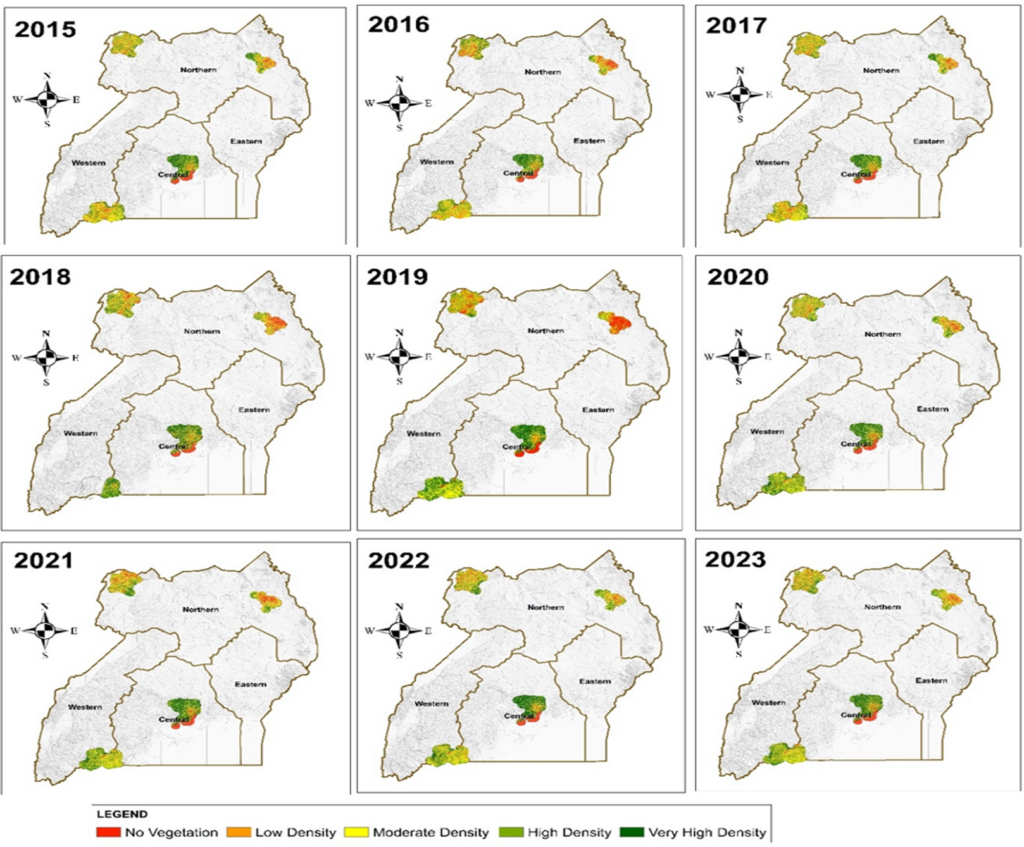
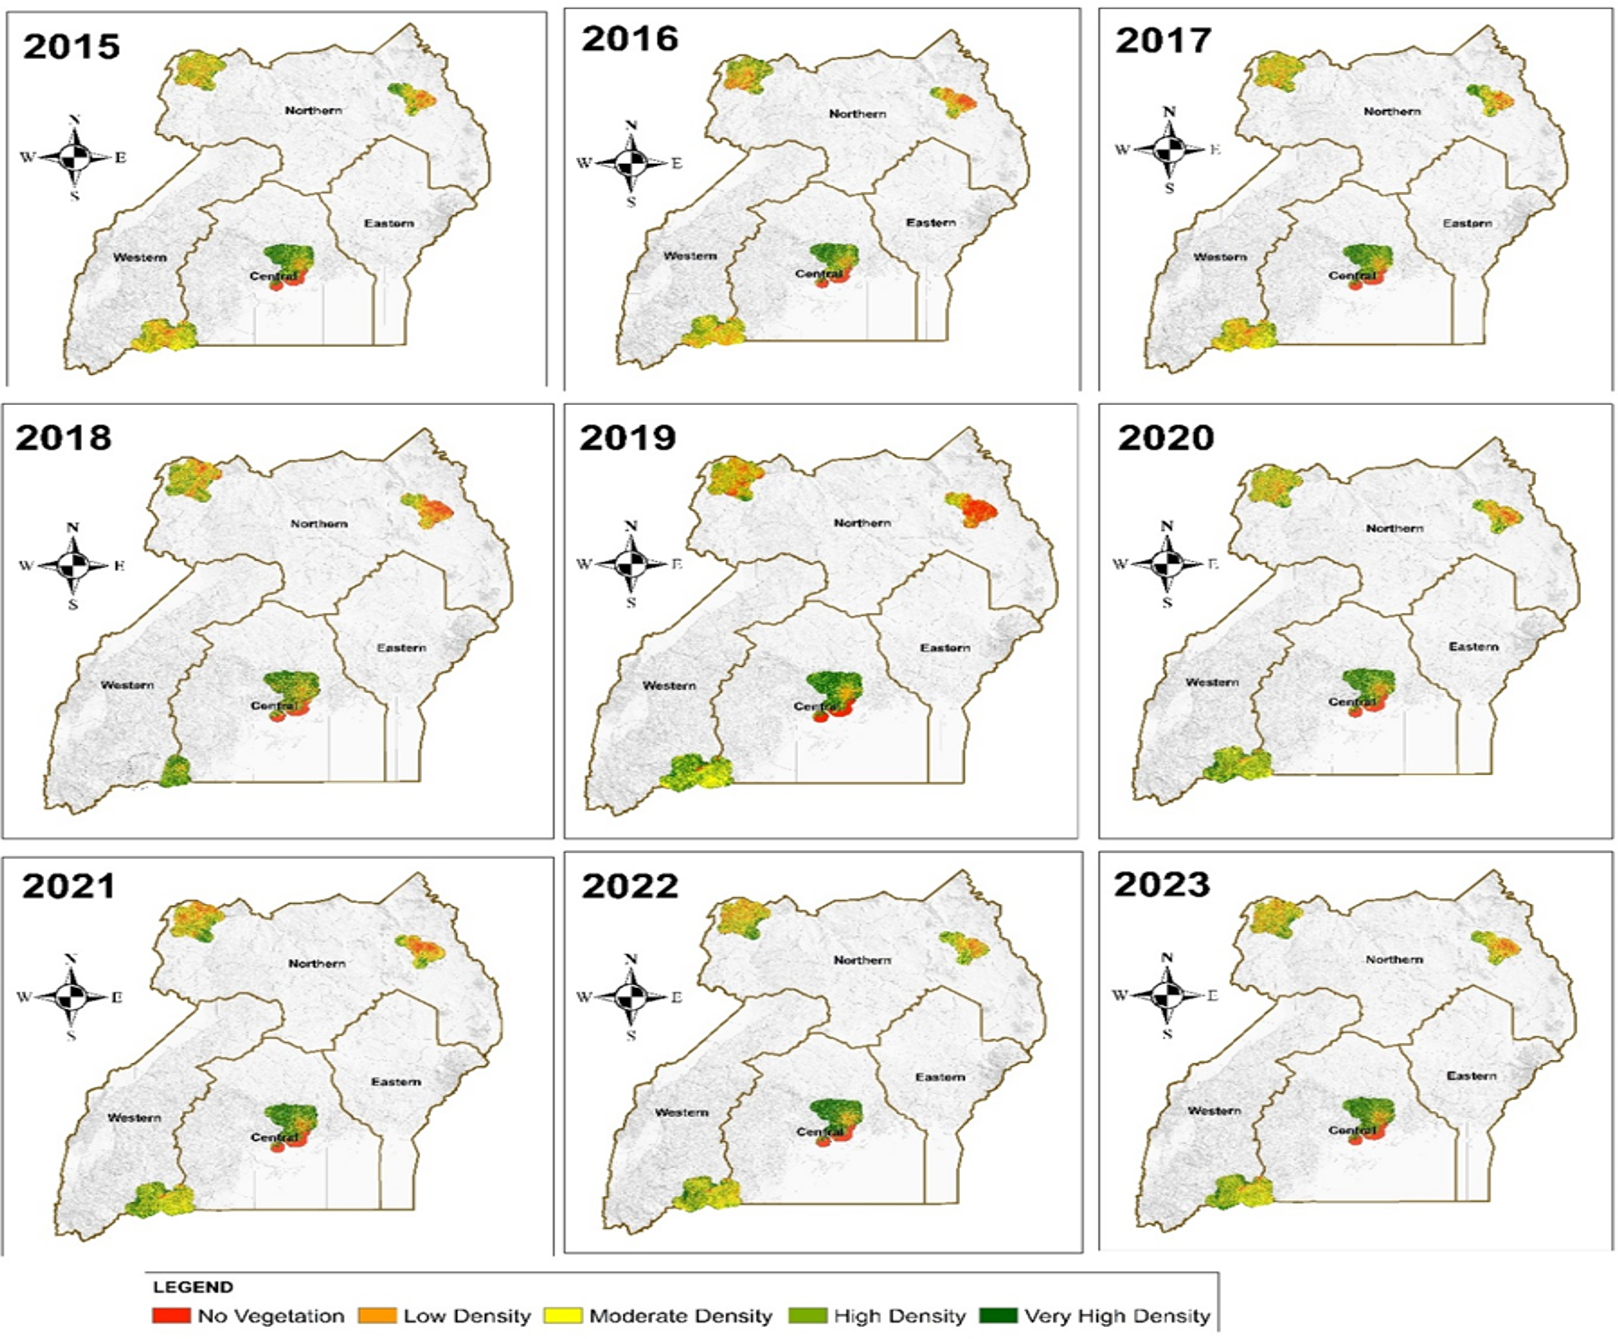
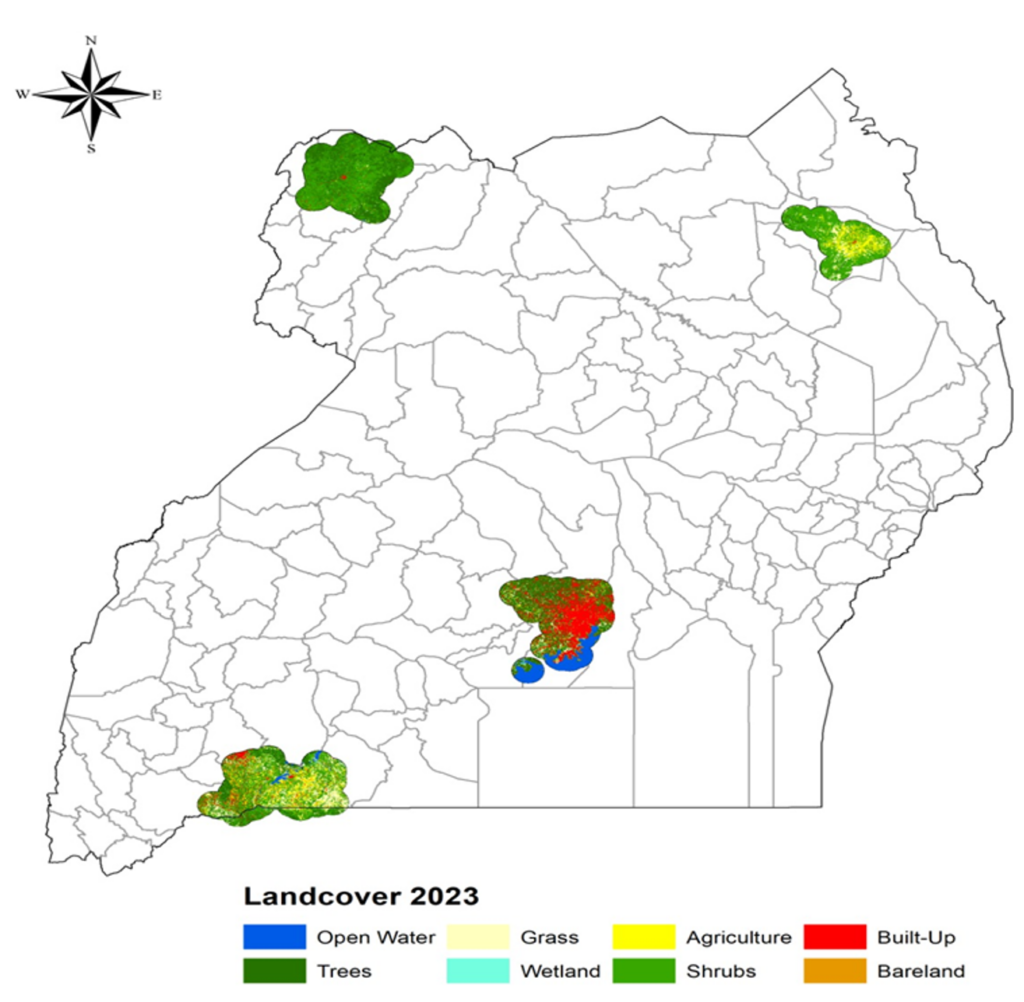


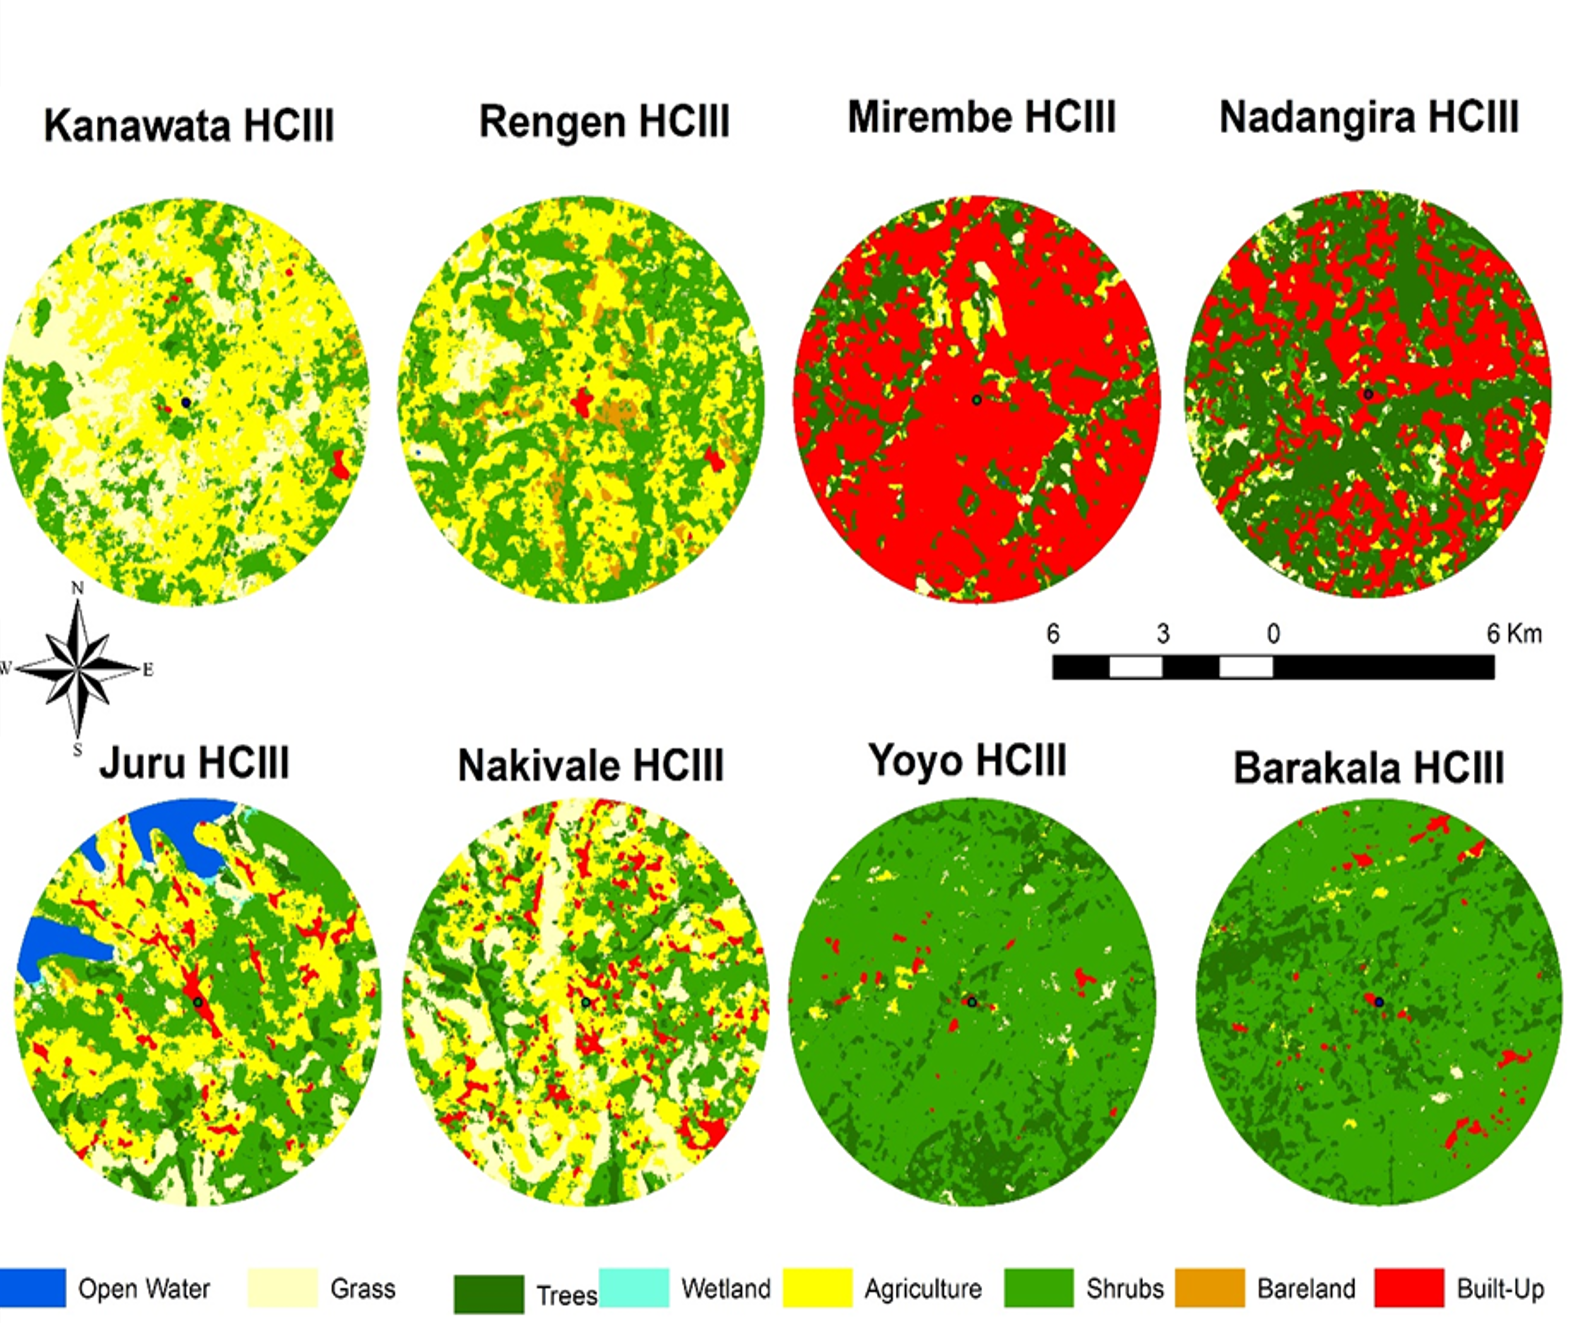

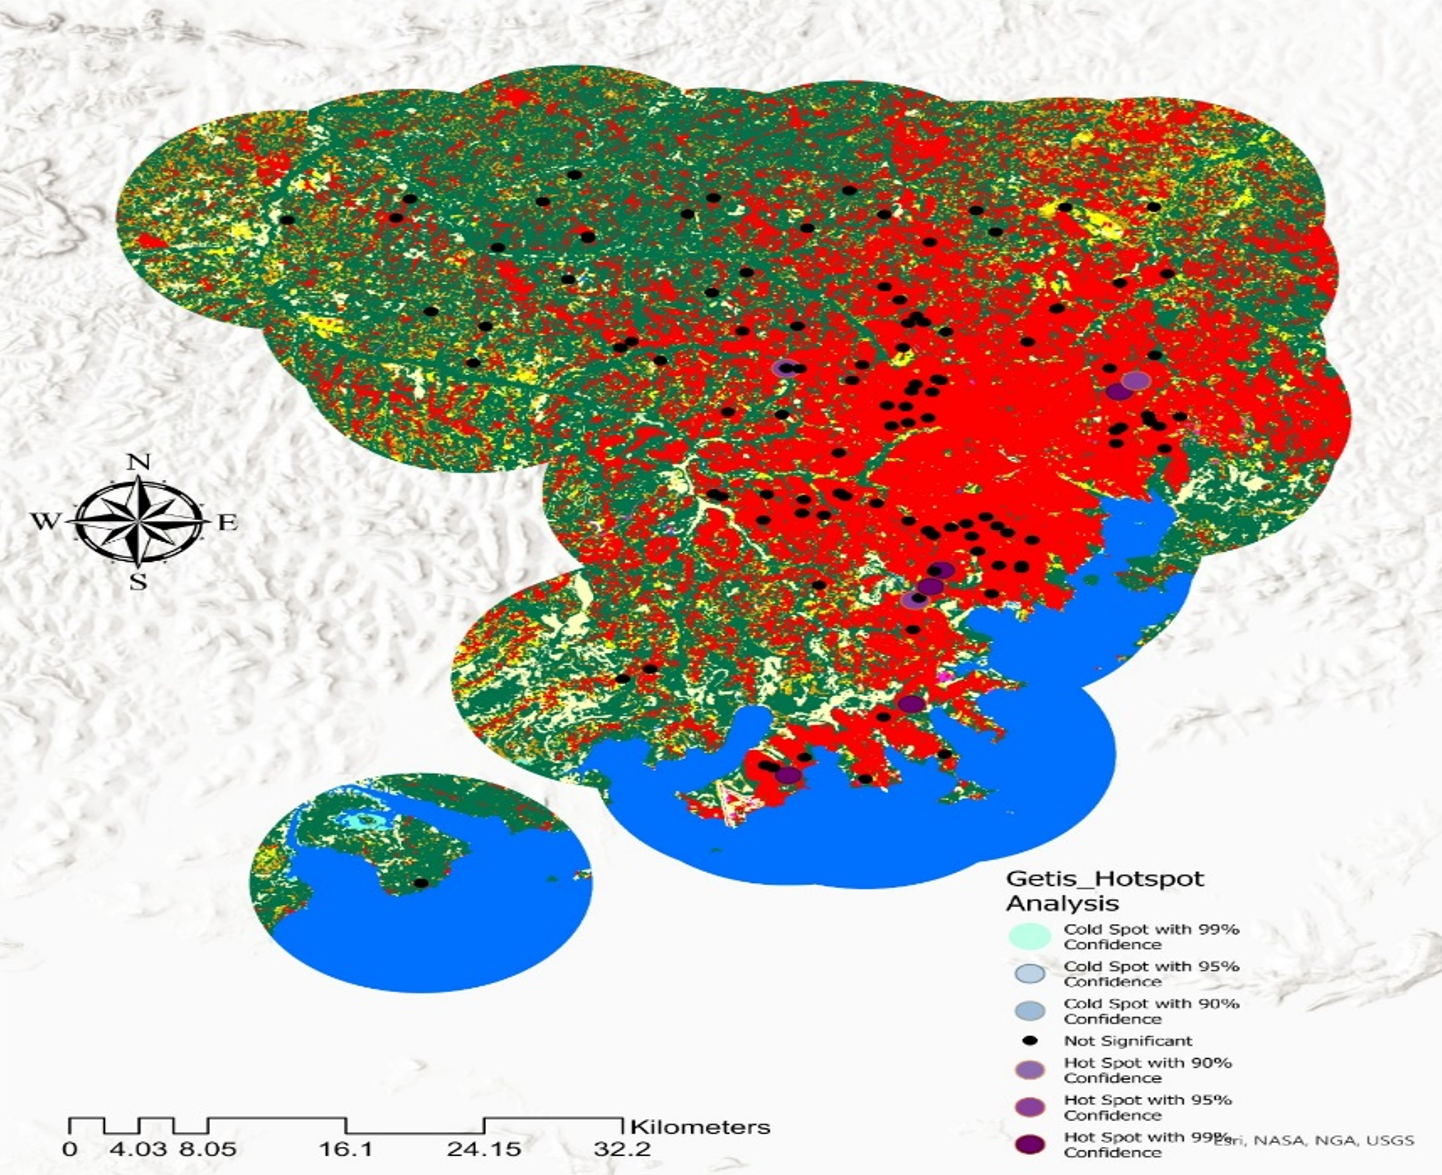
Figure 8: Spatial Distribution of Malaria Hotspots in Wakiso District Based on Getis-Ord Gi Analysis Overlaid on Land Use/Land Cover
Okello George Robert1,&, Robert Wamala2, Ellen Kayendeke3, Hellen Namawejje4, Peter Kisaakye1, Patricia Ndugga1, Fred Maniragaba1, Martin Kayitale Mbonye1
1Department of Population Studies, Makerere University, Kampala, Uganda, 2Directorate of Research Innovations and Partnership, Makerere University, Kampala, Uganda, 3Department of Environmental Management, Makerere University, Kampala, Uganda, 4Department of Statistical Methods, Makerere University, Kampala, Uganda
&Corresponding author: Okello George Robert, Department of Population Studies, Makerere University, Kampala, Uganda, Email: georgerobertokello@gmail.com ORICD: https://orcid.org/0009-0006-1788-8423
Received: 20 Mar 2026, Accepted: 28 Jun 2026, Published: 30 Jun 2026
Domain: Infectious Disease Epidemiology
Keywords: Malaria cases, vegetation cover, land use/land cover, children under five, spatial-temporal analysis
©Okello George Robert et al. Journal of Interventional Epidemiology and Public Health (ISSN: 2664-2824). This is an Open Access article distributed under the terms of the Creative Commons Attribution International 4.0 License (https://creativecommons.org/licenses/by/4.0/), which permits unrestricted use, distribution, and reproduction in any medium, provided the original work is properly cited.
Cite this article: Okello George Robert et al., Vegetation density, land use, and childhood malaria in Uganda, 2015–2023: An ecological study. Journal of Interventional Epidemiology and Public Health. 2026; 9(2):109. https://doi.org/10.37432/jieph-d-26-00092
Introduction: Malaria remains a major public health challenge in Uganda, particularly among children under five years of age. Environmental factors such as vegetation density and land use/land cover (LULC) may influence malaria transmission by affecting mosquito breeding habitats and vector survival. This study assessed the association between environmental factors, particularly the Normalized Difference Vegetation Index (NDVI) and LULC, and Malaria cases among children under five years across four ecologically diverse regions of Uganda: West Nile, Karamoja, Central, and Western Uganda.
Methods: Retrospective ecological analysis (2015–2023) with district-month as the analytical unit, involving 13 high-burden districts across four regions: West Nile [3], Karamoja [3], Western [3], and Central [4]. Malaria case data were obtained from DHIS2 and aggregated into monthly district-level totals. Environmental variables (NDVI, LULC, rainfall, temperature) were measured within 5-km buffers around eight high-burden health facilities selected as sentinel environmental sites across four regions. Facility-level environmental exposures were aggregated to the district-month level. Fixed-effects negative binomial regression estimated associations.
Results: Higher district-level NDVI (vegetation density) was significantly associated with increased Malaria cases: IRR = 1.47 per 0.5-unit increase (95% CI: 1.40–1.54; p < 0.001). Rural districts with dense vegetation (NDVI > 0.6) exhibited a 47% higher monthly incidence compared to urbanized districts (NDVI < 0.3). Urbanization was protective (IRR=0.92 per 10% urban increase; 95% CI: 0.87–0.97). Temperature and rainfall also significantly predicted incidence.
Conclusion: At the district-month level, vegetation density and LULC were significantly associated with childhood malaria. Environmental surveillance may complement district-level malaria prediction. Future studies should develop facility-level outcome surveillance to enable targeted interventions.
Malaria remains a major public health challenge globally, with sub-Saharan Africa accounting for approximately 95% of cases and 96% of malaria-related deaths[1]. Children under five years of age bear the greatest burden, contributing nearly 80% of malaria mortality due to their limited immunity and vulnerability to severe disease. Despite sustained investments in malaria control, Uganda continues to report one of the highest malaria burdens worldwide, with perennial transmission across most regions [2].
Climate is a key factor sustaining malaria transmission because it determines ecological conditions for Anopheles mosquitoes through its control of temperature, rainfall, and humidity, which in turn affects mosquito survival, breeding-site availability, and the timing and intensity of transmission across different places and seasons [3,4]. Temperature, in particular, is a key determinant of malaria transmission as it regulates mosquito development, survival, and parasite sporogony the extrinsic incubation period (EIP) during which parasites undergo sexual and asexual reproduction within the mosquito midgut before migrating to salivary glands [5]. Suitable malaria transmission requires temperature thresholds between 18°C and 32°C, coupled with precipitation exceeding 80 mm and relative humidity above 60% [6]. Rainfall directly increases larval breeding habitat availability, with proximity to water bodies (<500 m) significantly elevating malaria [7]. Optimal temperature ranges accelerate mosquito maturation and parasite development, thereby increasing transmission potential, whereas extremely high or low temperatures reduce vector survival and constrain malaria spread [8].
Rainfall plays a critical role in malaria risk by influencing mosquito breeding habitat formation and larval development. Moderate, sustained rainfall promotes larval development through standing water accumulation; however, intense rainfall significantly increases larval mortality by flushing them from breeding sites [9]. This threshold effect, where rainfall simultaneously creates breeding habitats while increasing larval mortality depending on intensity, underscores the non-linear relationship between precipitation and vector productivity. Temperature and precipitation interact to determine Anopheles population dynamics and malaria transmission seasonality[10], making rainfall patterns a critical determinant of malaria epidemiology. Importantly, the effect of rainfall on Malaria cases is often lagged, reflecting the time required for mosquito development and parasite maturation [11–13].
Beyond climatic factors, vegetation density plays a critical role by modifying microclimatic conditions such as humidity and shade, which enhance mosquito survival and longevity [14]. Dense or persistent vegetation provides resting sites for adult mosquitoes and stabilizes larval habitats [15]. However, the relationship is not always linear, as extremely dense vegetation may reduce human–vector contact, whereas moderate vegetation often creates optimal transmission conditions [16].
Relatedly, LULC patterns influence malaria transmission by altering both vector habitats and human exposure. Agricultural expansion, irrigation, and wetland modification can increase breeding opportunities[17], while urbanization typically reduces transmission by decreasing vegetation, improving drainage, and altering microclimates[18]. Nevertheless, peri-urban areas with mixed land use and inadequate infrastructure may sustain substantial malaria transmission, highlighting the context-specific effects of LULC on malaria risk [19,20].
Given the complex and interacting nature of these environmental drivers, geospatial and remote sensing approaches have become essential for malaria research. Satellite-derived indicators such as NDVI, land surface temperature, and rainfall estimates enable consistent monitoring of environmental conditions across space and time. These data can be integrated with malaria surveillance records to assess spatial patterns, seasonal dynamics, and lagged associations between environmental covariates and Malaria cases. Moreover, advanced statistical and machine-learning methods facilitate the modelling of non-linear relationships and improve malaria risk prediction [21].
Despite these methodological advances, important gaps remain. Many studies rely on coarse spatial aggregation, which masks fine-scale heterogeneity within ecological zones. Non-linear and lagged relationships between environmental covariates and Malaria cases are often inconsistently modelled[22,23]. In addition, empirical evidence from Uganda remains limited, despite its ecological diversity and persistently high malaria burden, particularly among children under five years [24,25].
To address these gaps, this study examines the spatial and temporal relationships between environmental variables NDVI, LULC, and Malaria cases among children under five years in Uganda from 2015 to 2023. By integrating multi-temporal remote sensing data with routine health surveillance records, the study seeks to improve understanding of how environmental dynamics shape malaria transmission and to inform geographically targeted malaria control strategies. The study is guided by vector ecology theory [26], which conceptualizes malaria transmission as a function of ecological conditions influencing Anopheles mosquito distribution, survival, and behaviour.
Conceptual framework
This study adopts the Multi-Level Eco-Epidemiological Framework to understand malaria transmission as a complex ecological process shaped by hierarchical interactions between distal and proximal environmental determinants. The framework integrates established eco-epidemiological principles with current evidence on how land use/land cover (LULC) changes and climate variables drive vector-borne disease dynamics.
Distal determinants: Land use and land cover (LULC) changes
LULC modifications, including deforestation for agriculture, conversion of bushland and swamps to farmland, and agricultural intensification, serve as distal drivers. These changes alter landscape heterogeneity, create favourable vector breeding habitats, and modify local microclimatic conditions (temperature, humidity, and light exposure), thereby enhancing vector survival and proliferation[27]. Such transformations have shifted malaria from episodic to endemic transmission in East African highlands, with non-linear and context-specific effects also observed in the Ecuadorian Amazon [20].
Proximal determinants: Climate variables
Temperature, rainfall, and humidity act as proximal determinants that directly regulate vector population dynamics and parasite development. Temperature controls larval development rates, vector survival, and the extrinsic incubation period (EIP) of Plasmodium parasites [10]. Rainfall sustains breeding sites but can increase larval mortality through flushing [9]. LULC changes interact with these climate variables by increasing local temperatures, reducing vegetation cover, and creating persistent water bodies, ultimately amplifying transmission potential [28].
Vectorial capacity and entomological inoculation rate (EIR)
Environmental drivers influence malaria risk through their effects on vectorial capacity, which integrates vector density, biting rate, survival rate, and EIP. The Entomological Inoculation Rate (EIR), the product of human biting rate (HBR) and sporozoite infection rate (SIR) serves as the key integrative metric linking environmental conditions to actual transmission intensity[29].
Temporal dynamics and confounding factors
The framework accounts for temporal lags and seasonal modulation: climate effects often manifest within weeks, while LULC changes produce longer-term (seasonal to multi-year) microclimate alterations[20]. Individual-level and health-system factors (e.g., housing quality, bed net use, and treatment access) are controlled through fixed effects and multilevel modelling to isolate environmental influences.
Study design and analytical framework
This was a retrospective ecological analysis (2015–2023) with a hierarchical data structure examining malaria transmission in Uganda. The primary unit of analysis and statistical inference was the district-month level, comprising 13 high-burden districts observed over 108 months, yielding 1,404 district-month observations (Figure 1).
This analytical level was selected because: (1) malaria outcomes are validated and routinely reported at the district-monthly level in DHIS2; (2) individual case locations are unavailable due to privacy protections; (3) findings are directly policy-relevant for district-level planning and resource allocation; and (4) district-level aggregation provides sufficient statistical power while minimising aggregation bias.
Study area and district selection
This study was conducted in four ecologically distinct regions of Uganda: West Nile (high malaria burden, lush vegetation), Karamoja (semi-arid, sporadic transmission), Central (peri-urban landscapes), and Western (lower malaria burden, mixed land cover). Thirteen high-burden districts were selected across these regions based on the malaria caseloads (three from West Nile, three from Karamoja, four from Central, three from Western) based on: (i) the highest documented malaria caseloads during the 2018–2019 malaria indicator survey, and (ii) >80% facility reporting completeness for malaria cases among children under five years in DHIS2.
Facility and environmental data collection
Facility selection: Within the 13 study districts, eight Health Centre III facilities were selected for high-resolution geospatial environmental data collection based on: (i) highest confirmed malaria caseloads among children under five years; (ii) consistent, high-quality HMIS reporting with ≥80% parasitological confirmation rates; and (iii) geographic distribution capturing intra-district ecological diversity (approximately two facilities per district) (Table 1).
Environmental exposure measurement: Environmental variables were extracted within 5-km buffers around facility coordinates. This buffer distance was chosen to approximate facility catchment areas based on: (i) Uganda Ministry of Health guidelines for Health Centre III catchments; (ii) population mobility studies indicating 60–70% of patients reside <5 km from their primary facility; and (iii) local transport accessibility patterns [30].
Data aggregation: Facility-level environmental measurements were aggregated to the district-month level using population-weighted averages and linked to corresponding district-month Malaria case data for all statistical analyses. Sensitivity analyses at the facility-month level validated that district-level aggregation did not substantially bias environmental effect estimates (e.g., NDVI: IRR=1.18 district-month vs. IRR=1.16 facility-month, Table 2).
Variable selection and measurement
Malaria outcome data: Malaria case data were derived from DHIS2, comprising all confirmed cases among children under five years reported by facilities within each district meeting ≥80% reporting completeness.
Environmental variables
NDVI (MODIS, 250-m resolution): Continuous in regression analyses; categorised into tertiles (low <0.3, moderate 0.3–0.6, high >0.6) for interpretability. Selected because vegetation density influences mosquito larval habitat suitability and adult vector survival.
LULC (Sentinel-2, 10-m resolution): Classification identified agriculture, shrubland, grassland, water, built-up, and bare soil. Each LULC fraction was modeled as a proportion (0–1) within facility buffers, aggregated to the district level. Selected because LULC patterns determine habitat distribution and human-environment contact.
Climate Variables (Temperature & Rainfall): Monthly minimum/maximum temperatures and rainfall were included because they directly affect parasite development and vector lifecycle completion. Variables were retained if: (i) they showed theoretical association with Malaria case, (ii) VIF <5 (collinearity threshold), and (iii) 10-year bivariate correlation with outcome |r| >0.10.
Justification for Multi-Scale Approach: Fine-scale facility-level exposure measurement (5-km buffers) was followed by aggregation to the district-month analytical unit, leveraging high-spatial-resolution environmental data while aligning with outcome data structure and policy relevance. Facility-level GIS spatial analysis verified that vegetation-malaria associations observed at the district-month level reflect mechanisms operating at fine spatial scales.
Data management and missing data handling
Malaria Surveillance Data: Missing values occurred in 4.2% of district-month observations, primarily due to delays in routine reporting. These were handled using multiple imputation by chained equations (MICE) under the missing-at-random (MAR) assumption. Ten imputed datasets were generated using auxiliary variables (district population size, health facility density, and seasonal trends). Regression models were run across imputed datasets with results pooled using Rubin’s rules. Complete-case analysis was performed as a sensitivity analysis to assess robustness.
Environmental Data: Missing values were minimal (<1%) and addressed through linear temporal interpolation between adjacent months. Spatial interpolation using inverse distance weighting (IDW) from neighboring districts was applied when necessary. All imputed values were cross-checked against historical seasonal norms.
Analytical unit and data aggregation
This study employed the district-month as the primary unit of analysis and statistical inference, comprising 13 high-burden districts observed over 108 months (2015–2023), yielding 1,404 district-month observations. Each observation represented Malaria case data and environmental exposures for one district in one calendar month.
Justification for district-month level: The district-month level was selected for four key reasons: (1) malaria outcomes in DHIS2 are validated and routinely reported at this temporal and spatial resolution; (2) individual case locations are unavailable due to privacy protections; (3) findings are directly actionable for district-level planning and resource allocation; and (4) this aggregation provides sufficient statistical power for robust inference while minimizing aggregation bias.
Data aggregation process: Malaria case data were derived from all health facilities within each district that met >80% reporting completeness criteria. Eight Sentinel Health Centre III facilities (approximately two per district) were selected based on the highest malaria case volumes to guide environmental data collection. Environmental variables (NDVI, LULC, rainfall, and temperature) were extracted within 5-km buffers around these facilities to characterize district-level exposures. Facility-level measurements were subsequently aggregated to the district-month level using population-weighted averages and linked to corresponding Malaria case data for all statistical analyses.
Multi-scale approach: This methodological design leveraged high-resolution satellite-derived environmental data (NDVI at 250-m resolution, LULC at 10-m resolution) at the facility scale while maintaining the district-month as the analytical unit. Sensitivity analyses at the facility-month level (864 observations) confirmed that district-level aggregation did not substantially bias environmental effect estimates (e.g., NDVI: IRR=1.18 at district-month vs. IRR=1.16 at facility-month), validating this aggregation strategy. All primary results and inferences are reported at the district-month level; no facility-level regression analyses were performed.
Data sources
Malaria case data
Malaria case counts for children under five years were obtained from Uganda’s District Health Information System version 2 (DHIS2) for 2015–2023. Data were cleaned to remove duplicates and missing values, then aggregated into monthly district-level totals to construct continuous time series enabling analysis of seasonal, inter-annual, and lagged relationships with environmental covariates.
Environmental data: Specifications and harmonisation
Vegetation (NDVI): Monthly mean NDVI was derived from the MODIS MOD13Q1 product (250-m resolution, 16-day intervals). Within-month observations were averaged to align with monthly malaria data, reducing short-term variability while preserving seasonal patterns. Missing values (<1%) due to cloud cover were addressed through linear interpolation.
Land Use and Land Cover (LULC): Annual LULC maps were generated from Sentinel-2 multispectral imagery (10-m resolution) using supervised classification in Google Earth Engine, classified into five categories: trees, shrubs, agriculture, wetlands, and built-up areas. District-level proportions were calculated by overlaying administrative boundaries on annual maps. Due to the slow temporal dynamics of land cover, annual LULC proportions were uniformly assigned to all 12 months within each calendar year, a standard approach in malaria-environment research. This temporal approximation was balanced by incorporating monthly NDVI as a dynamic vegetation indicator and applying monthly fixed effects to account for seasonal patterns Table 3.
Climate variables: Monthly rainfall was retrieved from CHIRPS v2 (0.05° resolution, ~5 km). Minimum and maximum 2-meter air temperatures were obtained from ERA5 reanalysis (0.1° resolution, ~9–11 km). All values were extracted and averaged within 5-km buffers around selected health facilities. Table 3 shows the summary of variables and their measurements
Dataset integration
Each monthly district-level observation contained: (1) one malaria case count, (2) one NDVI value, and (3) eight unchanging LULC proportions (summing to 100%) corresponding to that calendar year. This structure enabled panel time-series modelling while leveraging high-resolution satellite data and aligning with malaria reporting frequencies.
Temporal and statistical analysis
Temporal decomposition
Seasonal-Trend decomposition using LOESS (STL) was applied to Malaria case, NDVI, and LULC time series to separate trend, seasonal, and residual components while accommodating non-linear trends and variable seasonality. A 12-month seasonal window with robust smoothing was implemented in R to isolate meaningful long-term patterns from short-term fluctuations.
Environmental exposure measurement and linkage
Environmental variables were extracted at the facility level within 5-km catchment buffers, which align with Uganda Ministry of Health guidelines for Health Centre III service areas and epidemiological evidence of patient travel patterns. These facility-level measurements were then aggregated to the district-month level, the primary unit of analysis, to match malaria outcome reporting structures and achieve sufficient statistical power.
NDVI (MODIS, 250-m resolution) was averaged monthly to align with monthly Malaria case data. For subgroup analyses examining dose-response associations, NDVI was categorized into tertiles (low <0.3, moderate 0.3–0.6, high >0.6) to enhance the interpretability of vegetation effects.
LULC (Sentinel-2, 10-m resolution) was mapped annually, producing eight land-cover proportions per district per year (trees, shrubs, agriculture, and wetlands, built-up areas, grassland, water, and bare soil). Due to the slow rate of land-cover change relative to monthly malaria fluctuations, these annual proportions were assigned uniformly to all 12 months within each calendar year, a standard approximation in malaria-climate research. Complementary monthly NDVI data and monthly fixed effects in regression models mitigated potential temporal misalignment in highly dynamic landscapes.
Climate variables were extracted monthly: rainfall from CHIRPS (0.05° resolution, ~5 km) and minimum/maximum temperatures from ERA5 reanalysis (0.1° resolution, ~9–11 km). These were averaged within facility buffers to match the spatial scale of Malaria case and vegetation data.
This multi-scale approach, fine-resolution facility-level extraction followed by district-month aggregation, enabled the use of high-resolution satellite data while maintaining consistency with routinely reported health outcomes and policy-relevant geographic units.
Statistical analysis
Correlation analysis: Pearson’s correlation coefficients quantified linear relationships between Malaria case (outcome) and environmental/climatic predictors. Vegetation cover was operationalized as the combined proportion of trees, shrubs, and agricultural land, providing a broad measure of vegetated habitat. Prior to analysis, variables were examined for distributional properties and normality; transformations were applied where necessary to meet Pearson correlation assumptions. Statistical significance was evaluated at the 95% confidence level (α = 0.05) with notation: *** (p < 0.001), ** (p < 0.01), * (p < 0.05).
Regression modelling: Fixed-effects negative binomial regression models were used to examine associations between aggregated environmental exposures and malaria cases among children under five years. This modeling approach accounts for the count nature of malaria data and the wide range of baseline incidence across districts. Standard errors were clustered at the district level to account for within-district temporal correlation. Incidence Rate Ratios (IRRs) with 95% confidence intervals are reported, each interpreted as the relative percentage change in Malaria cases associated with a one-unit increase in the corresponding environmental predictor.
Diagnostic testing and robustness: Temporal autocorrelation was assessed using the Wooldridge test, which confirmed significant serial correlation in the data. To address this, two-way cluster-robust standard errors were estimated at the district level to account for both within-district correlation and temporal dependence. Spatial dependence was evaluated using Moran’s I test on model residuals. Sensitivity analyses using Newey-West heteroskedasticity-autocorrelation consistent standard errors confirmed the robustness of effect estimates. Post-estimation diagnostics showed minimal residual autocorrelation, with finite-sample bias corrections applied to variance-covariance matrices to ensure valid inference.
Lag structure
Environmental covariates were evaluated both at the same time (lag 0) and with 1-month (lag 1) and 2-month (lag 2) delays relative to reported malaria cases. This lagged approach captures delayed effects on transmission caused by biological and operational factors. Specifically, rainfall and suitable vegetation increase breeding habitats for Anopheles mosquitoes, leading to rises in adult mosquito populations roughly 1–2 weeks after habitat improvements. After mosquito development and infected blood meal intake, the Plasmodium parasite experiences an extrinsic incubation period of about 10–14 days (temperature-dependent), further delaying infectious transmission. Additionally, delays in surveillance reporting within routine health systems can shift observed malaria cases relative to actual environmental conditions. Together, these biological and operational factors support including 1–2 month lag structures to assess both immediate and delayed links between environment and malaria.
Spatial visualization and software
Geographic heterogeneity in Malaria case and environmental covariates was visualized at the health facility level using heat maps generated in ArcGIS Pro to identify spatial patterns. However, primary analyses focused on correlation and regression modeling to rigorously quantify associations between environmental factors and malaria outcomes. All statistical analyses were conducted in R (version 4.2.1) to ensure transparency and reproducibility of results
Model selection and justification
Given the count nature of monthly malaria cases and evidence of overdispersion (variance exceeding the mean), we employed a negative binomial panel regression model. The model specification was:
where:
The negative binomial distribution accommodates overdispersion through the dispersion parameter $\alpha$, where $\text{Var}(Y_{it}) = \mu_{it} + \alpha\mu_{it}^2$. A statistically significant $\alpha > 0$ confirms overdispersion and justifies the negative binomial over Poisson specification.
To account for unobserved heterogeneity across districts, both fixed-effects and random-effects negative binomial models were estimated. A Hausman test was conducted to choose between the fixed effects and random effects models. The test statistic was χ² (4) = 25.7118 (p = 0.0000), leading to the rejection of the null hypothesis. Therefore, the fixed effects model was selected for the analysis. Consequently, the fixed-effects negative binomial model was adopted as the primary analytical model.
Model diagnostics further supported this choice in Table 5. The model showed a good overall fit. Model performance metrics for the fixed-effects specification were: Log Likelihood = −5852.0, Akaike Information Criterion (AIC) = 11740.0, and Bayesian Information Criterion (BIC) = 11832.3. The dispersion parameter (alpha = 0.1434) confirmed the appropriateness of the negative binomial model over Poisson regression. Residual diagnostics showed a residual mean close to zero (0.0017) and acceptable distribution characteristics (skewness = 1.3374, kurtosis = 3.4370). Nevertheless, random-effects estimates are also presented as a robustness check because they allow estimation of between-district variation and facilitate comparison of effect sizes across model specifications. Comparing results across both approaches provides an assessment of the consistency and robustness of the observed relationships between climate variability and Malaria cases.
Incorporation of temporal structure and handling of spatial dependence
To adequately account for the strong temporal structure characteristic of malaria transmission, monthly dummy variables were included to capture seasonality driven by rainfall and temperature patterns. As a robustness check, model seasonal cycles were also tested. Potential lag effects of environmental covariates were examined by including 1-month and 2-month lagged values, selected based on exploratory cross-correlation analysis and model information criteria. A dynamic specification with the lagged dependent variable was additionally explored where appropriate.
Spatial dependence and within-district temporal autocorrelation were addressed in multiple ways. First, district-level fixed effects absorbed time-invariant spatial heterogeneity. Second, standard errors were clustered at the district level to allow for arbitrary within-district correlation over time (including serial correlation). The presence of serial correlation was formally tested using Wooldridge’s test for autocorrelation in panel data.
Confounding and collinearity
Confounding was addressed using multiple complementary strategies. To control all unobserved time-invariant district-level confounders (e.g., topography, socio-economic conditions, health infrastructure, and intervention coverage), district fixed effects were included in the negative binomial regression models. Time-varying confounders were adjusted for by incorporating monthly mean rainfall, temperature, and relative humidity, each included with 1- and 2-month lags. Seasonality was further controlled using monthly dummy variables. Normalized Difference Vegetation Index (NDVI) was included as a dynamic, time-varying covariate to account for changes in vegetation cover.
Assessment of collinearity was performed prior to model fitting. Pairwise Pearson correlations were examined among all continuous environmental predictors (rainfall, temperature, humidity, and NDVI). In addition, Variance Inflation Factors (VIF) were calculated for each covariate in the final multivariable models. All VIF values were below 5 (mean VIF < 2.5), indicating that multicollinearity was not a concern. Where moderate correlations were observed (e.g., between temperature and humidity), models were tested with and without one of the correlated variables to confirm the robustness of the primary associations.
Ethical approval
Ethical approval for this study was obtained from the Mulago Hospital Research and Ethics Committee (MHREC-2910). Administrative clearance and authorization to access and use the data were granted by the Ministry of Health, Uganda. Permission was specifically granted for the use of secondary surveillance data extracted from Uganda’s national Health Management Information System (HMIS/DHIS2).
Given that the study relied exclusively on routinely collected, aggregated secondary surveillance data with no direct contact with human participants, an exemption from informed consent (waiver of consent) was granted by the ethics committee. All data were fully anonymized at the source before access, and no individual-level identifiers were obtained or analyzed at any stage of the study.
Data extraction from the HMIS was conducted using a standardized data abstraction tool developed for this study to ensure consistency in the retrieval of malaria case data across facilities and time periods. The tool facilitated structured extraction of aggregated monthly malaria reports and relevant metadata for analysis.
All procedures were conducted in accordance with national research ethics guidelines and the principles of the Declaration of Helsinki. Confidentiality and data security were strictly maintained throughout the study, and all analyses were performed on de-identified aggregated datasets.
Descriptive findings
Regional patterns of malaria burden
We examined temporal trends in Malaria cases to identify regions and periods with elevated risk and to assess whether patterns corresponded with environmental variability.
Figure 2 shows the relationship between vegetation density (NDVI) and total malaria cases across the primary care facilities. The scatter plot reveals a weak positive linear association between NDVI and the number of malaria cases. As vegetation density increases, there is a modest tendency for the total number of malaria cases to increase, but the relationship is characterized by substantial scatter and variability.
The results in Figure 3 reveal that districts in the West Nile sub-region consistently showed the highest malaria burden across the study period (2015–2023). This region exhibited persistent very high case counts, reflecting conditions highly suitable for year-round vector survival. In contrast, several districts in the Western and parts of the Eastern regions showed predominantly very low to low case counts, while moderate to high burdens were observed in selected Central and Northern districts. Overall, the spatial pattern demonstrated notable geographic clustering of high-burden areas that remained relatively stable over the nine years.
Monthly trends in malaria cases and normalized difference vegetation index (NDVI)
Figure 4 shows the monthly trends in malaria cases among children under five years (red line) and NDVI (green line) across the study districts from 2015 to 2022. Both series exhibited clear seasonal patterns, with NDVI peaking during the rainy season and malaria cases generally following with a lag of one to two months. A strong positive temporal association between NDVI and Malaria cases was observed in most years, particularly evident in the sharp rises during 2018 and 2019. These patterns support the inclusion of lagged environmental variables in the regression models and highlight the strong environmental influence on malaria transmission in the study area.
Spatial and temporal variation in NDVI
Environmental exposures were characterized using high-resolution satellite data extracted within 5-km buffers around the eight selected high-burden Health Centre III facilities. These eight facilities (two per selected region in the majority of study districts) served as sentinel sites for detailed geospatial assessment of local environmental conditions.
Vegetation density was evaluated as a determinant of malaria risk. NDVI values were extracted from MODIS (MOD13Q1, 16-day composites) and averaged within 5-km buffers around each health facility, approximating the catchment areas where the households contributing malaria cases reside, consistent with Ministry of Health guidelines. LULC fractions were summarized within the same buffers to link local landscape composition to Malaria cases. NDVI showed a statistically significant positive association with Malaria cases (IRR = 1.47, 95% CI: 1.40–1.54, p < 0.001), corresponding to a 47% higher incidence rate per one-unit increase in NDVI after adjustment. However, the bivariate correlation was weak (r = 0.048), indicating modest overall explanatory power.
High NDVI (>0.6) within catchments was associated with increased Malaria cases, with NDVI peaks preceding case surges by 1–2 months. Facilities in low-NDVI areas (<0.3), often urban or semi-arid, reported consistently lower incidence. Regional patterns reflected local ecology: West Nile had high NDVI due to dense forests and wetlands, Karamoja had low NDVI (0.2–0.4) with spikes preceding malaria peaks, Central Region had moderate NDVI (0.3–0.6) in peri-urban areas, and Western Region maintained stable, moderate-to-high NDVI in agricultural zones.
In Figure 5, the results demonstrate that local NDVI and LULC within 5-km facility catchments, representing the households served, are strong predictors of malaria risk among children under five.
Spatial-temporal variation in land use and land cover
We evaluated LULC to identify specific habitat types associated with increased malaria risk, as shown in Figure 5. LULC classifications were extracted from Sentinel-2 imagery and aggregated at the region and health facility levels. The LULC map of Uganda was classified into eight categories: Open Water (blue), Wetland (cyan), Trees (dark green), Shrubs (medium green), Grass (light yellow), Agriculture (yellow), Built-Up (red), and Bareland (brown). The landscape is dominated by a mosaic of agriculture, shrublands, and grasslands, with remaining forest patches mainly in the northwest and southwest, concentrated urban development around Kampala, and significant wetlands and open water bodies in the central-southern region.
LULC analysis revealed distinct regional patterns during the period of study in Figure 5. West Nile was dominated by tree cover (forests and wetlands), supporting high malaria prevalence. Karamoja and parts of Western Uganda featured grasslands and agriculture, with shrubs and bare land prevalent in Karamoja’s semi-arid zones. Central Uganda showed significant built-up areas, particularly in Wakiso. Shrub-dominated and agricultural landscapes consistently exhibited higher malaria prevalence, while urbanized areas with minimal vegetation suppressed transmission. Over the study period, land use changes such as agricultural expansion in Karamoja and West Nile were associated with increased malaria risk due to the creation of new mosquito habitats.
Correlation between malaria cases and environmental variables
The results in Table 4 indicate significant but relatively low correlations among the variables, highlighting positive relationships between climatic and environmental factors and Malaria cases. Malaria cases show weak positive correlations with all variables, with the highest being with Minimum Temperature (0.194), suggesting a slight increase in Malaria cases with rising minimum temperatures. The correlations with Maximum Temperature (0.175) and Rainfall (0.080) are weaker, while the relationship with Vegetation density is the weakest (0.048), indicating minimal direct influence of vegetation health on Malaria cases. Rainfall correlates moderately with Vegetation density (0.355) and Minimum Temperature (0.328), reflecting the role of rainfall in supporting vegetation health and influencing minimum temperatures. Minimum Temperature has the strongest correlation with Maximum Temperature (0.702), showing their natural interdependence, and a moderate relationship with Vegetation density (0.217), suggesting its importance for vegetation health. Overall, the observed correlations among the variables are relatively low to moderate, with the highest being between Minimum and Maximum Temperatures (0.702).
Panel data regression between vegetation density and malaria cases
The results of the fixed-effects negative binomial regression model examining district-level factors associated with monthly malaria case counts among children under five are presented in Table 6.
In the primary fixed-effects model, NDVI was strongly associated with Malaria cases. A one-unit increase in NDVI (1-month lag) was associated with significantly higher malaria cases (Coefficient = 0.38635, 95% CI: 0.3393–0.4334, p < 0.001). This corresponds to an Incidence Rate Ratio (IRR) of approximately 1.47, meaning a one-unit increase in NDVI was associated with a 47% increase in Malaria cases, holding other factors constant
Higher NDVI values were consistently associated with increased Malaria cases, with the strongest effects observed at moderate to high vegetation densities (NDVI 0.4–0.7). Lagged vegetation peaks preceded surges in Malaria cases by 1–2 months, suggesting that vegetation greenness serves as an early indicator of heightened transmission risk. Low NDVI values, typical of urbanized or semi-arid areas, were linked to reduced Malaria cases.
Vegetation density had a positive relationship with malaria cases (coefficient = 0.38635), suggesting an increase in malaria cases with increases in vegetation cover. This relationship is statistically significant (p-value = 0.0000) at 5%. The dispersion Parameter (/ln(alpha) = -0.0293) also suggests that, on average, 2% of the variation in malaria cases can be explained by the variation in vegetation cover. The parameter was negative and insignificant, suggesting the absence of over-dispersion in malaria cases based on vegetation cover.
Spatial and temporal variation in land use and land cover in selected health facilities.
We evaluated LULC to determine how different habitat types influenced malaria risk at selected health facilities. Sentinel-2 imagery was classified into eight primary LULC categories (open water, grass, trees, shrubs, agriculture, wetlands, bare land, and built-up areas) and aggregated at health facility levels, and shown in Figure 6.
Spatial and temporal variation in land use and land cover in selected health facilities
Figure 7 presents land cover classification maps within a 5 km radius around eight Health Centre IIIs: Kanawata (Kotido), Rengen (Kotido), Mirembe (Wakiso), Nadangira (Wakiso), Juru (Yumbe), Nakivale (Isingiro), Yoyo (Arua), and Barakala (Arua), illustrating spatial variations in environmental features that influence malaria cases. Facilities such as Mirembe and Nakivale HCIIIs, were dominated by agricultural and built-up areas. In contrast, Yoyo and Barakala HCIIIs were characterized by extensive shrub and tree cover with minimal land disruption. Juru HCIII, with significant open water and wetland coverage, presents conditions favourable for mosquito production, potentially contributing to elevated malaria cases. Meanwhile, Kanawata, Rengen, and Nadangira HCIIIs show a mixture of grass, shrubs, and agriculture, suggesting moderate malaria risk influenced by mixed ecological and anthropogenic factors. Health facilities with shrub and agriculture-dominated landscapes were consistently associated with higher Malaria cases, while built-up areas showed reduced transmission. Temporal expansion of agricultural land in health facilities in Karamoja and West Nile corresponded with increases in malaria cases, indicating that human-modified landscapes created favourable conditions for mosquito breeding and disease transmission. Overall, variations in malaria cases across these health facilities appear closely linked to differences in land use intensity, vegetation cover, and the extent of water and wetland presence, all of which shape local mosquito ecology and transmission potential.
Heat map comparing malaria burden, NDVI, and LULC across all facilities.
A heat map of malaria burden, NDVI, and LULC was generated for all health facilities to examine spatial patterns and potential environmental determinants of malaria transmission. By integrating facility-level epidemiological data with satellite-derived vegetation and land cover information, the map illustrates areas of higher malaria cases and their association with ecological characteristics. This visualization facilitates the identification of facility catchment areas where environmental factors may influence malaria risk, providing a tool to inform targeted control strategies and resource allocation.
Spatial heterogeneity in malaria cases and environmental drivers
Hotspot Identification and Geographic Patterns: Getis-Ord Gi* hotspot analysis identified statistically significant spatial clusters of high malaria cases (95–99% confidence level) located near permanent water bodies. Specifically, high-confidence hotspots were consistently found within 0–2 km of water, reflecting the distribution of Anopheles breeding habitats. Conversely, cold spots, which are areas with significantly lower malaria cases than expected based on their geographic and temporal context, were observed more than 3–5 km from water bodies. This distance-dependent spatial gradient indicates that proximity to aquatic ecosystems is a key factor influencing malaria transmission intensity.
Table 7 summarizes hotspot and cold spot characteristics by region, revealing both consistent pan-regional environmental associations and region-specific patterns. Temperature and humidity showed strong statistical associations with hotspot locations across all study regions. This universal pattern reflects the temperature-dependent development rates of Anopheles mosquitoes and the Plasmodium parasite, such that warmer, more humid environments accelerate vector competence and parasite maturation.
Dense vegetation was identified in all hotspot areas; however, the specific vegetation composition varied by landscape context. In lake-endemic zones, natural riparian vegetation (riparian forests, permanent wetlands, and associated woody cover) characterized hotspots, consistent with the perennial availability of aquatic breeding habitat and vegetation-supported vector resting sites. In contrast, peri-urban areas showed agricultural land cover (cultivated crops, pastures, and fragmented natural vegetation) as the dominant vegetation type in hotspots, indicating that human-modified landscapes can equally support elevated malaria transmission when combined with suitable thermal and moisture conditions.
These findings indicate that malaria spatial distribution is shaped by the interaction of environmental factors, thermal suitability, moisture availability (proxied by proximity to water), and vegetation structure that together determine vector habitat quality and transmission intensity
This study aimed to investigate the associations between key environmental factors, including vegetation density (as measured by the Normalized Difference Vegetation Index, NDVI), distinct Land Use and Land Cover (LULC) categories, monthly rainfall, and minimum and maximum temperatures and malaria cases among children under five years at the district-month level across four ecologically diverse regions in Uganda from 2015 to 2023. This study demonstrated that environmental factors, particularly vegetation density and land use patterns, are associated with malaria cases among children <5 years in Uganda. Environmental and malaria data were collected at facility catchment level (5-km buffers) but analyzed at the district-month level to stabilize small-count data and align with ecological inference. This hierarchical approach allowed spatially resolved characterization of environmental heterogeneity while maintaining statistical power for inference.
The analysis reveals a robust association between high NDVI shrub-dominated landscapes and agricultural LULC with elevated malaria cases in rural regions. These environments foster ideal mosquito breeding conditions, including shade, moisture, and standing water, which are critical for the production of Anopheles mosquitoes, the primary malaria vectors. This finding complements previous studies [31], which demonstrated that dense vegetation and moist environments enhance mosquito breeding habitats, and [32], which linked agricultural landscapes with increased malaria transmission due to irrigation practices that create persistent water pools. Specifically, wetlands and agricultural fields in regions like West Nile and parts of Ankole serve as year-round and seasonal mosquito breeding sites, respectively, sustaining high malaria prevalence [33]. For instance, in West Nile, permanent wetlands provide stable breeding grounds, while in Ankole, seasonal flooding associated with agricultural activities creates temporary but significant vector habitats, as noted by [34].
In contrast, urban areas in Uganda’s Central Region, characterized by low NDVI and extensive built-up environments, exhibit lower malaria transmission. The reduced vegetation density and limited availability of standing water in these areas restrict mosquito breeding opportunities, aligning with findings by [12,35], who reported lower malaria risk in urban settings due to altered ecological conditions. Similarly, [36] emphasized that urbanization disrupts mosquito habitats through land modification and improved drainage systems, reducing vector populations. However, this study contradicts the findings of [37], who revealed that rapid unplanned urbanization can unintentionally create new breeding sites, such as in poorly drained informal settlements.
In Karamoja, a semi-arid region, malaria transmission fluctuates in response to environmental changes. Low NDVI typically indicates dry conditions with limited breeding sites, but a sudden increase in vegetation following rainfall can signal potential malaria outbreaks. These findings are in agreement with the previous studies by [38,39] who highlighted that temperature, rainfall, and vegetation index affect the transmission dynamics of malaria. Temperature and NDVI appear to exhibit a more pronounced influence among these factors. This dynamic is further supported by [40], who found that seasonal vegetation surges in semi-arid regions correlate with increased mosquito populations due to the formation of temporary water bodies. These findings underscore the importance of region-specific malaria dynamics, where environmental factors like NDVI and LULC play critical roles in shaping transmission patterns.
The alignment of these results with global research reinforces the utility of NDVI and LULC as predictive tools for malaria risk. For example, studies in sub-Saharan Africa, such as those by [41,42], have demonstrated that integrating remote sensing data like NDVI into malaria surveillance systems enhances the ability to identify high-risk areas. This approach is particularly valuable in resource-constrained settings, where cost-effective strategies are essential. Tailored regional interventions, informed by these data, could significantly reduce malaria transmission. In West Nile, managing wetlands through targeted drainage or vegetation control could limit mosquito breeding sites, as suggested by [43], who concluded that decreasing vegetation biomass reduced mosquito refuge areas. In Ankole, regulating agricultural runoff and promoting efficient irrigation practices could minimize standing water, a strategy supported by [40], who found that biological mechanisms of water-saving agriculture and water-saving irrigation technologies, including low-pressure irrigation, furrow irrigation, plastic mulches, drip irrigation under plastic, rainfall harvesting, and terracing, will minimise wastage of water and reduce stagnant water.
Moreover, incorporating NDVI and LULC data into malaria surveillance systems offers a proactive, scalable approach to identifying high-risk areas. By combining these environmental indicators with traditional interventions like insecticide-treated nets (ITNs). Public health officials can prioritize resource allocation and implement timely control measures. This strategy aligns with the World Health Organization’s (WHO) global malaria control framework, which emphasizes integrated vector management (IVM) and data-driven decision-making [44]. For instance, real-time NDVI monitoring could guide the deployment of ITNs in high-risk rural areas or inform larval control campaigns in agricultural zones, as demonstrated in successful case studies from Ethiopia [45]. Our findings demonstrate statistically significant associations between NDVI/LULC and malaria cases (NDVI: IRR = 1.47, 95% CI 1.40–1.54); however, the weak bivariate correlation between NDVI and malaria cases (r = 0.048) reflects the crude, unadjusted relationship across all observations and does not account for spatial heterogeneity, seasonality, climatic variability, or temporal lags. In contrast, the fixed-effects negative binomial model estimates the association between within-district changes in NDVI and malaria cases after controlling for these factors. Consequently, NDVI may exhibit a weak overall correlation with malaria cases while still demonstrating a statistically significant independent association in multivariable regression. This pattern suggests that the influence of NDVI is partly obscured in crude analyses by substantial between-district variation and other environmental and contextual factors that determine malaria transmission.
This pattern mirrors East African studies where environmental variables alone explain only partial malaria variation [46]. Risk modeling in Kenya found vegetation indices significantly predicted intensity yet showed modest individual correlations, similar to our district-level analysis. Notably, [47] reported substantially higher correlations during rainy seasons (r = 0.80), suggesting temporal aggregation masks seasonal vegetation-transmission dynamics.
The Getis-Ord Gi* hotspot analysis demonstrates that malaria spatial distribution is distinctly non-random and driven by environmental proximity, consistent with geospatial studies across sub-Saharan Africa. High-confidence hotspots (95–99%) concentrated within 0–2 km of water bodies align with findings from Kenya, where 79% of cases occurred in lake endemic zones with 94% climate suitability [48]. Similarly, Ethiopian studies found mosquito breeding habitats concentrated 1–3 km from permanent water systems[49]. However, regional contrasts emerge in hotspot magnitude and stability. Kenya showed concentrated clustering in discrete lake zones, whereas Nigerian studies documented more dispersed patterns across multiple local government areas [50]. Cold spots in our study areas (>3–5 km from water bodies) mirrored patterns in built-up Nigerian zones but differed from highland areas, which showed persistent cold spots due to temperature constraints rather than proximity effects.
Temperature and humidity correlate strongly with transmission across regions, yet function differently: in naturally warm zones like Nigeria, temperature enables transmission, while in highland areas, it acts as a limiting factor [48]. Dense vegetation consistently supported malaria in all regions, though the composition varied naturally. Natural riparian vegetation dominated in lake zones versus agricultural land cover in Nigerian peri-urban areas[51].
Intervention effectiveness revealed important regional disparities. In Kenya’s lake endemic zone, 77% ITN coverage coexisted with 79% of all cases, suggesting environmental transmission potential overwhelms single interventions. Conversely, the 19-country sub-Saharan analysis found malaria prevalence substantially lower among ITN users (13.23%) versus non-users (32.75%), indicating stronger intervention-transmission relationships in moderate-transmission settings [52]. Hotspot temporal stability also differed: Nigerian hotspots remained consistent across 10 years, whereas Kenya showed gradual spatial shifts between 2015–2020, reflecting variable climate and intervention trajectories[51,52].
As an observational study, unmeasured socioeconomic factors (such as poverty, housing, and ITN coverage) likely confound the observed associations. [20] Demonstrated that environmental-only models explained only 30–40% of Ecuadorian malaria variation; integrated models incorporating socioeconomic drivers substantially improved prediction. Our annual LULC aggregation may underestimate effects by obscuring intra-seasonal agricultural and construction dynamics.
While Sentinel-2 NDVI data offer routine surveillance advantages (spatial coverage, cost-efficiency), integration faces persistent challenges: inconsistent availability, 2–4 week processing delays, and technical expertise barriers across African settings limit real-time application [36]. Satellite data should complement rather than replace facility-based reporting.
NDVI and LULC are meaningful ecological correlates but explain only part of district-level malaria variation. Future studies with higher temporal-resolution LULC data and explicit socioeconomic measurement would clarify satellite data utility for targeted interventions.
Limitations of the study
This ecological study documented associations between district-level vegetation density (NDVI) and reported malaria cases among children under five years in high-burden Uganda districts. After adjusting for seasonality, temporal lags, climate factors, and district fixed effects, district-level NDVI was associated with malaria cases. However, several critical limitations substantially restrict inference.
First, the ecological study design with district-month as the unit of analysis precludes causal inference at the individual level due to ecological bias. District-level associations cannot be assumed to reflect individual-level relationships; individuals within high-NDVI districts vary substantially in personal exposure to vegetation, mosquito vectors, and protective interventions.
Second, substantial unmeasured confounding likely biases effect estimates. Unmeasured individual-level factors (bed net ownership and use, indoor residual spraying exposure, treatment-seeking patterns, antimalarial drug availability and quality, socioeconomic status, and population immunity) co-vary with both NDVI and malaria cases but were unavailable at the district level.
Third, exposure misclassification, both from using 5-km buffers that may not capture actual population mobility and from NDVI as a proxy for entomological risk factors (vector breeding habitats, feeding behavior), likely biases associations toward or away from the null.
Fourth, weak bivariate correlation (r = 0.048) and modest effect sizes confirm that environmental variables explained minimal variation in malaria cases, consistent with malaria’s multifactorial nature. Despite these substantial constraints, satellite-derived vegetation indices may provide complementary ecological context for malaria surveillance systems (e.g., DHIS2) in high-transmission settings when interpreted alongside epidemiological, entomological, and programmatic data. Future research must employ individual-level prospective designs, integrate entomological surveys and vector competence assessments, measure individual-level protective interventions directly, and employ causal inference methods (e.g., instrumental variables, Mendelian randomization where applicable) to address confounding and distinguish associations from causal effects.
This ecological study documented associations between district-level vegetation density (NDVI) and reported malaria cases among children under five years in high-burden Uganda districts. After adjusting for seasonality, temporal lags, climate factors, and district fixed effects, district-level NDVI was associated with malaria cases (IRR = 1.47, 95% CI: 1.40–1.54). However, several critical limitations substantially restrict inference.
First, the ecological study design with district-month as the unit of analysis precludes causal inference at the individual level due to ecological bias. District-level associations cannot be assumed to reflect individual-level relationships; individuals within high-NDVI districts vary substantially in personal exposure to vegetation, mosquito vectors, and protective interventions.
Second, substantial unmeasured confounding likely biases effect estimates. Unmeasured individual-level factors (bed net ownership and use, indoor residual spraying exposure, treatment-seeking patterns, antimalarial drug availability and quality, socioeconomic status, and population immunity) co-vary with both NDVI and malaria cases but were unavailable at the district level.
Third, exposure misclassification, both from using 5-km buffers that may not capture actual population mobility and from NDVI as a proxy for entomological risk factors (vector breeding habitats, feeding behaviour), likely biases associations toward or away from the null.
Fourth, weak bivariate correlation (r = 0.048) and modest effect sizes confirm that environmental variables explained minimal variation in malaria cases, consistent with malaria’s multifactorial nature. Despite these substantial constraints, satellite-derived vegetation indices may provide complementary ecological context for malaria surveillance systems (e.g., DHIS2) in high-transmission settings when interpreted alongside epidemiological, entomological, and programmatic data. Future research must employ individual-level prospective designs, integrate entomological surveys and vector competence assessments, measure individual-level protective interventions directly, and employ causal inference methods (e.g., instrumental variables, Mendelian randomization where applicable) to address confounding and distinguish associations from causal effects.
What is already known about the topic
What this study adds
OGR: Conceptualized the study, designed the research framework, led the GIS processing and data harmonization (Sentinel-2 imagery, LULC classification, NDVI extraction), performed statistical analyses (correlation and negative binomial panel regression), interpreted results, drafted the initial manuscript, revised all sections, and coordinated the overall writing and submission process (corresponding author).
RW: Supported data acquisition and preprocessing (malaria cases from HMIS, environmental covariates), performed supplementary statistical checks and sensitivity analyses, prepared figures and tables (including LULC maps and spatial visualizations), and contributed to the writing of the results and methods sections
EK: Provided technical guidance on GIS and remote sensing methods (supervised classification, spatial aggregation to district boundaries), validated LULC and NDVI derivations, reviewed the analytical approach for robustness, and contributed to the discussion on policy implications and limitations
HN: Contributed to the literature review, provided expertise on malaria epidemiology and environmental drivers in Uganda, assisted with interpretation of spatial heterogeneity and district-level patterns, critically reviewed the methods and discussion sections, and contributed to multiple revisions.
PK: Assisted in data management, statistical modelling, and interpretation of environmental associations with malaria cases; contributed to drafting the results and discussion sections.
PN: Supported the review of literature on climate-malaria linkages, contributed to interpretation of findings related to vegetation and LULC, and assisted in revising the manuscript for clarity and public health relevance.
FM: Contributed to the conceptualization of spatial analysis, reviewed GIS methods and outputs, and assisted in interpreting district-level heterogeneity and its implications for malaria control.
MKM: Provided senior-level supervision on study design, epidemiological interpretation, and policy relevance; critically revised the manuscript for intellectual content and approved the final submission
Table 1: Health facilities under study
| Health Facility | District/Region |
|---|---|
| Kanawata | Kotido (Karamoja) |
| Rengen | Kotido (Karamoja) |
| Mirembe | Wakiso (Central) |
| Nadangira | Wakiso (Central) |
| Juru | Yumbe (West Nile) |
| Nakivale | Isingiro (Western) |
| Yoyo | Arua (West Nile) |
| Barakala | Arua (West Nile) |
| Table 2: Sensitivity analysis: comparison of district-month and facility-month environmental effect estimates | ||||||
|---|---|---|---|---|---|---|
| Exposure | Primary Analysis District-Month Level (n = 1,343 observations) |
Sensitivity Analysis Facility-Month Level (n = 864 observations) |
||||
| IRR | 95% CI | P | IRR | 95% CI | P | |
| NDVI (per 0.1 units) | 1.18 | 1.13–1.23 | <0.001 | 1.16 | 1.05–1.28 | 0.004 |
| LULC Urban (per 10%) | 0.92 | 0.87–0.97 | <0.001 | 0.94 | 0.82–1.08 | 0.382 |
| Temperature (per 1°C) | 1.08 | 1.04–1.12 | <0.001 | 1.07 | 0.98–1.17 | 0.143 |
| Table 3: Variables, measurement methods, data sources, units, and spatial resolution | ||||
|---|---|---|---|---|
| Variable | Measurement Method | Data Source | Units of Measurement | Spatial Resolution |
| Dependent Variable | ||||
| Malaria cases | Confirmed malaria cases among children 0–5 years per health facility | Local Health Centers | Confirmed cases among children 0–5 years | – |
| Independent Variables | ||||
| Vegetation Cover | Derived from satellite reflectance (NIR and RED bands) | MODIS | NDVI (-1 to +1) | 250 m |
| Rainfall | Measured via satellite-based precipitation estimates and ground stations | CHIRPS, Weather Stations | mm per month | 0.05° |
| Land Use and Land Cover | Classified into eight classes: trees, shrubs, agriculture, wetlands, built-up areas | Sentinel-2 multispectral imagery (processed in Google Earth Engine) | Proportion (%) of each category per facility | 10 m |
| Temperature | Measured via satellite or ground-based meteorological stations | ERA5, Weather Stations | °C (minimum and maximum) | 0.1° / 9 km |
| Table 4: Correlation Results | |||||
|---|---|---|---|---|---|
| Variable | Malaria Cases | Total Rainfall Amounts | Minimum Temperature | Maximum Temperature | Vegetation Cover |
| Malaria Cases | 1.000 | ||||
| Total Rainfall Amounts | 0.080*** | 1.000 | |||
| Minimum Temperature | 0.194*** | 0.328*** | 1.000 | ||
| Maximum Temperature | 0.175*** | 0.019*** | 0.702*** | 1.000 | |
| Vegetation Cover | 0.048*** | 0.355*** | 0.217*** | 0.130*** | 1.000 |
Note: *** p<0.001.
| Table 5: Model Diagnostics – Fixed Effects vs Random Effects | ||||||
|---|---|---|---|---|---|---|
| Diagnostic | Fixed-Effects | Random-Effects | ||||
| Log Likelihood | -5852.0 | -5902.6 | ||||
| AIC | 11740.0 | 11819.2 | ||||
| BIC | 11832.3 | 11855.1 | ||||
| Theta (dispersion) | 6.9716 | 0.0211 | ||||
| Alpha (overdispersion) | 0.1434 | 47.4238 | ||||
| Overdispersed? | Yes | Yes | ||||
| Residual Mean | 0.0017 | 0.0014 | ||||
| Residual Variance | 1.1010 | 1.0885 | ||||
| Residual Skewness | 1.3374 | 1.3345 | ||||
| Residual Kurtosis | 3.4370 | 3.4273 | ||||
| Note: Overdispersion (alpha > 0) confirms that the Negative Binomial model is appropriate. Residuals should be approximately normally distributed to support model adequacy. | ||||||
| Table 6: Relationship between vegetation density and Malaria cases | ||||||
|---|---|---|---|---|---|---|
| Malaria Cases | Coef. | St. Err. | t-value | p-value | 95% Confidence Interval | Sig. |
| NDVI | 0.38635 | 0.0240 | 16.0900 | 0.0000 | 0.3393 – 0.4334 | *** |
| Constant | -0.0696 | 0.0138 | -5.0400 | 0.0000 | -0.0966 – -0.0424 | *** |
| ln(alpha) | -0.0293 | 0.3446 | -0.7050 – 0.6463 | |||
| ln(s) | 3.3455 | 0.4406 | 2.4820 – 4.2091 | ** | ||
| Mean dependent var | 85.850 | SD dependent var | 135.895 | |||
| Number of obs | 44,624 | Chi-square | 258.975 | |||
| Prob > chi² | 0.000 | Akaike crit. (AIC) | 454291.604 | |||
| Note: *** p<0.01, ** p<0.05, * p<0.10. | ||||||
| Table 7: Summary of Hot and Cold Spots by Region | |||
|---|---|---|---|
| Region | Hotspot Characteristics | Cold Spot Characteristics | Interpretation |
| Wakiso | Dense vegetation, wetlands, lakeshore proximity (Lake Victoria) | Built-up urban areas, low vegetation, distant from water bodies | Strong clustering driven by vegetation and hydrology |
| West Nile | Woodland/grassland near rivers and seasonal wetlands | Sparse vegetation, drier areas, far from major water sources | Moderate clustering influenced by seasonal water availability |
| Central (Other Districts) | Mixed vegetation, peri-urban wetlands, agricultural zones | Urbanized areas with infrastructure and drainage systems | Mixed clustering influenced by both environment and urbanization |
| Eastern Region | Irrigated farmland, wetlands, and flood-prone areas | Elevated or drier zones with less vegetation | Clustering linked to irrigation and flood dynamics |
| Northern Region | Bushland and seasonal water bodies | Arid/semi-arid zones with minimal vegetation | Weaker clustering due to limited stable breeding sites |