
Research | Open Access | Volume 9 (4): Article 190| Published: 12 Nov 2026

Views: 70
Menu, Tables and Figures
| Table 1: Platform records, sampled linkage checks and selected implementation milestones, Sierra Leone, June 2026 reporting endpoint. | ||
| Indicator | Value | 95% CI / note |
|---|---|---|
| Total integrated death records | 33,305 | Not applicable |
| Unique decedents after deduplication | 32,234 (96.8% of records held) | Not applicable |
| Duplicate records identified across sources | 1,071 (3.2%) | Not applicable |
| Data-source connections live | 3; two volume-bearing sources | Not applicable |
| Source contribution: civil registration (NCRA) | 23,323 (70%) | Not applicable |
| Source contribution: verbal autopsy program (HEAL-SL) | 9,979 (30%) | Not applicable |
| Source contribution: disease surveillance (eIDSR/DHIS2) | Connector live; 3 records; source data sparse | Not applicable |
| Geographic representation in available records | All 16 districts | Not applicable |
| Place of death: health facility | 14,420 (43.3%) | Not applicable |
| Place of death: community (outside facility) | 18,885 (56.7%) | Not applicable |
| Deaths with a medically certified or physician-coded cause | 10,124 (30.4%) | Not applicable |
| Legacy death-to-source-date interval within 48 hours | 26,777 of 33,305 (80.4%) | Unharmonised endpoints; see note |
| Legacy mean death-to-source-date interval | Mixed-source endline: 5.1 days (SD 9.8); civil-registration baseline: 14.0 days (SD 21.3) | Not directly comparable |
| Legacy median death-to-source-date interval | Mixed-source endline: 2 days (IQR 1-5); civil-registration baseline: 6 days | Not directly comparable |
| Sex distribution: male / female | 18,502 (55.6%) / 14,799 (44.4%) | Not applicable |
| Six-field completeness (600 records per round) | 91.4% first assessment; 99.9% second assessment | Not estimable from rounded composite summaries |
| Civil-registration records missing an ICD-coded cause | 3,299 (14.1% of source; 9.9% of all records) | Not applicable |
| Algorithm agreement in blinded flagged-pair review | 196 of 200 (98%) | 95.0 to 99.2 |
| Programme-reported inter-adjudicator agreement (Cohen kappa) | 0.94 | 0.88 to 1.00 (reported) |
| Missed-match yield in reviewed near-miss pairs | 6 of 500 (1.2%) | 0.6 to 2.6 |
| Indicator-framework revision milestone | 16 January 2026; 206 elapsed days | Not applicable |
| Offline district-dashboard deployment milestone | 4 March 2026; 253 elapsed days | Not applicable |
| HEAL-SL cooperation agreement concluded | April 2026; elapsed-day bounds 281-310 | Calendar bounds, not an exact event date |
| Legal review of the agreement before written escalation | Approximately 4 months: October 2025-February 2026 | Not applicable |
| HEAL-SL feed activation after agreement conclusion | Reported within 14 days of conclusion | Relative interval; no assumed transfer date |
Counts cover deaths occurring from 1 January 2022 to 18 June 2026. CI, confidence interval; DHIS2, District Health Information Software 2; HEAL-SL, Health Evaluation and Applied Learning in Sierra Leone; ICD, International Classification of Diseases; IQR, interquartile range; NCRA, National Civil Registration Authority; SD, standard deviation. Percentages use 33,305 records unless stated; sex percentages use 33,301 records with sex recorded. Complete platform counts carry no inferential CI. Wilson intervals accompany sampled linkage proportions. An ICD code alone does not establish medical certification. Kappa and its interval are programme-reported; the paired-rater classifications are not reproduced. Platform totals do not estimate national coverage or representativeness.
Completeness (%) = non-missing entries / 3,600 expected entries x 100 (600 sampled records x six fields). The two samples were drawn separately. The automatically assigned identifier raises the composite. Sampling uncertainty was not quantified; no independence assumption is made across the six fields within a record. Timing values are legacy programme summaries: baseline civil-registration data and mixed-source endline data use non-equivalent or insufficiently specified endpoints. They are not evidence of improved reporting speed or of verbal-autopsy completion within 48 hours (Supplementary Table S17).
Milestone intervals are elapsed calendar days from 24 June 2025 (day 0). They mark selected deliverables, not whole-layer closure. April 2026 corresponds to days 281-310; these are calendar bounds, not signature or effective dates. Feed activation is reported relative to agreement conclusion (within 14 days), not assigned an assumed calendar day. The approximately four-month review period ends at the February 2026 escalation, before the April conclusion.
Table 1: Platform records, sampled linkage checks and selected implementation milestones, Sierra Leone, June 2026 reporting endpoint.
Eric Nzirakaindi Ikoona1,&, Lucy Namulemo2, Michael Kamara1, Aminata Koroma1, Mary Magdalene Sinnah1, Mohamed Alex Vandi1, Foday Sahr1
1Office of the Executive Director, National Public Health Agency (NPHA), Freetown, Sierra Leone, 2Care, Treatment, and Support Coordination Office, Foothills Community-Based Interventions, Monticello, Kentucky, United States of America.
&Corresponding author: Eric Nzirakaindi Ikoona, National Public Health Agency, Freetown, Sierra Leone, Email: ikoonae@yahoo.com ORCID: https://orcid.org/0000-0003-3402-1961
Received: 24 Jun 2026, Accepted: 02 Nov 2026, Published: 12 Nov 2026
Domain: Health Informatics
Keywords: mortality surveillance, health information systems, interoperability, data governance, Sierra Leone
©Eric Nzirakaindi Ikoona et al. Journal of Interventional Epidemiology and Public Health (ISSN: 2664-2824). This is an Open Access article distributed under the terms of the Creative Commons Attribution International 4.0 License (https://creativecommons.org/licenses/by/4.0/), which permits unrestricted use, distribution, and reproduction in any medium, provided the original work is properly cited.
Cite this article: Eric Nzirakaindi Ikoona et al., Developing a national mortality surveillance dashboard in Sierra Leone: Implementation experience and governance lessons. Journal of Interventional Epidemiology and Public Health. 2026; 9(4):190. https://doi.org/10.37432/jieph-d-26-00195
Introduction: Mortality data in many low- and middle-income countries remain fragmented. We documented how Sierra Leone developed a dashboard to integrate civil registration, disease surveillance and verbal autopsy, the barriers encountered, and implementation lessons for other settings.
Methods: We analysed dashboard implementation from June 2025 to June 2026 within an ongoing national surveillance programme using a convergent mixed-methods implementation-science approach. Quantitative evidence comprised monitoring indicators, platform summaries, sampled data-quality assessments, linkage checks and milestone dates. Qualitative evidence comprised routine programme and governance documents, stakeholder meeting notes and system-testing observations. The strands were analysed separately and compared in a joint display. Analyses were descriptive.
Results: Development produced a shared mortality warehouse, three technically live source connections, 47 common data elements with ICD-11 cause mapping, automated validation and deduplication, and national and two pilot-district dashboard views. Civil registration and verbal autopsy supplied records at useful volume; eIDSR/DHIS2 transferred three records because mortality data in the source instance were sparse. User testing and stakeholder review generated 63 change requests, of which 48 were implemented. The indicator framework was revised 206 elapsed days after inception and offline district dashboards were deployed at 253 days; these milestones did not establish complete functional interoperability. The HEAL-SL technical cooperation agreement for dashboard integration concluded in April 2026 following approximately four months in legal review before escalation; the feed began within two weeks. Data ownership and NPHA’s existing surveillance authority remained unchanged. The experience informed a practical pathway covering source mapping, common standards, technical collaboration, user testing, phased deployment and government hosting. Source reporting and cause-of-death quality remained constraints.
Conclusion: Technical connectivity alone did not ensure usable mortality data flow. The HEAL-SL sequence illustrated the coordination required for technical integration, whereas eIDSR exposed a source-reporting gap. Coordinating institutional responsibilities, common definitions, technical development and continuing user feedback offers a practical approach for adaptation. The pathway and its proposed benefits require prospective testing in other settings.
Reliable mortality data support planning, resource allocation and accountability [1]. Many deaths remain unregistered, and cause of death is unknown for most people who die in low-income countries [2,3]. Countries with better functioning civil registration report better health outcomes [4]. Global assessments identify data quality as a common limitation even where registers exist [5]. Cause-of-death statistics require a shared classification, including ICD-11 [6]. Timely mortality data also support the International Health Regulations and health-related Sustainable Development Goals [7,8]. Since 2015, the Bloomberg Philanthropies Data for Health Initiative supported civil registration, verbal autopsy and mortality data use [9].
Mortality data in many low- and middle-income countries are collected through multiple systems and data sources. These include civil registration and vital statistics, health-facility and community reporting, disease surveillance, sample-based mortality surveillance, and verbal autopsy programs or surveys. Sources differ in coverage, reporting intervals, ownership, coding practices and level of digitization. Interoperability, the ability of systems to exchange and use each other’s data, spans three layers [10,11]. Technical interoperability covers infrastructure and exchange. Semantic interoperability covers shared definitions, data elements and coding. Organizational interoperability covers governance: the ownership, stewardship and agreements that permit institutions to exchange data. Reviews identify ownership, trust and missing agreements as leading barriers to public health data sharing [12]. Published accounts provide limited detail on how national teams sequence the three layers, maintain use during partial integration and resolve institutional blockages.
This paper documents how Sierra Leone integrated three priority mortality sources (civil registration, disease surveillance and verbal autopsy) into a shared dashboard within an ongoing national surveillance programme. The objectives were to: describe the dashboard and its implementation strategy; document operational outputs and data-quality constraints; examine the sequence of technical, semantic and organisational work; and derive practical implementation lessons for adaptation and testing elsewhere. Platform statistics support this implementation account rather than estimate national mortality patterns.
Local context
Sierra Leone has 16 districts, which cover the whole country, and records about 70,000 deaths each year. Only a small proportion receive medical certification [2]. The electronic Integrated Disease Surveillance and Response system runs on District Health Information Software 2 across 1,564 facilities and captures deaths linked to 26 priority conditions [13]. Regional reviews show that the system supports condition notification instead of complete death counting [14]. HEAL-SL assigns causes to a sample of community deaths and operates through the public health agency and an academic partner [2].
Before this project, the three priority sources operated separately, each under its own institution, format and rules. No common framework coordinated their integration into one mortality dashboard (Supplementary Table S4). Each source assigned its own record identifier, and no common person identifier linked them. Fragmented surveillance contributed to delayed event recognition during the 2014-2016 Ebola epidemic [15]. Section 12 of the Public Health Act, 2022 (Act No. 17 of 2023) establishes NPHA; section 12(3) assigns responsibilities for strengthening public-health systems and collecting, collating and analysing data [16].
Dashboard development and integration
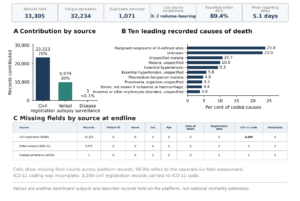
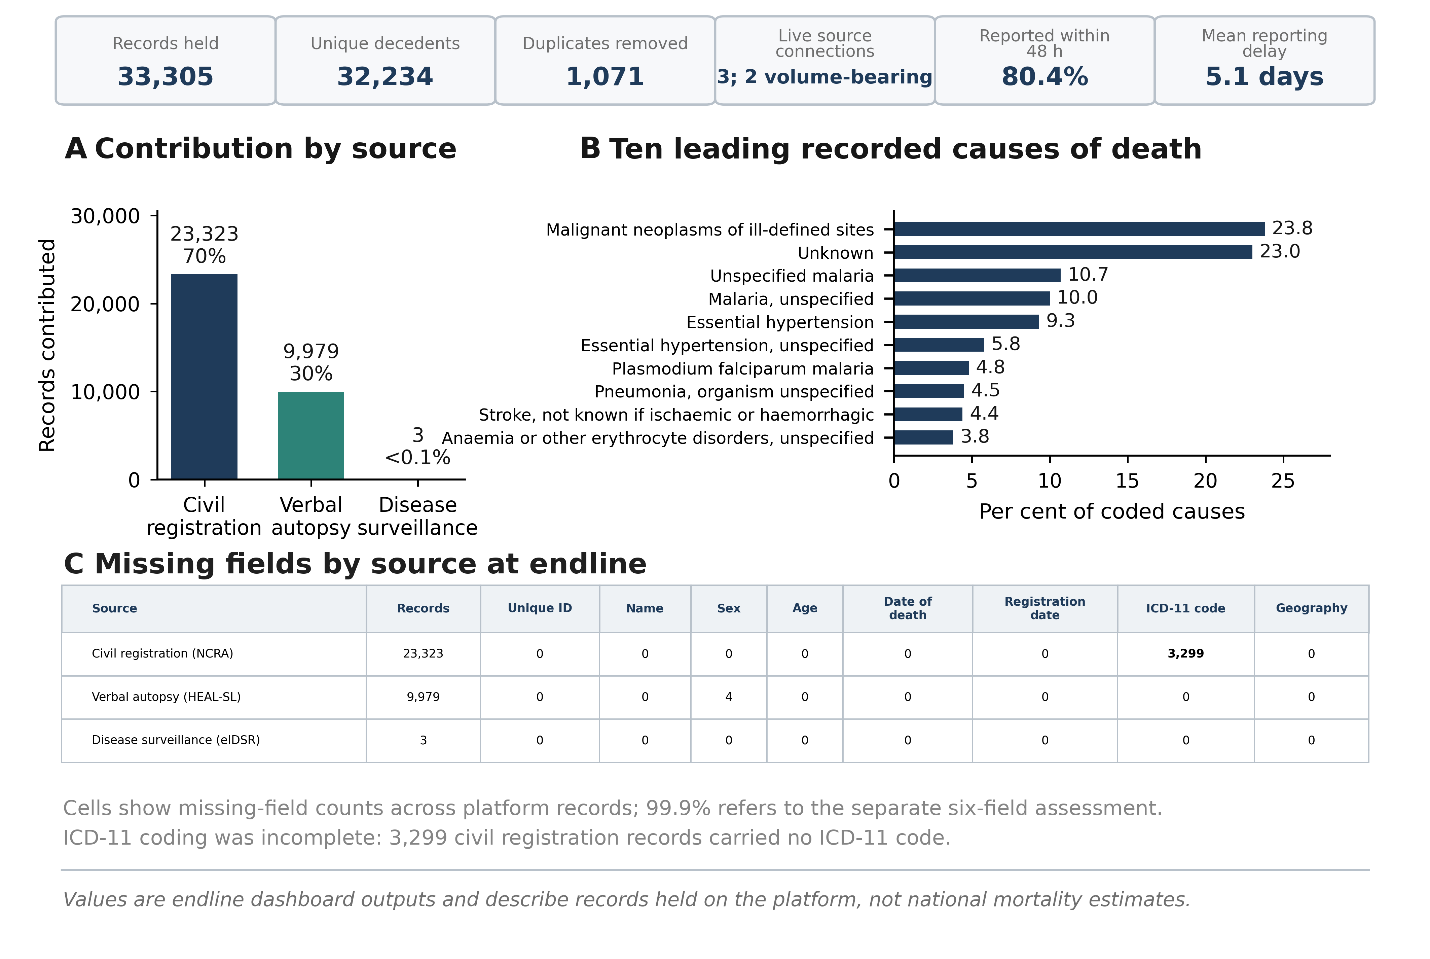
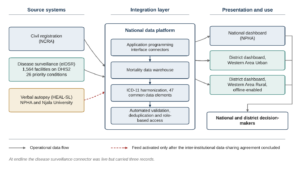
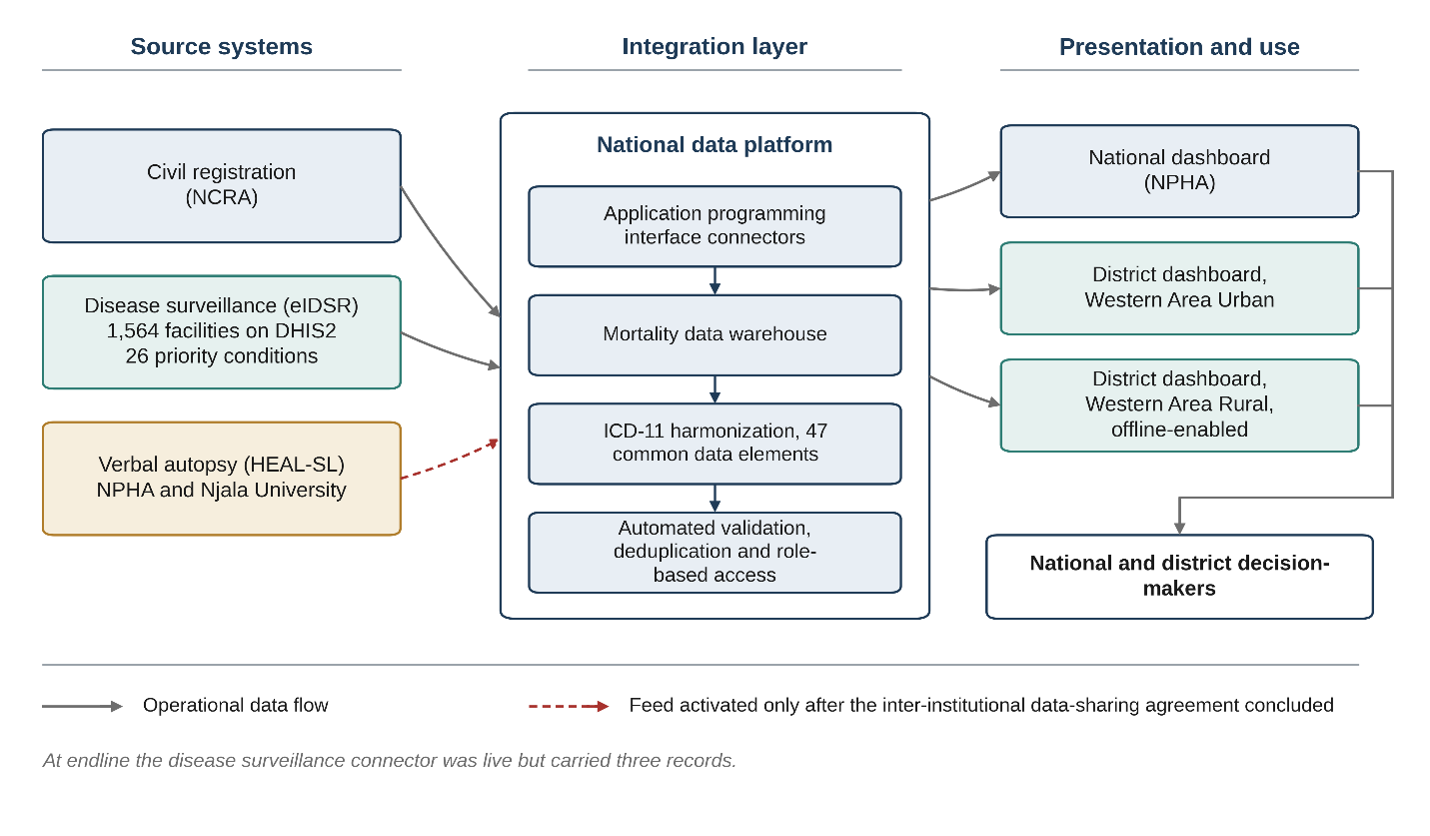
The dashboard connected civil registration, verbal autopsy and disease surveillance, although disease surveillance supplied only three records. The platform followed the World Health Organization classification of digital health interventions [17] and used District Health Information Software 2, which already supported national surveillance [18]. The architecture combined a mortality data warehouse, source-specific connectors (application programming interfaces that transfer records automatically), a custom verbal-autopsy module, automated validation and rule-based deduplication. Figure 1 illustrates platform outputs, Figure 2 shows the system architecture, and Supplementary Table S1 maps development activities to phases and interoperability layers.
Semantic integration used 47 common data elements, a national data dictionary and ICD-11 cause mapping based on the WHO verbal-autopsy instrument [6,19]. These specifications did not establish the quality of every source value. The presentation layer included national, geography and equity views, interactive maps and trend charts, and offline district dashboards for low-connectivity settings.
Design
This paper analyses NPHA’s continuing national mortality-surveillance dashboard programme during June 2025-June 2026 using convergent mixed methods [20]. The dashboard is designed for real-time integration using agreed common variables. Daily engagement, testing, data-quality review and performance evaluation continue independently of publication. This paper shares the experience for other countries; the reporting window does not end surveillance. Quantitative and qualitative evidence were analysed separately and compared for agreement, expansion or discordance [21]. The integration process was the unit of analysis. The dashboard was the intervention; implementation combined coordination, source mapping, common standards, technical integration, user testing, training and handover. Reporting follows StaRI [22], mERA [23] and GRAMMS [24] (Supplementary Tables S12-S14); S2 describes the evidence, and S15 defines terms.
Setting, participants and governance
The national platform received records from national source systems covering all 16 districts. District dashboards, offline deployment, training and data-quality assessments took place in Western Area Urban and Western Area Rural, selected for registration volume and contrasting connectivity. Five constituencies participated: NPHA including HEAL-SL, the Ministry of Health, NCRA, and the two district health management teams. Njala University participated as HEAL-SL’s academic partner. The Technical Working Group comprised 14 members and held 11 of 12 scheduled meetings. Its functions were to endorse common data elements and indicators, clarify stewardship and access, monitor cooperation arrangements, review data quality and escalate blocked decisions. Co-design included a requirements workshop, user-acceptance testing with 35 participants and a scaling workshop with 38 participants.
Quantitative strand
Platform analytics covered deaths from 1 January 2022 to 18 June 2026. A 12-indicator framework supplied programme baselines and targets (Supplementary Tables S3-S4). November 2025 and May 2026 assessments followed WHO Data Quality Review dimensions [25]. Each assessment randomly sampled 600 civil-registration records, 300 per pilot district, against registrar registers. Six-field completeness covered record identifier, sex, age, death date, registration date and geography: non-missing entries divided by 3,600 expected entries, multiplied by 100. The automatically assigned identifier increased the composite; the score is not equivalent to accuracy. Records were sampled separately in each round. Milestones were measured in elapsed calendar days from 24 June 2025; month-only dates were represented by calendar bounds rather than an assumed execution day (Supplementary Table S5). They describe selected outputs, not closure of whole interoperability layers. Tested interfaces established technical connectivity; usable routine record flow established a volume-bearing connection. Indicators described implementation outcomes [26] and mortality-surveillance functions [27,28]. Legacy reporting-delay summaries used death-to-registration/entry intervals, with a civil-registration-only baseline and a mixed-source endline. Because non-registration endpoints were not sufficiently specified in the programme summaries, we do not interpret these as comparable reporting-speed estimates or verbal-autopsy interview intervals. Supplementary Table S17 records the definitions and limitations.
Record linkage and deduplication
The sources shared no common person identifier. We applied three hierarchical deterministic rules to records from the same district and year of death. Rule 1 used the national identification number where present in both records. Rule 2 used normalised names, sex, exact death date and district. Rule 3 used normalised names, sex, birth date or age within one year, district and death date within three days. Pairs entered manual review when at least two identifiers agreed without satisfying a rule, or when sex conflicted or age differed by more than five years. Two officers adjudicated independently; a third resolved disagreements. Of 1,438 candidate pairs, 1,071 were matches, 352 non-matches and 15 unresolved pairs retained as distinct. Removing one record per match reduced 33,305 records to 32,234. A random sample of 200 flagged pairs was re-reviewed without the algorithm classification; a separate random sample of 500 near-miss pairs assessed missed matches within that candidate set. The full near-miss pool was unavailable, preventing estimation of record-level residual duplication. No labelled training set supported probabilistic linkage [29,30] (Supplementary Table S6).
Qualitative strand
Qualitative evidence comprised 41 programme documents (specifications, procedures, manuals, mission and data-quality reports, the change register and correspondence), 14 governance records (minutes, action logs and escalation memoranda), two observation records and notes from 22 semi-structured implementer debriefs. A structured observation guide covered use, resistance, workarounds and decisions during prototype testing and the scaling workshop. Purposive maximum-variation recruitment to programme debriefs covered institutional constituency, district and role, including data managers, surveillance officers, registrars, verbal-autopsy coordinators, physician coders and information-technology staff. Debriefs lasted 20-40 minutes and used an English topic guide on expectations, blockages, decisions and perceived value. No new codes appeared after debrief 19; three confirmatory debriefs supported code saturation. Contemporaneous notes were expanded within 24 hours. The publicly available records arose from routine programme work; these counts describe the analysed material, not all consultations within daily engagement. Participation was voluntary. No personal health information was collected from stakeholders, and no attributable quotations are reported.
Analysis and integration
Two analysts used the framework method to chart coded material into a source-by-theme matrix [31]. They independently coded six documents and six feedback-note sets to develop the framework. Deductive categories came from interoperability layers and Consolidated Framework for Implementation Research domains [32]; inductive codes captured additional material. Coding differences were resolved before applying the framework to the corpus. An advisor outside the build checked the matrix against source material, and seven stakeholders reviewed themes. A joint display classified the relationship between quantitative and qualitative evidence as confirmation, expansion or discordance [33] (Supplementary Table S7). Quantitative analysis remained descriptive; the design did not support causal attribution. Complete platform counts and percentages carry no inferential confidence intervals. Wilson 95% intervals accompany sampled linkage proportions [34]. Cohen kappa describes inter-adjudicator agreement [35]. Sampling uncertainty for the composite completeness score was not quantified. The six fields within each record were not treated as independent observations; the assessment percentages remain descriptive programme summaries.
Ethics consideration
The dashboard is a continuing national programme within NPHA’s routine surveillance function under section 12(3) of the Public Health Act, 2022 [16]; this paper describes and analyses the implementation of the dashboard. SLESRC determination SLESRC-2026-011, dated 7 October 2026, after the reporting window, classified the described programme activities and their documentation and reporting as public-health practice not requiring research ethics approval. Stakeholders participated voluntarily in routine programme meetings and structured debriefs. Written consent was obtained as a standard procedure at all programme meetings for use of meeting contributions and related materials in programme documentation and publications, including photographs. No meeting photographs were used in this manuscript. NCRA and eIDSR/DHIS2 access used existing programme arrangements. NPHA owned and used HEAL-SL data for surveillance before the April 2026 technical cooperation agreement. The agreement organised dashboard integration, not ownership transfer or new surveillance authority. HEAL-SL linkage within this dashboard began after the agreement as an implementation milestone. Identifiable records remained protected by role-based access and encryption; only aggregate, non-identifiable data are reported in this publication [36]. The Committee-issued determination, technical cooperation agreement, written-consent documentation, and supporting meeting records are available to the editor on request.
Dashboard development, integration and milestone sequence
Development produced the warehouse, source-specific interfaces, common data specifications, automated validation and deduplication, role-based access, encrypted exchange, and national and two district dashboard views. User testing and stakeholder review generated 63 change requests, of which 48 were implemented. The team completed standard operating procedures, manuals and four reporting templates, prepared six master trainers, and transferred hosting to the Health Data Management Unit.
The Technical Working Group was constituted on 24 June 2025 (day 0). Common data elements were agreed on 12 August 2025 (49 elapsed days). The warehouse and civil-registration connector became operational on 18 September 2025 (86 days), and the eIDSR/DHIS2 link was tested on 6 November 2025 (135 days). Indicator-framework revision followed on 16 January 2026 (206 days) and offline district deployment on 4 March 2026 (253 days). These were implementation milestones, not evidence of complete semantic quality or technical functionality (Table 1; Supplementary Table S5).
Endline platform performance
At the reporting endpoint, the platform held 33,305 records for deaths from 1 January 2022 to 18 June 2026 across all 16 districts. Deduplication removed 1,071 records (3.2%) and retained 32,234 unique decedents (96.8% of records held), not an estimate of national mortality coverage. Civil registration contributed 23,323 records and HEAL-SL 9,979. The technically live eIDSR/DHIS2 connector transferred three records because the mortality data expected in that source instance were largely absent. This was a source-data availability problem rather than evidence of a failed connection.
The dashboard displayed place of death, certification and source contribution across available records (Table 1; Figure 1). These outputs demonstrated integration capability, not nationally representative mortality patterns. Legacy timing summaries are retained for transparency but not interpreted as a change in reporting performance because the baseline and endline used different source mixes and incompletely specified endpoints (Supplementary Table S17).
Excluding HEAL-SL reduced the certified or physician-coded share from 10,124/33,305 (30.4%) to 145/23,326 (0.6%), and the community-death share from 18,885/33,305 (56.7%) to 9,405/23,326 (40.3%) (Supplementary Table S8). This comparison describes the information contributed by that feed, not an intervention effect or a population estimate.
Linkage validation and data quality
Blinded re-review agreed with the algorithm in 196/200 flagged pairs (98.0%; Wilson 95% CI 95.0-99.2). Programme-reported inter-adjudicator kappa was 0.94 (reported 95% CI 0.88-1.00; Supplementary Table S6). Six of 500 near-miss pairs were true matches (1.2%; 95% CI 0.6-2.6). Six-field completeness was 91.4% and 99.9% in separate 600-record samples; those assessments recorded 412 and 7 consistency violations. Violation counts were not treated as numbers of distinct affected records. Of 23,323 civil-registration records, 3,299 lacked a cause code. Subtraction from the platform total gives 30,006 coded records. The dashboard displayed malignant neoplasms of ill-defined sites (23.8%) and unknown cause (23.0%) as leading labels, with duplicate labels for some conditions. These outputs signal coding-quality problems, not validated disease burden.
Programme monitoring recorded five uses of dashboard outputs. The implementation narrative describes indicator-framework revision towards rates, ratios, place of death, certification and timeliness; district mortality review; and cause-of-death coding correction in Western Area Rural. These examples illustrate the reported uses without treating categories as five independently dated decisions (Supplementary Table S17). Daily engagement supported continuing refinement rather than five isolated consultation events. Training reached both pilot districts, and six of ten planned master trainers were prepared.
Implementation experiences
Programme feedback described technical work as more predictable once specifications were agreed. Technical collaboration required clarification of institutional responsibilities and a route for resolving stalled integration tasks; NPHA’s ownership and existing surveillance use of HEAL-SL data were not dependent on that collaboration. Legal review of the technical cooperation agreement lacked an assigned action owner or scheduled time, although software, training and travel were budgeted. Civil-registration outputs supported early dashboard review while HEAL-SL integration arrangements were completed. Some users interpreted the near-empty eIDSR panel as system failure. Feedback linked the trainer shortfall to competing routine duties and insufficient protected time.
Integration of the two strands
The joint display showed agreement between monitoring and programme accounts on deployment and user-driven refinement (Supplementary Table S7). Sustainability showed expansion: institutional hosting was documented, while feedback identified protected staff time as an additional condition. Data flow showed discordance: monitoring counted the tested eIDSR link as connected, whereas district users did not regard a three-record feed as functionally useful. These findings distinguish installed capability from routine surveillance use.
Institutional cooperation and activation of the verbal-autopsy feed
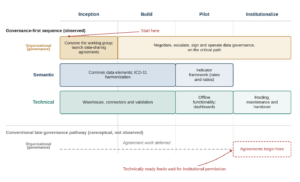
The agreement among NPHA, the Ministry of Health and Njala University organised technical collaboration for dashboard integration, not permission for NPHA to use its HEAL-SL data. Drafting began in July 2025 and legal review in October 2025. After approximately four months, written escalation in February 2026 assigned an action owner and target date. The agreement concluded in April 2026, corresponding to 281-310 elapsed days from inception at the available monthly resolution. Project-specific cross-source linkage using HEAL-SL identifiers began after the technical cooperation agreement took effect; programme records report feed activation within two weeks. This chronology concerns the new dashboard workflow, not the start of NPHA’s ownership, access or routine surveillance use. The record does not separately resolve signature, effective and first-transfer days. It illustrates coordination of technical implementation, not a causal ranking of interoperability layers.
Framework derived from the implementation experience
The implementation findings informed five propositions concerning early cooperation arrangements, phased source integration, support for low-connectivity use, government hosting and decision-relevant indicators. We retain these as hypotheses rather than validated recommendations. The readiness self-assessment, maturity matrix and sequencing roadmap organise the experience for adaptation (Supplementary Tables S9-S11; Figure 3).
For practical use, Supplementary Table S16 translates the documented activities into ten steps: establish mandate and coordination; map sources; agree common data standards; define use cases and indicators; design architecture and security; build and validate source connections; specify technical cooperation arrangements; test with users; pilot under routine conditions; and institutionalise and plan scale-up. Each step specifies an output and readiness question. Technical cooperation starts at inception and proceeds alongside development. Existing surveillance authority, technical responsibilities and confidentiality safeguards are documented separately; a new technical agreement does not itself establish data ownership or surveillance authority. This is an implementation aid derived from one setting, not a validated strategy or evidence of completed national scale-up.
Sierra Leone’s experience illustrates how technical, semantic and organisational work interact during mortality-data integration. A live connector did not ensure useful record flow, and common specifications did not ensure valid source coding. HEAL-SL integration required coordination of technical collaboration across institutions; the agreement did not establish NPHA’s ownership of, or authority to use, the underlying data. These findings concern implementation in one setting, not comparative effectiveness of an integration strategy.
Public-health data-sharing research identifies ownership, trust and institutional arrangements as recurrent concerns [12], and African health-information-exchange reviews treat governance as a prerequisite [10]. Implementation frameworks likewise recognise policy and interorganisational relationships [32]. Suriname’s digital death-certificate system combined offline operation and ICD-11 integration within one ministry [37]. Sierra Leone required cooperation across government and an academic partner, without a transfer of HEAL-SL data ownership. Uganda reported coordination and capacity gaps [38]; clearer institutional duties supported DHIS2 reporting [39]; and Ghana linked surveillance performance to core and support functions [40]. Verbal-autopsy guidance emphasises mandates, custody and use [41,42], while SCORE treats governance as a system function [43]. Slovenia documented authorisation and regulatory constraints [44], and a 13-country evaluation identified government ownership and interagency cooperation as common implementation conditions [45].
Lessons for other countries
What worked. Early agreement on 47 common data elements provided a shared starting specification; subsequent indicator revision shows that semantic work continued. Daily engagement, formal user testing and stakeholder review supported iterative changes and attention to decision-relevant measures. Offline dashboards were deployed in both pilot districts, but their independent contribution to sustained use was not measured. Hosting moved into government operations.
What remained incomplete. Completion of the HEAL-SL technical cooperation arrangements preceded activation of the new integration feed, while sparse eIDSR mortality reporting limited another source independently. Ill-defined, unknown and duplicate cause labels showed continuing semantic-quality problems despite mapped fields. Agreement completion, connector testing and indicator specification therefore mark different implementation outputs, not interchangeable thresholds for functional integration or evidence of newly acquired surveillance authority.
Operational responses and propositions for testing. Written escalation assigned responsibility for the stalled technical cooperation process. Continuing district support supervision addresses mortality entry into DHIS2, while coding review addresses source-data quality. These responses target different problems. Earlier specification of technical responsibilities, named escalation routes, phased integration under existing surveillance authority and protected trainer time may improve implementation; their effects require prospective testing rather than inference from this chronology alone.
Generalizability
The findings and planning tools arise from one country and legal setting. Other countries can adapt the sequence to their source systems, mandates, connectivity and workforce, while testing whether early cooperation work, phased deployment and continuing user feedback improve implementation. Neither the ten-step checklist nor the broader framework is a validated international standard.
Limitations
The single-country design lacked a comparator and effectiveness outcomes. Three sources were technically connected, but only two supplied useful volume and district deployment covered two pilot districts. Selected milestones did not establish complete interoperability; HEAL-SL agreement timing was recorded at monthly rather than daily resolution. Unharmonised reporting endpoints prevent a like-for-like timeliness comparison. The completeness summaries do not include design-appropriate confidence intervals. Deterministic linkage lacked a population-level gold standard, and an unavailable near-miss sampling frame prevented estimation of residual duplication [30]. Programme notes may selectively record favourable experiences. Several authors implemented the platform; independent matrix review and stakeholder feedback reduced, but did not eliminate, this risk. Real-time transfer latency, uptime, load performance, security incidents, cost-effectiveness and health outcomes were not evaluated. Platform records do not establish national mortality coverage or representativeness.
Usable mortality-data integration depended on more than technical connection. The HEAL-SL feed began soon after cooperation arrangements concluded, while sparse eIDSR source reporting persisted despite a live interface. Common data standards, user testing, source-quality improvement and institutional coordination therefore require continuing attention within surveillance operations. Sierra Leone’s experience provides practical steps for local adaptation; the proposed benefits of earlier cooperation work and phased implementation require testing in other settings.
What is already known about the topic
What this study adds
Several authors hold NPHA leadership, advisory or implementation roles and participated in developing the programme described here. These roles constitute potential non-financial competing interests and informed access to records and interpretation. The authors declare no other competing interests.
Patient and public involvement
Patients and the public were not recruited as research participants. District health officials and institutional stakeholders joined implementation design, prototype testing and the national scaling workshop. Their program feedback shaped dashboard indicators and usability.
Data availability
Public programme records and aggregate surveillance summaries underpin this manuscript. Supplementary Tables S1-S17 provide implementation summaries, the joint display, technical definitions and practical planning tools. The anonymised charted matrix is available from NPHA on reasonable request. Individual mortality records remain under institutional access controls and are not publicly disclosed. The readiness tools may be reused for noncommercial public-health purposes with attribution.
Financial support came through the Bloomberg Philanthropies Data for Health Initiative, Global Grants Program, under grant GGP145, with the African Field Epidemiology Network as fiscal agent. The funder supported technical exchange and monitoring. It played no role in data collection, analysis, interpretation, manuscript writing or the decision to submit.
We thank the leadership of the National Public Health Agency of Sierra Leone and its data, surveillance, and information and communication technology teams. We thank the Technical Working Group and its member institutions: the Ministry of Health, National Civil Registration Authority, and district health management teams of Western Area Urban and Western Area Rural. District officials, supervisors and data officers contributed to design, prototype testing, the national scaling workshop and training. Implementers contributed to routine programme consultations. Njala University served as the national verbal autopsy partner. The Health Information Systems Programme South Africa and Centre for Global Health Research at the University of Toronto supported software development, technical exchange and remote support. We thank the local master trainers, Bloomberg Philanthropies Data for Health Initiative, and African Field Epidemiology Network. We also thank officials and partners who reviewed the dashboard and improved its indicators and usability. None of those acknowledged are authors.
Conceptualization: Eric Nzirakaindi Ikoona,
Methodology: Eric Nzirakaindi Ikoona, Lucy Namulemo, Michael Kamara
Data Curation: Eric Nzirakaindi Ikoona, Lucy Namulemo, Michael Kamara, Mary Sinnah, Mohamed Alex Vandi, Foday Sahr
Formal Analysis: Eric Nzirakaindi Ikoona, Lucy Namulemo, Michael Kamara, Aminata Koroma, Foday Sahr
Investigation: Eric Nzirakaindi Ikoona, Lucy Namulemo, Aminata Koroma
Funding Acquisition: Lucy Namulemo, Foday Sahr
Project Administration: Eric Nzirakaindi Ikoona, Lucy Namulemo, Aminata Koroma, Mary Sinnah, Mohamed Alex Vandi, Foday Sahr
Resources: Eric Nzirakaindi Ikoona, Mohamed Alex Vandi
Software: Eric Nzirakaindi Ikoona, Lucy Namulemo
Validation: Eric Nzirakaindi Ikoona, Lucy Namulemo, Michael Kamara, Mary Sinnah, Foday Sahr
Visualization: Eric Nzirakaindi Ikoona, Lucy Namulemo, Michael Kamara
Supervision: Eric Nzirakaindi Ikoona, Lucy Namulemo, Michael Kamara, Mary Sinnah, Mohamed Alex Vandi, Foday Sahr
Writing – Original Draft: Eric Nzirakaindi Ikoona
Writing – Review & Editing: Eric Nzirakaindi Ikoona, Lucy Namulemo, Michael Kamara, Mohamed Alex Vandi, Foday Sahr
Supplementary Files
| Table 1: Platform records, sampled linkage checks and selected implementation milestones, Sierra Leone, June 2026 reporting endpoint. | ||
| Indicator | Value | 95% CI / note |
|---|---|---|
| Total integrated death records | 33,305 | Not applicable |
| Unique decedents after deduplication | 32,234 (96.8% of records held) | Not applicable |
| Duplicate records identified across sources | 1,071 (3.2%) | Not applicable |
| Data-source connections live | 3; two volume-bearing sources | Not applicable |
| Source contribution: civil registration (NCRA) | 23,323 (70%) | Not applicable |
| Source contribution: verbal autopsy program (HEAL-SL) | 9,979 (30%) | Not applicable |
| Source contribution: disease surveillance (eIDSR/DHIS2) | Connector live; 3 records; source data sparse | Not applicable |
| Geographic representation in available records | All 16 districts | Not applicable |
| Place of death: health facility | 14,420 (43.3%) | Not applicable |
| Place of death: community (outside facility) | 18,885 (56.7%) | Not applicable |
| Deaths with a medically certified or physician-coded cause | 10,124 (30.4%) | Not applicable |
| Legacy death-to-source-date interval within 48 hours | 26,777 of 33,305 (80.4%) | Unharmonised endpoints; see note |
| Legacy mean death-to-source-date interval | Mixed-source endline: 5.1 days (SD 9.8); civil-registration baseline: 14.0 days (SD 21.3) | Not directly comparable |
| Legacy median death-to-source-date interval | Mixed-source endline: 2 days (IQR 1-5); civil-registration baseline: 6 days | Not directly comparable |
| Sex distribution: male / female | 18,502 (55.6%) / 14,799 (44.4%) | Not applicable |
| Six-field completeness (600 records per round) | 91.4% first assessment; 99.9% second assessment | Not estimable from rounded composite summaries |
| Civil-registration records missing an ICD-coded cause | 3,299 (14.1% of source; 9.9% of all records) | Not applicable |
| Algorithm agreement in blinded flagged-pair review | 196 of 200 (98%) | 95.0 to 99.2 |
| Programme-reported inter-adjudicator agreement (Cohen kappa) | 0.94 | 0.88 to 1.00 (reported) |
| Missed-match yield in reviewed near-miss pairs | 6 of 500 (1.2%) | 0.6 to 2.6 |
| Indicator-framework revision milestone | 16 January 2026; 206 elapsed days | Not applicable |
| Offline district-dashboard deployment milestone | 4 March 2026; 253 elapsed days | Not applicable |
| HEAL-SL cooperation agreement concluded | April 2026; elapsed-day bounds 281-310 | Calendar bounds, not an exact event date |
| Legal review of the agreement before written escalation | Approximately 4 months: October 2025-February 2026 | Not applicable |
| HEAL-SL feed activation after agreement conclusion | Reported within 14 days of conclusion | Relative interval; no assumed transfer date |