
Research | Open Access | Volume 9 (4): Article 169 | Published: 20 Oct 2026

Views: 19
Menu, Tables and Figures
| Table 1: Distribution of Non-polio Acute Flaccid Paralysis rates during pre-response and response periods in the districts of Mbale Sub-region, 2024 | |||||
| District | <15 Population | Pre-response period | Response period | ||
| Cases | NPAFP/100,000 | Cases | NPAFP/100,000 | ||
| Budaka | 149,292 | 2 | 1.3 | 9 | 6.0 |
| Bududa | 166,296 | 4 | 2.4 | 2 | 1.2 |
| Bukwo | 74,672 | 1 | 1.3 | 2 | 2.7 |
| Bulambuli | 143,780 | 3 | 2.1 | 1 | 0.7 |
| Busia | 222,352 | 0 | 0.0 | 1 | 0.4 |
| Butaleja | 178,412 | 0 | 0.0 | 4 | 2.2 |
| Butebo | 66,040 | 1 | 1.5 | 7 | 10.6 |
| Kapchorwa | 71,396 | 0 | 0.0 | 1 | 1.4 |
| Kibuku | 149,604 | 5 | 3.3 | 11 | 7.4 |
| Kween | 62,816 | 3 | 4.8 | 3 | 4.8 |
| Manafwa | 98,800 | 1 | 1.0 | 3 | 3.0 |
| Mbale City | 186,524 | 6 | 3.2 | 115 | 61.7 |
| Mbale District | 155,480 | 5 | 3.2 | 27 | 17.4 |
| Namisindwa | 131,664 | 4 | 3.0 | 14 | 10.6 |
| Pallisa | 216,060 | 1 | 0.5 | 1 | 0.5 |
| Sironko | 153,712 | 0 | 0.0 | 3 | 2.0 |
| Tororo District | 339,768 | 0 | 0.0 | 23 | 6.8 |
| Total | 2,566,668 | 36 | 1.4 | 227 | 8.8 |
Table 1: Distribution of Non-polio Acute Flaccid Paralysis rates during pre-response and response periods in the districts of Mbale Sub-region, 2024
Emmanuel Okiror Okello1,&, Annet Kisakye2, Immaculate Ampaire3, Sam Ofori3, Richard Ssekitoleko2, William Okiror4, Edward Juma Nyongesa4, Ronald Seguya3, Molly Birungi5, Emmanuel Tenywa2, Charity Mutesi1, Lilian Bulage1, Benon Kwesiga1, Richard Migisha1, Alex Riolexus Ario1
1Uganda Public Health Fellowship Program, Uganda National Institute of Public Health, Kampala, Uganda, 2World Health Organization Country Office, Kampala, Uganda, 3Uganda Expanded Program on Immunization, Ministry of Health, Kampala, Uganda, 4Mbale Public Health Emergency Operations Centre, Mbale City, Uganda, 5Uganda Virus Research Institute, Entebbe, Uganda
&Corresponding author: Emmanuel Okiror Okello, Uganda Public Health Fellowship Program, Uganda National Institute of Public Health, Kampala, Uganda, Email: okiroreo@uniph.go.ug ORCID: https://orcid.org/0009-0004-7992-6355
Received: 28 Jun 2026, Accepted: 19 Oct 2026, Published: 20 Oct 2026
Domain: Infectious Disease Epidemiology
Keywords: Vaccine-Derived Poliovirus, Polio, Disease Outbreaks, Surveillance, Uganda
©Emmanuel Okiror Okello et al. Journal of Interventional Epidemiology and Public Health (ISSN: 2664-2824). This is an Open Access article distributed under the terms of the Creative Commons Attribution International 4.0 License (https://creativecommons.org/licenses/by/4.0/), which permits unrestricted use, distribution, and reproduction in any medium, provided the original work is properly cited.
Cite this article: Emmanuel Okiror Okello et al., Evaluation of Uganda’s 120-day response to cVDPV2 polio outbreak in Mbale Region, June–September 2024. Journal of Interventional Epidemiology and Public Health. 2026; 9(4):169. https://doi.org/110.37432/jieph-d-26-00202
Introduction: In May 2024, Uganda confirmed circulating vaccine-derived poliovirus type 2 (cVDPV2) from an environmental sample in Mbale City, Eastern Uganda. Such detection signals possible silent transmission and requires rapid response under World Health Organization (WHO) outbreak Standard Operating Procedures, which aim to interrupt transmission within 120 days. We evaluated Uganda’s response in Mbale sub-region against these WHO response standards.
Methods: We conducted a descriptive evaluation of the response using WHO polio outbreak standards as the benchmark. We assessed timeliness of notification and outbreak declaration, epidemiologic and risk assessments, surveillance performance, and immunization response activities. Acute Flaccid Paralysis (AFP) surveillance and routine immunization indicators were compared between the 120-day pre-response and response periods using DHIS2 data from 17 districts in Mbale sub-region.
Results: Uganda notified WHO within 24 hours of laboratory confirmation, meeting the WHO notification benchmark. Formal outbreak declaration occurred five days after confirmation, exceeding the 72-hour benchmark by two days. Epidemiologic investigation and risk assessment were initiated within 24 hours. During the 120-day response period, 227 AFP cases were detected compared with 36 during the preceding 120-day period, while the NPAFP rate increased from 1.4 to 8.8 per 100,000 children aged <15 years. The proportion of districts achieving ≥95% DPT1 coverage increased from 76% to 82%, while the proportion achieving ≥95% DPT3 coverage increased from 52% to 82%. Two rounds of nOPV2 supplementary immunization activities were implemented within the response period, with reported administrative coverage of 118% and 114%, respectively; independent monitoring estimated coverage at 92.4% inside and 89.4% outside households in round one and 99.4% and 98.0%, respectively, in round two.
Conclusion: Uganda’s response largely met key WHO outbreak response standards, including timely notification, rapid investigation, enhanced AFP surveillance, and implementation of high-coverage nOPV2 vaccination campaigns. Surveillance and selected routine immunization indicators improved during the response period.
Poliomyelitis (polio) is an acute viral infectious disease caused by poliovirus, an enterovirus transmitted primarily through the fecal–oral route [1]. Although approximately 90% of infections are asymptomatic, about 1% result in paralytic disease characterized by acute flaccid paralysis, often preceded by fever, headache, vomiting, and asymmetric limb weakness [1, 2]. Polioviruses detected in humans or the environment are classified as wild polioviruses, vaccine viruses, or vaccine-derived polioviruses (VDPVs) [3]. VDPVs are further categorized into circulating vaccine-derived poliovirus (cVDPV), immune deficiency–associated VDPV (iVDPV), and ambiguous VDPV (aVDPV) [3]. While global wild poliovirus cases have declined dramatically from approximately 350,000 cases in 125 countries in 1988 to fewer than 100 cases confined to Pakistan and Afghanistan by the end of 2024 [4], the emergence and spread of cVDPV strains have become a major impediment to eradication efforts. As of June 18, 2024, 71 (0.2%) of 46,100 investigated acute flaccid paralysis (AFP) cases globally were positive for cVDPV, of which 83% were reported from the WHO African Region [5].
The risk of cVDPV transmission in East Africa remains high due to cross-border population movement and immunity gaps. In 2024, neighboring countries reported multiple cVDPV cases, including South Sudan (9 cases), the Democratic Republic of Congo (31 cases), Tanzania (1 case), and Kenya (6 cases), signaling a heightened risk of importation into Uganda [5]. On May 31, 2024, Uganda confirmed circulating vaccine-derived poliovirus type 2 (cVDPV2) from an environmental sample collected on May 7, 2024, at a sewage surveillance site in Doko, Mbale City, eastern Uganda [6]. Initial testing was conducted at the Uganda Virus Research Institute, with confirmatory testing at the National Institute for Communicable Diseases in South Africa. Genetic sequencing demonstrated linkage to a cVDPV2 strain previously detected in Garissa Province, Kenya, which had originated from Somalia [6]. This was not the first environmental detection of cVDPV2 in Uganda; in 2022, a sewage sample collected in Kampala also tested positive, highlighting persistent susceptibility to poliovirus transmission [7].
In response to any poliovirus event or outbreak, the World Health Organization (WHO) provides Standard Operating Procedures (SOPs) to guide countries in interrupting transmission within 120 days [3]. These standards require immediate declaration of the outbreak as a public health emergency, detailed epidemiologic investigation and risk assessment, enhancement of AFP surveillance, and implementation of high-quality supplementary immunization activities (SIAs) [3]. Following confirmation of cVDPV2 in Mbale sub-region, Uganda initiated outbreak response activities in accordance with these guidelines. We evaluated Uganda’s response to the cVDPV2 outbreak in Mbale sub-region against WHO polio outbreak response SOPs, specifically assessing timeliness of declaration, investigation and risk assessment, surveillance performance, and immunization response within the 120-day target period.
Study design
We conducted a retrospective descriptive evaluation of Uganda’s response to the cVDPV2 outbreak in Mbale sub-region. The evaluation assessed adherence to the WHO SOPs for poliovirus outbreak response, which require interruption of transmission within 120 days [3]. We compared response performance during the 120-day outbreak response period (June 1–September 30, 2024) with a 120-day pre-outbreak baseline period (February 1–May 31, 2024).
Study setting
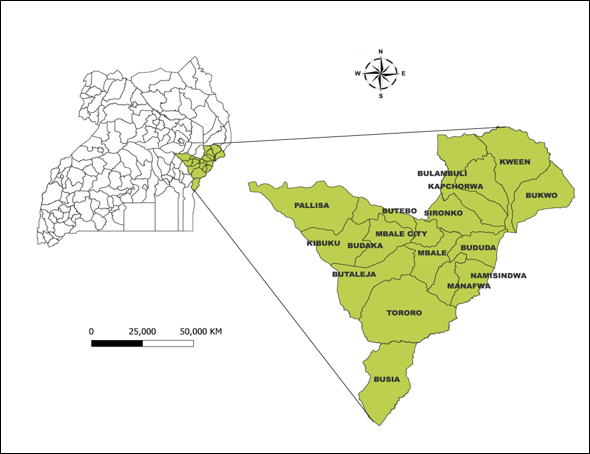
Mbale sub-region is located in eastern Uganda and comprises 17 administrative units (16 districts and Mbale City) (Figure 1). The region is served by routine immunization services and acute flaccid paralysis (AFP) surveillance under Uganda’s Expanded Programme on Immunization (EPI) and national Integrated Disease Surveillance and Response (IDSR) framework.
Evaluation framework
We assessed response performance against four key WHO outbreak response standards [3]. These included timely notification to WHO and formal declaration of the outbreak as a public health emergency, conduct of a detailed epidemiologic investigation and risk assessment, enhancement of acute flaccid paralysis (AFP) surveillance activities to improve case detection and sensitivity, and expansion of vaccination response through implementation of high-quality supplementary immunization activities (SIAs).
Timeliness of notification and declaration
We documented the dates of laboratory confirmation, notification to WHO, and formal declaration of the outbreak as a public health emergency by national authorities. These were compared against WHO standards requiring immediate notification (within 24 hours) and declaration within 72 hours following confirmation [3].
Epidemiologic investigation and risk assessment
We reviewed the outbreak investigation and risk assessment reports to assess timeliness, scope, and key findings. We evaluated whether investigations were initiated within 72 hours of confirmation, as recommended by WHO SOPs, and summarized identified risk factors and vulnerability assessments.
Nine communities along the blueline were purposefully selected for this survey. Within these communities, a convenient sampling approach was employed to select households for the immunisation survey and stool sample collection, and data were collected using the developed VDPV investigation tool. Stool samples were collected from 10 to 20 healthy children aged between 0 and 5 years, with a few above 5, and active search was conducted for any child under 15 years of age with a history of acute flaccid paralysis within the last 6 months.
Surveillance performance
To evaluate enhancement of surveillance activities, we compared AFP surveillance indicators between the 120-day pre-response period and the 120-day outbreak response period using routinely collected data abstracted from the national DHIS2 system for all 17 administrative units in Mbale sub-region. Key performance indicators included the number of AFP cases detected and investigated, as well as the non-polio AFP (NPAFP) rate per 100,000 children aged <15 years, which is the standard measure of surveillance sensitivity. The NPAFP rate was calculated as:
$$\text{NPAFP} = \frac{\text{Number of reported NPAFP cases among children } < 15 \text{ years} \times 100,000}{\text{Total number of children } < 15 \text{ years}}$$
Population denominators were derived from national population projections. Performance was assessed against the WHO minimum surveillance standard of ≥3 NPAFP cases per 100,000 children aged <15 years annually in areas where polio is present or threatens [3].
Immunization performance
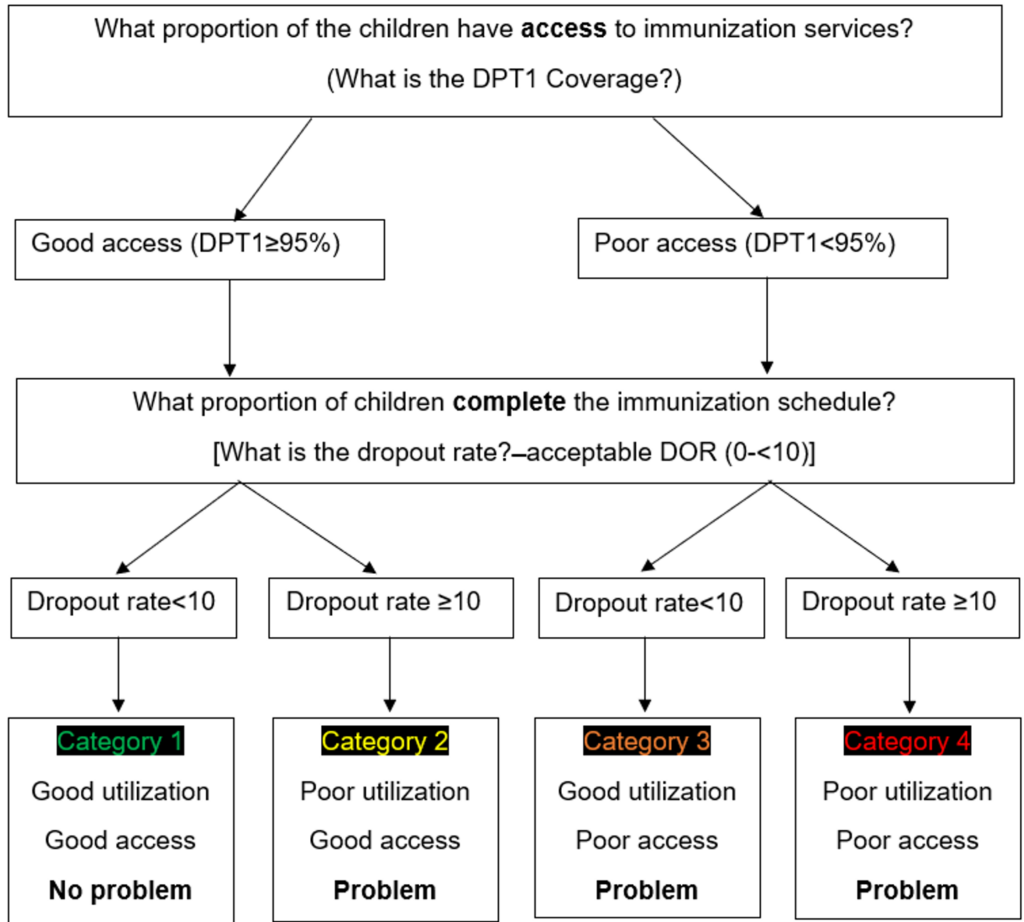
To assess enhancement of vaccination scope, we compared routine immunization indicators between the pre-response and response periods using data extracted from the national DHIS2 system. We used diphtheria–pertussis–tetanus first-dose (DPT1) coverage as a proxy indicator for access to immunization services and third-dose (DPT3) coverage as a proxy for utilization and completion of the immunization schedule. We also assessed DPT1–DPT3 dropout rates and district performance using the Reach Every District–Reach Every Child (RED-REC) categorization framework (figure 2). Monthly coverage and dropout rates were calculated using standard administrative formulas based on reported vaccinations and target population estimates, and districts were classified according to national RED-REC criteria. In addition, we documented implementation of supplementary immunization activities (SIAs) using novel oral polio vaccine type 2 (nOPV2), including the number of rounds conducted, target population, doses administered, and administrative coverage achieved.
Independent monitoring of the nOPV2 campaigns used two complementary approaches: house-to-house and out-of-house monitoring. House-to-house monitoring assessed household reach through cluster-based visits, inspection of house markings, caregiver interviews, and verification of vaccination using ink finger markings among children aged <5 years. Out-of-house monitoring targeted mobile children at public congregation points, including markets, transport terminals, border points, streets, and playgrounds, using convenience/random-intercept sampling. The approach targeted approximately 50–100 randomly selected children per public location. Monitors assessed vaccination status through finger markings and collected information on the child’s place of residence to identify potential geographic gaps in campaign reach. Monitoring findings were summarized as the proportion of eligible children assessed who had evidence of vaccination and were used to complement administrative coverage estimates.
Data analysis
Data were analyzed descriptively using Epi Info version 7.2.6.0 (CDC, Atlanta, USA). Spatial distribution maps were generated using QGIS software. The analysis was descriptive and focused on assessing implementation of the response against predefined WHO outbreak response standards and benchmarks. Surveillance and immunization indicators were summarized for the pre-response and response periods to describe changes in program performance. Inferential statistical testing was not conducted because it was outside the scope of this retrospective descriptive evaluation. Differences between the two periods were therefore interpreted as descriptive changes and not as estimates of statistically significant differences or causal effects of the response.
Ethics consideration
This outbreak investigation and evaluation was conducted in response to a public health emergency and was determined to be a non-research public health practice and disease-control activity. The Uganda Ministry of Health authorized the investigation. Consistent with applicable ethical guidance and US CDC policy, the activity was reviewed by the relevant authorities and conducted in accordance with applicable federal law, CDC policy, and the Declaration of Helsinki.
SOP 1: Timeliness of notification and outbreak declaration
Uganda notified the WHO within 24 hours of laboratory confirmation of the cVDPV2 environmental isolate, meeting WHO requirements for immediate notification. The Ministry of Health formally declared the outbreak a public health emergency five days after confirmation. While notification met the 24-hour standard, the outbreak was formally declared five days after laboratory confirmation. This exceeded the WHO benchmark for outbreak declaration within 72 hours by approximately two days; therefore, the specified declaration timeline was not met.
SOP 2: Detailed investigation and risk assessment
Detailed epidemiologic investigations and risk assessments were initiated within 24 hours of laboratory confirmation and conducted from May 31 to June 9, 2024, meeting WHO recommendations for prompt investigation. Genetic sequencing confirmed the isolate as cVDPV2, closely linked to a strain previously detected in Garissa, Kenya, indicating cross-border transmission risk. Community assessment along the environmental surveillance catchment area identified immunity gaps among children under five years of age. Among 113 children assessed, only 20% had documentation of three oral polio vaccine (OPV) doses, and 19% had received two doses of inactivated polio vaccine (IPV), suggesting suboptimal routine immunization coverage. Commonly reported barriers to vaccination included lack of awareness, concerns about vaccine side effects, competing caregiver priorities, and sociocultural beliefs. No additional AFP cases were identified through community case search. However, one AFP case was detected through health facility active case finding at Mbale Regional Referral Hospital.
SOP 3: Enhancement of AFP surveillance
A total of 263 AFP cases were reported during the eight-month evaluation period, of which 36 (14%) occurred during the pre-response period and 227 (86%) during the outbreak response period. The non-polio AFP (NPAFP) rate increased from 1.4 per 100,000 children aged <15 years during the pre-response period to 8.8 per 100,000 during the response period (Table 1). However, there was considerable heterogeneity in AFP surveillance performance across the 17 administrative units during the response period. Despite the intensified surveillance evidenced during the response phase, eight of the 17 administrative units still did not achieve the WHO benchmark of ≥3 NPAFP per 100,000 during the response period: Bududa (1.2), Bukwo (2.7), Bulambuli (0.7), Busia (0.4), Butaleja (2.2), Kapchorwa (1.4), Pallisa (0.5), and Sironko (2.0). Conversely, particularly high rates were observed in Mbale City (61.7), Mbale District (17.4), and Namisindwa (10.6). Mbale City alone accounted for 115 of the 227 AFP cases identified during the response period (50.7%). Five districts that reported no AFP cases during the pre-response period (Busia, Butaleja, Kapchorwa, Sironko, and Tororo) reported at least one AFP case during the response period, reducing the number of administrative units with zero reported AFP cases from five to none.
SOP 4: Expansion of vaccination response
Routine immunization performance
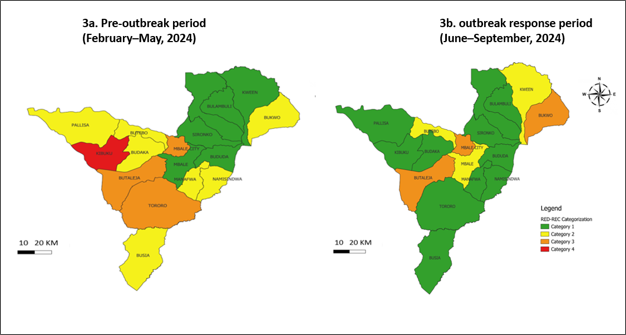
Routine immunization performance improved during the outbreak response period. The proportion of districts achieving ≥95% DPT1 coverage (proxy for access) increased from 76% in the pre-response period to 82% during the response period. Similarly, districts achieving ≥95% DPT3 coverage (proxy for utilization and completion) increased from 52% to 82%. Overall, the proportion of districts classified in higher-performing RED-REC categories increased during the response period, as illustrated in Figure 3a (pre-response period) and Figure 3b (response period).
Supplementary immunization activities (SIAs)
Two rounds of supplementary immunization activities using novel oral polio vaccine type 2 (nOPV2) were conducted within the 120-day response period across the Mbale sub-region. A total of 2,765,871 children aged 0–59 months were targeted. Administrative coverage exceeded 100% in both rounds, with 3,269,122 children vaccinated in round one (118%) and 3,132,606 in round two (114%). Coverage exceeding 100% likely reflects underestimation of target population denominators and cross-district or cross-border population movement during the campaigns.
Independent monitoring confirmed high campaign quality. In round one, household monitoring demonstrated coverage of 92.4% (inside households) and 89.4% (outside households). In round two, coverage improved to 99.4% and 98%, respectively.
Uganda’s response to the 2024 cVDPV2 outbreak in Mbale sub-region largely met the assessed WHO outbreak response standards, including timely notification, prompt initiation of investigations, intensified AFP surveillance, and implementation of supplementary immunization activities within the 120-day response period. During the same period, AFP surveillance indicators and selected routine immunization indicators improved compared with the preceding 120-day period. These findings indicate improved program performance during the response period and demonstrate adherence to several key WHO response benchmarks. However, the observed temporal changes should not be interpreted as evidence that the response interventions caused the improvements, given the absence of a control or comparison region and the potential influence of other concurrent factors.
The World Health Organization (WHO) requires immediate notification of poliovirus detection within 24 hours of laboratory confirmation and formal declaration of a public health emergency within 72 hours [8]. In this outbreak, Uganda’s International Health Regulations (IHR) focal point notified WHO within 24 hours, meeting the recommended standard. However, formal declaration occurred five days after confirmation, exceeding the 72-hour benchmark by two days. Although operational response activities were initiated promptly, even short delays in formal declaration may slow high-level resource mobilization and coordination, potentially increasing the risk of onward transmission in the context of cVDPV2 [9].
Following confirmation, WHO guidance recommends initiation of detailed field investigations and risk assessment within 72 hours to guide targeted response measures, including identification of immunity gaps, high-risk populations, and patterns of population movement [3]. Uganda’s performance was good with investigations initiated within 24 hours and completed within 10 days (May 31–June 9, 2024). Similar response efforts were documented in Ethiopia in 2014 [10]. Early identification of suboptimal immunization coverage and community-level barriers likely informed the timely deployment of supplementary immunization activities and surveillance intensification, strengthening outbreak containment.
Consistent with WHO outbreak response standards, which call for rapid strengthening of acute flaccid paralysis (AFP) surveillance to achieve an NPAFP rate of at least 3 per 100,000 children aged <15 years [3], surveillance sensitivity increased markedly during the response period. The regional NPAFP rate achieved during the pre-response phase was 1.4 per 100,000 and that achieved during the response phase was 8.8 per 100,000, which reflected enhanced AFP surveillance in the response phase through intensified active case finding and heightened system alertness. Similar improvements in surveillance performance have been observed during outbreak responses in Kenya [11]. Achieving surveillance sensitivity well above the minimum threshold reduces the likelihood of undetected poliovirus circulation and enhances confidence in transmission interruption. During the response period, deliberate measures were implemented to increase the identification and reporting of AFP cases. These included intensified active case finding in both health facilities and communities, supported by deployment of surveillance teams to the region during the initial case investigations, throughout the 120-day response period, and during the nOPV2 vaccination campaigns. The increased number of AFP cases detected during the response period was therefore, in part, a direct output of these intensified surveillance activities. In addition, enhanced risk communication and community engagement activities increased awareness and vigilance for AFP among healthcare providers and community members, which may have further contributed to increased case identification and reporting. Consequently, the observed increase in AFP detection should be interpreted primarily in the context of intensified surveillance and heightened awareness during the response period rather than as evidence of an underlying increase in AFP incidence.
Parallel to surveillance strengthening, WHO recommends implementation of at least two high-quality rounds of nOPV2 vaccination at 14–28-day intervals, targeting at least 95% of children under five years to rapidly interrupt transmission [3]. Uganda implemented the two recommended rounds within the prescribed interval, with administrative coverage estimates of 118% and 114%, respectively. Although these estimates exceeded the 95% target, coverage above 100% indicates potential limitations in the reliability of the administrative denominator and may reflect population movement, including vaccination of mobile or cross-border populations, rather than true population coverage exceeding the target population. Consequently, the administrative coverage estimates should be interpreted cautiously and should not, in isolation, be considered evidence of exceptionally high population coverage. Independent monitoring findings provided complementary evidence of campaign reach and quality. Taken together, the findings demonstrated implementation of the recommended vaccination rounds and provide evidence of campaign reach, while highlighting the need for caution when interpreting administrative coverage estimates. These activities occurred alongside timely notification and investigation and strengthened AFP surveillance during the response period, consistent with the WHO outbreak response framework [3].
Study strengths and limitations
This evaluation has several strengths. First, it applied globally recognized WHO outbreak response Standard Operating Procedures (SOPs) as predefined benchmarks, enabling an objective and internationally comparable assessment of response performance. Second, the analysis used real-time data from the actual 120-day response period, providing insight into system functionality under emergency conditions rather than simulated or retrospective reconstruction. Third, by jointly evaluating timeliness of notification, investigation, surveillance sensitivity, routine immunization performance, and supplementary immunization activities, the study offers a comprehensive assessment of outbreak response effectiveness across multiple system domains.
However, this evaluation also has several limitations. First, it relied primarily on routine surveillance and immunization data, which may be affected by incomplete reporting, data-quality limitations, and inaccuracies in population denominators. These issues may influence the precision and comparability of NPAFP and vaccination coverage estimates, particularly where administrative coverage exceeded 100%. Second, the retrospective before–after design and absence of a comparison group limit the ability to attribute observed changes in surveillance and immunization indicators specifically to the outbreak response. Changes may also have reflected concurrent interventions, reporting practices, seasonal variation, population movement, or other contextual factors. Third, the evaluation focused on the first 120 days of the response and therefore does not assess longer-term changes in surveillance performance, routine immunization, or population immunity. Fourth, the increase in AFP detection during the response period could not be fully disaggregated by the contribution of active case finding, retrospective record review, changes in reporting, or other surveillance activities, limiting interpretation of the observed increase as a measure of surveillance improvement. Finally, the evaluation did not directly assess virologic or environmental outcomes and therefore cannot confirm interruption of cVDPV2 transmission. These limitations should be considered when interpreting the findings as an assessment of response implementation and performance against WHO standards rather than as evidence of causal effectiveness or confirmed interruption of transmission.
This evaluation assessed Uganda’s response to the 2024 cVDPV2 outbreak in Mbale sub-region against WHO poliovirus outbreak response standards. The response met several key benchmarks, including notification to WHO within 24 hours, initiation of epidemiologic investigation and risk assessment within 72 hours, enhancement of AFP surveillance, and implementation of two high-coverage nOPV2 supplementary immunization rounds within the 120-day response period. However, formal outbreak declaration occurred five days after laboratory confirmation, exceeding the 72-hour benchmark by two days.
AFP case detection and the NPAFP rate were higher during the response period than during the preceding 120-day period, alongside increases in district-level routine immunization indicators. These changes coincided with intensified surveillance and immunization activities but, given the descriptive before–after design, should not be interpreted as effects attributable solely to the outbreak response. Administrative vaccination coverage exceeding 100% also highlights limitations in population denominator estimates and the influence of mobile and cross-border populations.
The findings underscore the importance of maintaining sensitive AFP surveillance and strong routine immunization systems during both outbreak and inter-outbreak periods, improving the accuracy of target population estimates, and ensuring timely outbreak declaration and response coordination. Continued surveillance and virologic evidence are required to determine interruption of poliovirus transmission; therefore, this evaluation does not establish that transmission was interrupted during the 120-day assessment period.
What is already known about the topic
What this study adds
The authors of this work declare no competing interests. Lilian Bulage is an Associate Editor at the Journal of Interventional Epidemiology and Public Health (JIEPH)and a co-author of this manuscript. In line with the journal’s conflict of interest policy, she was fully recused from the peer review process and had no involvement in editorial handling or decision-making for this submission. An independent editor oversaw the review and decision-making process.
Data availability
The datasets upon which our findings are based belong to the Uganda Public Health Fellowship Program. For confidentiality reasons, the datasets are not publicly available. The datasets can be provided upon reasonable request from the corresponding author with permission from the Uganda Public Health Fellowship Program.
This study was supported by the President’s Emergency Plan for AIDS Relief (PEPFAR) through the United States Centers for Disease Control and Prevention Cooperative Agreement number GH001353-01 through Makerere University School of Public Health to the Uganda Public Health Fellowship Program, Ministry of Health. The contents of this manuscript are solely the responsibility of the authors and do not necessarily represent the official views of the US Centers for Disease Control and Prevention and the Department of Health and Human Services, Makerere University School of Public Health, the Uganda Ministry of Health or WHO.
We acknowledge the Uganda Ministry of Health, communities, and the partners who supported the investigation, including the WHO, Bill & Melinda Gates Foundation, and Mbale District Health Offices. Special gratitude to the team that supported the investigations, including Mubaraka Masereka, Mugonyi Moses, Margaret Esther, Mwolobi Esther, Nabumbo Annet, Adongo Maureen, Yaweri Ferara, Mutonyi Aisha, Muteesi Alaisa, and Monje Loy.
Conceptualization: Emmanuel Okiror Okello, Annet Kisakye
Data curation: Emmanuel Okiror Okello, Annet Kisakye, Sam Ofori, Richard Ssekitoleko, William Okiror, Edward Juma Nyongesa, Ronald Seguya, Molly Birungi, Emmanuel Tenywa, Charity Mutesi
Formal analysis: Emmanuel Okiror Okello
Investigation: Emmanuel Okiror Okello
Methodology: Emmanuel Okiror Okello, Annet Kisakye
Supervision: Immaculate Ampaire, Lilian Bulage, Benon Kwesiga, Richard Migisha, Alex Riolexus Ario
Writing – original draft: Emmanuel Okiror Okello
Writing – review & editing: Annet Kisakye, Immaculate Ampaire, Sam Ofori, Richard Ssekitoleko, William Okiror, Edward Juma Nyongesa, Ronald Seguya, Molly Birungi, Emmanuel Tenywa, Charity Mutesi, Lilian Bulage, Benon Kwesiga, Richard Migisha, Alex Riolexus Ario
| Table 1: Distribution of Non-polio Acute Flaccid Paralysis rates during pre-response and response periods in the districts of Mbale Sub-region, 2024 | |||||
| District | <15 Population | Pre-response period | Response period | ||
| Cases | NPAFP/100,000 | Cases | NPAFP/100,000 | ||
| Budaka | 149,292 | 2 | 1.3 | 9 | 6.0 |
| Bududa | 166,296 | 4 | 2.4 | 2 | 1.2 |
| Bukwo | 74,672 | 1 | 1.3 | 2 | 2.7 |
| Bulambuli | 143,780 | 3 | 2.1 | 1 | 0.7 |
| Busia | 222,352 | 0 | 0.0 | 1 | 0.4 |
| Butaleja | 178,412 | 0 | 0.0 | 4 | 2.2 |
| Butebo | 66,040 | 1 | 1.5 | 7 | 10.6 |
| Kapchorwa | 71,396 | 0 | 0.0 | 1 | 1.4 |
| Kibuku | 149,604 | 5 | 3.3 | 11 | 7.4 |
| Kween | 62,816 | 3 | 4.8 | 3 | 4.8 |
| Manafwa | 98,800 | 1 | 1.0 | 3 | 3.0 |
| Mbale City | 186,524 | 6 | 3.2 | 115 | 61.7 |
| Mbale District | 155,480 | 5 | 3.2 | 27 | 17.4 |
| Namisindwa | 131,664 | 4 | 3.0 | 14 | 10.6 |
| Pallisa | 216,060 | 1 | 0.5 | 1 | 0.5 |
| Sironko | 153,712 | 0 | 0.0 | 3 | 2.0 |
| Tororo District | 339,768 | 0 | 0.0 | 23 | 6.8 |
| Total | 2,566,668 | 36 | 1.4 | 227 | 8.8 |