
Lessons from the Field | Open Access | Volume 9 (4): Article 178 | Published: 4 Nov 2026

Views: 149
Menu, Tables and Figures
Table 1: Evidence supporting the six operational lessons
| Lesson | Direct evidence and source | Operational interpretation | Support and inferential boundary |
|---|---|---|---|
| 1. Confidential care seeking | Early presentation/contact summaries [1]. Participant accounts of concealment and care avoidance [5]. | Pair routine timeliness and contact indicators with confidential patient feedback. | Convergent evidence for reported barriers. Their population frequency and causal contribution are unmeasured. Indicators are not validated stigma scales. |
| 2. Sustained recognition | Early detection chronology [1]. Later ancestor dating [4]. Diagnostic-journey accounts [5]. | Maintain a rash-recognition and specimen-referral pathway between emergencies. | Evidence supports an early detection gap. Clinical suspicion and the contribution of individual causes were not directly measured. |
| 3. End-to-end diagnosis | Three early laboratories [1]. Nine functional sites by December [2]. Coordination accounts [5]. Modeled under-ascertainment [4]. | Track collection, transport, testing, communication, and action separately. | Laboratory counts and reported delays are descriptive. A national patient-level diagnostic interval and effects of proposed remedies are not estimated. |
| 4. Supported isolation | Perceived bed and support barriers [5]. Close-contact investigations [1]. Overlapping intervention chronology [2,4]. | Assess feasibility of each placement and fund clinical, transport, and household support. | Support for reported barriers and temporal overlap. Comparative isolation effectiveness is undetermined. |
| 5. Workforce sustainability | Workforce accounts [5]. Contact workload and response activities [1,2]. | Monitor workload, deployment, absence, and payment. Prearrange surge and relief support. | Accounts support concern about sustainability. No standardized fatigue or burnout outcome, or causal effect on tracing quality, was measured. |
| 6. Multi-level genomic surveillance | Early and later genomic sampling [1,4]. District surveillance and laboratory operations [2]. | Districts provide specimens and metadata. National and regional partners coordinate sequencing and alerts. | Sampling was limited and uneven. Geographic origin and precise transmission histories remain conditional on sampled data. |
Support refers to the operational concern. Sources can share underlying observations. The implementation actions are author proposals. Supplementary Tables S5–S7 document source appraisal, CFIR domain mapping, and counter-examples.
Table 1: Evidence supporting the six operational lessons
Table 2: Proposed district implementation package
| Operational gap / evidence | Minimum action and responsible function | Indicator | Review trigger and cadence | Correction / resource tier |
|---|---|---|---|---|
| Care avoidance [1,5] | Private case/contact interviews and brief patient feedback. Surveillance lead with risk-communication focal person. | Onset-to-presentation. Interview refusal. Contacts named. Stated reasons for delay. | Weekly review of delay/refusal patterns or any confidentiality complaint. No validated stigma cutoff. | Review privacy, language, access, and support barriers. Low: staff time and protected space. |
| Unrecognized rash [1,4,5] | Apply sampling/referral algorithm. Orient facilities and informal first-contact providers. Surveillance officer and clinical focal person. | Eligible rash presentations sampled / all eligible presentations. Completeness of eligibility recording. | Weekly performance below the district target or a suspected missed cluster. | Replenish supplies, retrain, investigate. Medium: kits, protective equipment, supervision. |
| Specimen delay [1,2,5] | Scheduled transport plus urgent dispatch and sample tracking. District laboratory focal person. | Collection-to-laboratory receipt. Specimens exceeding the maximum interval. | Any breached maximum. Review weekly and escalate urgent specimens immediately. | Restore transport and investigate handoffs. Medium: fuel, packaging, couriers. |
| Delayed actionable diagnosis [1,5] | Results register and clinician/district notification protocol. Laboratory and surveillance focal persons. | Receipt-to-result. Result-to-acknowledgment. Presentation-to-actionable diagnosis. | Any breached maximum or unacknowledged actionable result. Weekly backlog review. | Resolve testing or communication bottleneck. Low–medium: communication and protected staff time. |
| Unsupported isolation [1,4,5] | Assess placement feasibility and find care/household support. Case-management lead, district medical officer, and council liaison. | Time to supported placement. Support delivered / support required. Reasons for nonacceptance. | Any unsafe placement, unmet essential support, or breached placement interval. Weekly review. | Arrange beds, transport, supplies, or safe alternative. High: recurrent clinical and household support. |
| Tracing overload [2,5] | Maintain surge roster, relief teams, and payment calendar. Surveillance lead with finance/logistics focal person. | Active assignments per tracer. Payment delay. Case-interview and contact-follow-up completion. | Caseload above locally agreed capacity or overdue payment. Twice weekly during surges. | Rebalance work, deploy relief, resolve arrears. Medium: surge staff, transport, allowances. |
| Unrepresentative sampling [1,4] | Track district/week coverage. Refer selected specimens. District laboratory focal person with national genomic lead. | Eligible specimens forwarded. District/week representation. Sequence-feedback time. | Sampling or feedback gaps against the national plan. Monthly and during cluster alerts. | Target gaps and escalate sequencing capacity. Medium locally. High national/regional dependency. |
| Weak local analysis [1,2] | Protected dashboard and decision-log time. Health information officer with surveillance backup. | Bulletin issued on time. Actions assigned, funded, and closed. | Late bulletin or unassigned corrective action. Weekly. | Activate backup. Resolve data or resource gaps. Low: protected analysis and review time. |
The authors propose these actions, triggers, review frequencies, and resource tiers for prospective evaluation. District teams must specify targets and maximum intervals against national guidance. Low denotes existing staff time and communication. Medium denotes additional recurrent logistics or staffing. High denotes clinical, household-support, or specialized laboratory expenditure. Tiers describe relative resource intensity, not cost estimates. Name existing function-holders within the district incident-management structure.
Table 2: Proposed district implementation package
Eric Nzirakaindi Ikoona1,&, Lucy Namulemo2, Mary Magdalene Sinnah1, Mohamed Alex Vandi1, Foday Sahr1
1National Public Health Agency, Freetown, Sierra Leone, 2Uganda Counselling and Support Services, Kampala, Uganda
&Corresponding author: Eric Nzirakaindi Ikoona, National Public Health Agency, 42A Main Motor Road, Wilberforce, Freetown, Sierra Leone, Email: ikoonae@yahoo.com ORCID: https://orcid.org/0000-0003-3402-1961
Received: 22 Aug 2026, Accepted: 29 Oct 2026, Published: 04 Nov 2026
Domain: Field Epidemiology
Keywords: mpox, Sierra Leone, outbreak response, surveillance, evidence synthesis
©Eric Nzirakaindi Ikoona et al. Journal of Interventional Epidemiology and Public Health (ISSN: 2664-2824). This is an Open Access article distributed under the terms of the Creative Commons Attribution International 4.0 License (https://creativecommons.org/licenses/by/4.0/), which permits unrestricted use, distribution, and reproduction in any medium, provided the original work is properly cited.
Cite this article: Eric Nzirakaindi Ikoona et al., Shortening outbreak-response delays: A multi-source synthesis of six lessons from Sierra Leone’s 2025 clade IIb mpox response. Journal of Interventional Epidemiology and Public Health. 2026; 9(4):178. https://doi.org/10.37432/jieph-d-26-00330
Sierra Leone confirmed mpox on January 10, 2025, and declared an emergency three days later. National surveillance recorded 5,442 confirmed cases and 60 deaths (1.1%) through December 14. The last case received laboratory confirmation on October 25. The outbreak was declared over on December 15. We identified operational lessons for shortening future outbreak-response delays. We retrospectively synthesized the January–December response through document analysis, triangulation, and informal expert consensus. Sources included field experience, national surveillance and response reviews, an early 44-case analysis, a four-district qualitative study of 140 participants, and genomic reconstruction. Six lessons address illness onset to presentation, presentation to actionable diagnosis, and diagnosis to initiation of supported transmission-interruption measures. Early cases presented a median of five days after onset. The median onset-to-confirmation interval was eight days. A genomic model estimated approximately 10,400 infections (95% highest posterior density interval, 7,000–15,200), against 5,096 laboratory-confirmed cases in that analysis. District teams should protect confidential care seeking, sustain rash recognition and sampling, and track result communication. They should support feasible isolation, plan sustained staffing, and connect specimens to national and regional sequencing. Notifications declined before the enhanced response phase, and concurrent interventions prevent separate effect estimates. The declared outbreak end does not exclude undetected transmission. A proposed district package links these lessons to responsible officers, indicators, review triggers, and resources for prospective evaluation.
Outbreak context
Sierra Leone confirmed mpox in a symptomatic man in Freetown on January 10, 2025, following eight years without a reported case [1]. A public health emergency followed on January 13 [1]. The early report identifies the first detected patient without determining the outbreak’s first infection or the place of acquisition [1]. The national surveillance system recorded 5,442 confirmed cases across all 16 districts, including 60 deaths (1.1%) and 5,382 recoveries [2,3]. Response teams vaccinated more than 186,000 people [3].
The last outbreak case received a positive laboratory diagnosis on October 25, 2025, a date distinct from symptom onset and district notification. The outbreak was declared over 51 days later, on December 15 [2,3], after every district had passed the cited minimum criterion of 42 days without a new case [3].
The genomic study reported 5,328 confirmed cases by September 26, with transmission concentrated in Western Area Urban and Western Area Rural [4]. The interim total and final national total of 5442 cover different reporting periods, with source-specific definitions and denominators documented in Supplementary Table S1. Cross-country shares of confirmed cases alone cannot separate transmission differences from differences in testing without comparable surveillance denominators.
The source studies describe early cases, experiences of care, and inferred transmission [1,4,5]. District teams need to connect these findings to specific service responsibilities. We aimed to identify operational lessons for shortening outbreak-response delays in Sierra Leone and comparable settings. We linked the evidence to responsible functions, resources, and review triggers for prospective use.
Evidence sources and synthesis
This Lessons from the Field article examines the January–December 2025 response through retrospective document analysis and practitioner-informed synthesis. We purposively selected sources relevant to response delays, implementation, or chronology, including the early 44-case analysis (January 10–March 5) and later genomic reconstruction [1,4]. National material comprised the reconciled dataset, situation reports, incident-management documents, and intra- and after-action reviews. Authors contributed field observations and recollections to interpret delivery conditions. The National Public Health Agency’s August 11 account of the intra-action review records logistics, data harmonization, and surge-capacity concerns [6].
Supplementary File 1 provides source counts and methods (Tables S1–S3), prospective indicators (Table S4), analytical matrices (Tables S5–S7), and an operational source register (Table S8).
The qualitative study recruited 140 participants in Western Area Urban, Western Area Rural, Bo, and Kenema from March 10 to August 28 [5]. The sample comprised 42 survivors, 38 health workers, 36 community members, and 24 contact tracers or surveillance officers. Trained local researchers conducted 94 interviews and 12 focus groups in English, Krio, Mende, or Temne. They recorded sessions, translated accounts, and used Framework analysis with iterative theme review [5]. Supplementary section S1 details recruitment, participant characteristics, transcription, analysis, and reflexivity in the source study.
ENI, LN, MMS, MAV and FS reviewed the sources and discussed their field experience. They grouped all candidate lessons into six categories, without excluding any candidate before grouping, and resolved differing interpretations through informal expert consensus. Each final category then had to meet three criteria: at least two supporting sources, a practical district responsibility, and potential relevance beyond mpox. Table 1 links source findings to the agreed lessons and their interpretation, organized around the three response intervals.
After grouping the lessons, we examined their support through source mapping, qualitative appraisal, triangulation, and negative-case analysis adapted from a Sierra Leone implementation study [7]. The extraction matrix links each finding to its source, period, population, response interval, implementation condition, and limits. We qualitatively appraised sources against AACODS dimensions: Authority, Accuracy, Coverage, Objectivity, Date, and Significance [8], as described in Table S5 without numerical scoring.
Cross-source comparison distinguished agreement, complementary findings, and disagreement. We treated repeated situation reports as one longitudinal monitoring series and recognized shared surveillance inputs across publications. Case analyses supplied observed intervals, qualitative accounts described experiences, operational records documented activities and chronology, and genomic models estimated unsampled transmission. The early case analysis reached response leadership in March 2025. Later publications informed retrospective interpretation of decisions made during the response.
We mapped implementation conditions to five Consolidated Framework for Implementation Research (CFIR) domains: Innovation, Outer Setting, Inner Setting, Individuals, and Implementation Process [9]. This secondary mapping followed lesson development and remained at domain level. Negative-case analysis examined the earlier notification decline, unmeasured diagnostic timeliness despite laboratory expansion, and uneven genomic sampling, as documented in section S2 and Tables S6–S7.
The authors’ research, surveillance, and leadership roles supplied direct operational knowledge. Shared institutional positions could also favor common explanations. We distinguished practitioner observations, participant accounts, recorded activities, model estimates, and proposed actions through source-linked matrices and counter-examples. The analysis used informal expert consensus without independent coding, inter-rater statistics, or transcript recoding. The district actions and resource tiers are proposals for prospective evaluation.
Weekly surveillance series
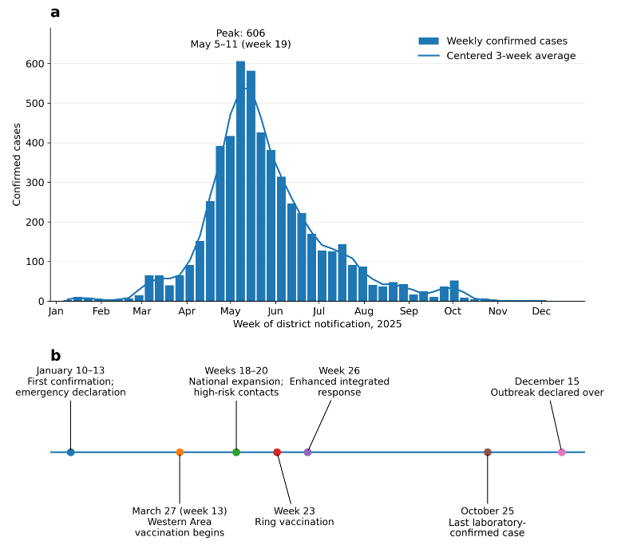
Figure 1 uses reconciled national mpox aggregates totalling 5,442 confirmed cases through December 14, 2025, consistent with Situation Report 335 [2]. National case classifications and counts were used without additional author-level exclusions, reclassification, or duplicate removal. Cases enter the week when a health facility or community notified the district, using the International Organization for Standardization (ISO) Monday–Sunday calendar.
The centered three-week average uses three complete displayed weeks, with averages omitted at the boundaries. The peak was 606 notifications in week 19, May 5–11. Supplementary File 2 supplies weekly counts, formulas, and milestones, while section S3 distinguishes the notification series from the situation report’s symptom-onset curve.
Three response intervals
Illness onset to presentation runs from the patient-reported first symptom to the first facility or community-provider encounter for that illness. Facility and community focal persons record the original onset and first encounter dates with the patient, without resetting them after referrals.
Presentation to actionable diagnosis ends when the diagnostic decision and supporting result reach the responsible clinician and district officer. Laboratory confirmation and result communication require separate timestamps because a positive specimen result may precede communication to the staff responsible for action. Clinicians should begin precautions and referral on clinical suspicion, before confirmation.
Diagnosis to supported transmission-interruption measures ends when the agreed placement, necessary patient and household support, and contact investigation are underway. Case-management and surveillance leads record each component’s actual start time. Measures started before actionable diagnosis are recorded as already underway, with their earlier timestamps preserved. These differ from measures started afterward, still pending, not required, or not documented. Eligible-contact vaccination is tracked separately because timing and eligibility differ. Initiation measures service delivery rather than demonstrated cessation of transmission.
Districts could use these proposed intervals alongside the 7-1-7 framework for prospective detection, notification, and early-response accountability [10]. The framework targets detection within seven days, notification within one day, and specified early response actions within seven days. We did not calculate retrospective 7-1-7 scores or treat a phylogenetic ancestor date as a detection trigger. Notification to responsible authorities and emergency declaration remain separate events.
Ethical considerations
The Sierra Leone Ethics and Scientific Review Committee (SLESRC) classified this work as an analysis of routine public documents. The committee approved it on May 7, 2026 (SLESRC-099-0111-2026). Standing authorization under Sierra Leone’s Public Health Act covered review and publication of publicly available surveillance data. Figure 1 uses weekly aggregates from the reconciled national surveillance dataset, consistent with the published national total [2]. National Public Health Agency leadership authorized secondary use of deidentified routine surveillance data. The surveillance analysis used weekly aggregates, involved no new participant contact, and reported no person-level records. Individual consent was not required for this aggregate document analysis. The qualitative source study received separate SLESRC approval (SLESRC-2025-049) and followed the Declaration of Helsinki. Participants provided written informed consent. Witnessed thumbprints were accepted for participants unable to write [5].
Lesson 1: combine surveillance with confidential accounts of care seeking
Participants described concealment, self-treatment, anticipated rejection, and loss of income [5]. In the early case series, patients presented a median of five days after onset (interquartile range, 3–8) [1]. Cases named a median of nine contacts (interquartile range, 6–14) [1]. Neither indicator is a validated stigma measure, so confidential patient accounts remain necessary to interpret possible disclosure barriers.
Transport, illness severity, and testing access can affect presentation times. Contact definitions, tracer workload, interviewing practices, and privacy can affect disclosure. District surveillance teams should combine routine indicators with confidential feedback on delays, refusals, and adverse social consequences. Nonjudgmental questioning should support disclosure. Changes in these indicators should prompt inquiry into access and interviewing conditions alongside stigma.
Genital or perianal lesions were recorded in five of the first 44 cases [1]. Differences from other outbreaks could reflect examination, reporting, case selection, or clinical variation, which the available data cannot distinguish. A broadly balanced national sex distribution also leaves transmission routes unresolved [2]. Communication should address adult social and close-contact networks without inferring exposure from sex or lesion location.
Lesson 2: sustain recognition and sampling between declared outbreaks
The Bayesian reconstruction dated the most recent common ancestor of lineage G.1 to September 27, 2024 (95% highest posterior density interval, August 12–November 11), before the first confirmation [4]. Participants described symptoms interpreted as familiar illnesses and repeated clinical encounters before testing [5]. These findings support concern about delayed detection. Neither source directly measured clinicians’ suspicion or identified every early infection.
District surveillance and clinical leads should maintain a national-guidance-based sampling pathway for unexplained vesicular or pustular rash. Pharmacies and drug sellers should refer eligible patients through this pathway. Clinicians can assess malaria and, where indicated and available, test alternative rash diagnoses alongside mpox. These proposed service arrangements require evaluation as testing algorithms. Another positive test should not automatically close an eligible mpox investigation. District budgets should cover kits, protective equipment, transport, and supervision.
Lesson 3: manage the entire diagnostic pathway, not laboratory capacity alone
Three laboratories performed early confirmation: the Central Public Health Reference Laboratory, Kenema Viral Haemorrhagic Fever Laboratory, and Jui P3 Laboratory [1]. Nine testing sites were functional by December [2]. Researchers later developed and field-evaluated a portable assay using clustered regularly interspaced short palindromic repeats (CRISPR) [11]. That evaluation addressed assay performance, with routine nationwide access during epidemic growth remaining a separate question.
The genomic reconstruction estimated approximately 10,400 infections (95% highest posterior density interval, 7,000–15,200) against 5,096 laboratory-confirmed cases included in the that analysis[4]. This analytical denominator differs from the 5,328 confirmed cases the same study reported by September 26 and from the final national total of 5,442. The JUNIPER transmission model inferred sequenced and unsequenced transmission using a fixed mutation rate, an 11.4-day generation interval, and a 15-day sojourn interval. The estimate concerns the modeled epidemic, including unobserved infections, rather than identifiable missed patients or the final national outbreak count. The model did not attribute infections missed by surveillance to stigma, transport, clinical recognition, and testing constraints.
The early median interval from symptom onset to laboratory confirmation was eight days (interquartile range, 6–11) [1]. Published summaries and weekly aggregates lack paired presentation, confirmation, and communication dates, so subtracting the five-day onset-to-presentation median yields no patient-level diagnostic interval. District teams should collect linked timestamps prospectively, with completeness reported for each stage. Laboratory and surveillance focal persons should track collection-to-receipt, receipt-to-result, and result-to-action times. Scheduled transport, urgent dispatch, sample tracking, and result-notification protocols are proposed remedies.
Lesson 4: make isolation accessible, supported, and clinically appropriate
Participants described scarce beds, uncertain admission, and fear of losing material support after disclosure [5]. These accounts informed our initial preference for supported home care. Later operational accounts described continuing household and close-contact transmission during home management [4]. Facility isolation expanded within the enhanced response from week 26 [4]. Investigators identified household transmission through contact histories and investigations [1]. The qualitative findings explain access barriers, while comparative isolation effectiveness requires epidemiological evaluation.
Notifications declined after the week 19 peak, before the enhanced response phase. Vaccination began in Western Area in week 13, expanded nationally from week 18, and included ring vaccination from week 23 [4]. Surveillance, laboratory access, and case management also changed during this period. The overlapping interventions and absence of a comparison group prevent estimation of their separate effects.
District case-management leads should assess household crowding, shared sleeping arrangements, caregiver needs, clinical severity, and food access before recommending placement. Their separate effects were not quantified here. Facility care requires reliable beds, transport, treatment, family communication, household support, and clear discharge criteria. Home care requires feasible separation, supplies, follow-up, and rapid referral. District teams should specify eligibility, alternatives when beds are unavailable, and a route for reviewing placement decisions.
Lesson 5: plan for workforce sustainability
Health workers described accumulated distress, demanding deployments, and uncertainty about allowances [5]. National records counted 22,536 contacts by December 14 [2]. The total describes cumulative workload, without linked measures of tracing quality or fatigue. Fatigue denotes reported experience, workload records assigned tasks, payment delay is an administrative exposure, and burnout requires a separate assessment.
District surveillance leads should monitor active assignments per tracer, available staff, deployment length, absence, payment timeliness, case interviews, and contact follow-up. Deterioration should trigger joint review of workload, transport, supervision, and payments. Preparedness budgets should fund surge rosters, relief teams, predictable allowances, handovers, and confidential psychosocial support. These proposed safeguards address sustained deployment without attributing tracing outcomes to an unmeasured cause.
Lesson 6: connect district sampling with national and regional genomic surveillance
The genomic study generated 338 genomes from 14 districts between January 10 and August 3, with two previously generated genomes also included [4]. It prioritized polymerase chain reaction (PCR)-positive specimens with cycle thresholds of 30 or lower. Sampling varied geographically and ended before outbreak closure. Supplementary Tables S2–S3 provide genomic methods, district counts, and source-specific analytical denominators.
Phylogeography estimated 71 lineage movements from Western Area Urban to other districts (95% highest posterior density interval, 56–88) [4]. These inferred transitions differ from individually verified journeys. The study documented travel histories for some United States cases and one German case, while Guinea sequences lacked confirmed travel histories [4]. Sparse regional sampling limits identification of the lineage’s country of origin.
District laboratory and surveillance teams can record travel histories, preserve suitable specimens, and identify geographic or temporal sampling gaps. National laboratories must fund specimen selection, sequencing, and feedback to districts. Regional authorities can establish shared alerts, minimum metadata, and cross-border review through Mano River Union mechanisms [12]. Representative regional sampling requires these national and regional contributions alongside district work.
District implementation and transferability
Table 2 translates the six lessons into a proposed package linking response delays to district responsibilities, resource requirements, and review triggers. The district medical officer should assign named staff within the active incident-management structure. The health information officer maintains the dashboard, with surveillance backup. The package requires prospective evaluation and did not undergo district piloting or formal endorsement.
A target specifies desired performance, a maximum interval defines the longest acceptable delay, and a trigger identifies the event requiring review. District teams should adopt national standards where available. Otherwise, a prospective baseline and capacity review should inform provisional targets, with immediate escalation for urgent clinical or safety failures. Poor baseline performance should not become an acceptable standard. Supplementary Table S4 defines the indicators and records actions already underway before diagnosis.
Lower-resource actions use existing registers, protected review time, private interviews, and communication protocols. Transport schedules and surge teams require recurrent operating funds. Supported isolation and sequencing require larger or externally coordinated resources. District medical officers should identify unfunded dependencies and escalate them through national coordination. Linked timestamps, named responsibility, confidential engagement, and funded follow-through can transfer to comparable settings. Disease-specific sampling, isolation eligibility, contact definitions, and vaccination policy require local adaptation.
Limitations
This purposive, practitioner-informed synthesis combines reported experience with surveillance and research findings. Shared institutional roles may influence source selection and interpretation despite source separation and examination of counter-examples. The early series contained 44 cases. The qualitative sample covered four districts and may underrepresent people who avoided services or community recruitment channels. Participant totals and session counts describe different units.
Routine records varied in completeness, and weekly aggregates lack the individual records needed to reassess reconciliation or diagnostic turnaround. Genomic inference depends on selected samples, model assumptions, and incomplete regional coverage. Concurrent interventions and the absence of linked comparative outcomes limit causal interpretation. Informal expert consensus and retrospective mapping support lesson development, while the proposed intervals and package require prospective evaluation.
Six lessons identify district responsibilities across care seeking, diagnosis, and supported response. Because the lessons span the whole response pathway rather than a single service, districts need linked timestamps, named responsibility, confidential engagement, and funded follow-through. Sierra Leone ended the declared national outbreak under surveillance criteria, while undetected infection and regional transmission remain possible. Concurrent interventions prevent separate estimates of their effects. District medical officers should begin prospective evaluation of linked timestamps and funded service arrangements that could help shorten delays.
What is already known about the topic
What this study adds
The authors declare no competing interests. Their operational roles are described in the methods. The views expressed are those of the authors and do not necessarily represent the official position of the National Public Health Agency or the Ministry of Health.
Data availability
Supplementary File 2 contains the weekly counts, response milestones, and calculations underlying Figure 1. The weekly counts come from the reconciled national dataset and total 5,442, consistent with Situation Report 335 [2]. It contains no names, case identifiers, addresses, or individual clinical records. Supplementary File 1 documents the evidence synthesis and indicator definitions. The National Public Health Agency and Ministry of Health retain the individual surveillance records and operational documentation. Further deidentified data may be requested from the corresponding author, subject to institutional authorization, applicable ethics approval, and data-protection safeguards. Access to data underlying the cited studies follows their published arrangements [1,4,5].
Conceptualization: Eric Nzirakaindi Ikoona, Lucy Namulemo, Foday Sahr
Methodology: Eric Nzirakaindi Ikoona, Lucy Namulemo, Mohamed Alex Vandi, Foday Sahr
Data Curation: Eric Nzirakaindi Ikoona, Lucy Namulemo, Mary Magdalene Sinnah, Mohamed Alex Vandi, Foday Sahr
Formal Analysis: Lucy Namulemo, Eric Nzirakaindi Ikoona, Mary Magdalene Sinnah
Investigation: Eric Nzirakaindi Ikoona, Lucy Namulemo, Mary Magdalene Sinnah, Foday Sahr
Project Administration: Eric Nzirakaindi Ikoona, Lucy Namulemo, Mary Magdalene Sinnah, Mohamed Alex Vandi, Foday Sahr
Resources: Eric Nzirakaindi Ikoona, Lucy Namulemo, Mary Magdalene Sinnah
Software: Eric Nzirakaindi Ikoona, Lucy Namulemo, Mary Magdalene Sinnah
Validation: Eric Nzirakaindi Ikoona, Lucy Namulemo, Mary Magdalene Sinnah, Mohamed Alex Vandi, Foday Sahr
Visualization: Eric Nzirakaindi Ikoona, Lucy Namulemo, Mary Magdalene Sinnah
Supervision: Eric Nzirakaindi Ikoona, Lucy Namulemo
Writing – Original Draft: Eric Nzirakaindi Ikoona, Mohamed Alex Vandi, Foday Sahr
Writing – Review & Editing: Eric Nzirakaindi Ikoona, Lucy Namulemo, Mary Magdalene Sinnah, Mohamed Alex Vandi, Foday Sahr
Supplementary Files
| Lesson | Direct evidence and source | Operational interpretation | Support and inferential boundary |
|---|---|---|---|
| 1. Confidential care seeking | Early presentation/contact summaries [1]. Participant accounts of concealment and care avoidance [5]. | Pair routine timeliness and contact indicators with confidential patient feedback. | Convergent evidence for reported barriers. Their population frequency and causal contribution are unmeasured. Indicators are not validated stigma scales. |
| 2. Sustained recognition | Early detection chronology [1]. Later ancestor dating [4]. Diagnostic-journey accounts [5]. | Maintain a rash-recognition and specimen-referral pathway between emergencies. | Evidence supports an early detection gap. Clinical suspicion and the contribution of individual causes were not directly measured. |
| 3. End-to-end diagnosis | Three early laboratories [1]. Nine functional sites by December [2]. Coordination accounts [5]. Modeled under-ascertainment [4]. | Track collection, transport, testing, communication, and action separately. | Laboratory counts and reported delays are descriptive. A national patient-level diagnostic interval and effects of proposed remedies are not estimated. |
| 4. Supported isolation | Perceived bed and support barriers [5]. Close-contact investigations [1]. Overlapping intervention chronology [2,4]. | Assess feasibility of each placement and fund clinical, transport, and household support. | Support for reported barriers and temporal overlap. Comparative isolation effectiveness is undetermined. |
| 5. Workforce sustainability | Workforce accounts [5]. Contact workload and response activities [1,2]. | Monitor workload, deployment, absence, and payment. Prearrange surge and relief support. | Accounts support concern about sustainability. No standardized fatigue or burnout outcome, or causal effect on tracing quality, was measured. |
| 6. Multi-level genomic surveillance | Early and later genomic sampling [1,4]. District surveillance and laboratory operations [2]. | Districts provide specimens and metadata. National and regional partners coordinate sequencing and alerts. | Sampling was limited and uneven. Geographic origin and precise transmission histories remain conditional on sampled data. |
| Operational gap / evidence | Minimum action and responsible function | Indicator | Review trigger and cadence | Correction / resource tier |
|---|---|---|---|---|
| Care avoidance [1,5] | Private case/contact interviews and brief patient feedback. Surveillance lead with risk-communication focal person. | Onset-to-presentation. Interview refusal. Contacts named. Stated reasons for delay. | Weekly review of delay/refusal patterns or any confidentiality complaint. No validated stigma cutoff. | Review privacy, language, access, and support barriers. Low: staff time and protected space. |
| Unrecognized rash [1,4,5] | Apply sampling/referral algorithm. Orient facilities and informal first-contact providers. Surveillance officer and clinical focal person. | Eligible rash presentations sampled / all eligible presentations. Completeness of eligibility recording. | Weekly performance below the district target or a suspected missed cluster. | Replenish supplies, retrain, investigate. Medium: kits, protective equipment, supervision. |
| Specimen delay [1,2,5] | Scheduled transport plus urgent dispatch and sample tracking. District laboratory focal person. | Collection-to-laboratory receipt. Specimens exceeding the maximum interval. | Any breached maximum. Review weekly and escalate urgent specimens immediately. | Restore transport and investigate handoffs. Medium: fuel, packaging, couriers. |
| Delayed actionable diagnosis [1,5] | Results register and clinician/district notification protocol. Laboratory and surveillance focal persons. | Receipt-to-result. Result-to-acknowledgment. Presentation-to-actionable diagnosis. | Any breached maximum or unacknowledged actionable result. Weekly backlog review. | Resolve testing or communication bottleneck. Low–medium: communication and protected staff time. |
| Unsupported isolation [1,4,5] | Assess placement feasibility and find care/household support. Case-management lead, district medical officer, and council liaison. | Time to supported placement. Support delivered / support required. Reasons for nonacceptance. | Any unsafe placement, unmet essential support, or breached placement interval. Weekly review. | Arrange beds, transport, supplies, or safe alternative. High: recurrent clinical and household support. |
| Tracing overload [2,5] | Maintain surge roster, relief teams, and payment calendar. Surveillance lead with finance/logistics focal person. | Active assignments per tracer. Payment delay. Case-interview and contact-follow-up completion. | Caseload above locally agreed capacity or overdue payment. Twice weekly during surges. | Rebalance work, deploy relief, resolve arrears. Medium: surge staff, transport, allowances. |
| Unrepresentative sampling [1,4] | Track district/week coverage. Refer selected specimens. District laboratory focal person with national genomic lead. | Eligible specimens forwarded. District/week representation. Sequence-feedback time. | Sampling or feedback gaps against the national plan. Monthly and during cluster alerts. | Target gaps and escalate sequencing capacity. Medium locally. High national/regional dependency. |
| Weak local analysis [1,2] | Protected dashboard and decision-log time. Health information officer with surveillance backup. | Bulletin issued on time. Actions assigned, funded, and closed. | Late bulletin or unassigned corrective action. Weekly. | Activate backup. Resolve data or resource gaps. Low: protected analysis and review time. |