Research | Open Access | Volume 9 (2): Article 87 | Published: 29 May 2026

Views: 1,992
Menu, Tables and Figures
| Characteristics | Measles IgM results | Total (%) | |
|---|---|---|---|
| Negative (%) | Positive (%) | ||
| Sex | |||
| Female | 437 (79.0) | 116 (21.0) | 553 (43.7) |
| Male | 591 (82.9) | 122 (17.1) | 713 (56.3) |
| Age Group | |||
| <1 yr | 265 (82.8) | 55 (17.2) | 320 (25.3) |
| 1–5 yrs | 334 (77.1) | 99 (22.9) | 433 (34.2) |
| 6–10 yrs | 272 (82.9) | 56 (17.0) | 328 (25.9) |
| 11–15 yrs | 101 (84.2) | 19 (15.8) | 120 (9.5) |
| >15 yrs | 56 (86.2) | 9 (13.9) | 65 (5.1) |
| Vaccination status | |||
| Unvaccinated | 185 (68.8) | 84 (31.2) | 269 (21.3) |
| 1 dose | 454 (86.2) | 73 (13.9) | 527 (41.6) |
| >=2 doses | 260 (94.5) | 15 (5.5) | 275 (21.7) |
| Unknown | 129 (66.2) | 66 (33.9) | 195 (15.4) |
| Region | |||
| CRR | 155 (91.2) | 15 (8.8) | 170 (13.4) |
| LRR | 113 (95.0) | 6 (5.0) | 119 (9.4) |
| NBE | 161 (89.0) | 20 (11.1) | 181 (14.3) |
| NBW | 38 (97.4) | 1 (2.6) | 39 (3.1) |
| URR | 148 (84.6) | 27 (15.4) | 175 (13.8) |
| WR1 | 268 (69.6) | 117 (30.4) | 385 (30.4) |
| WR2 | 145 (73.6) | 52 (26.4) | 197 (15.6) |
| Residence | |||
| Rural | 667 (89.3) | 80 (10.7) | 747 (59.0) |
| Urban | 361 (69.6) | 158 (30.4) | 519 (41.0) |
| Outcome | |||
| Alive | 1025 (81.2) | 237 (18.8) | 1262 (99.7) |
| Dead | 3 (75.0) | 1 (25.0) | 4 (0.3) |
Table 1: Distribution and Measles IgM Positivity among Cases by Demographic Characteristics 2014-2024, The Gambia
| Year | CRR | LRR | NBE | NBW | URR | WR1 | WR2 | National |
|---|---|---|---|---|---|---|---|---|
| 2014 | 4.4 | 6.1 | 8.9 | 1.8 | 4.5 | 4.40 | 6.0 | 5.2 |
| 2015 | 9.5 | 16.9 | 12.2 | 0.0 | 0.0 | 2.5 | 8.2 | 7.0 |
| 2016 | 0.9 | 4.8 | 0.9 | 0.9 | 0.8 | 1.20 | 1.7 | 1.6 |
| 2017 | 3.7 | 9.4 | 7.5 | 2.5 | 0.4 | 2.5 | 2.1 | 4.0 |
| 2018 | 4.1 | 19.8 | 2.4 | 6.6 | 3.3 | 0.9 | 1.1 | 5.5 |
| 2019 | 4.0 | 2.3 | 4.0 | 4.0 | 2.9 | 0.7 | 1.9 | 2.8 |
| 2020 | 1.2 | 5.7 | 0.8 | 0.0 | 1.4 | 3.0 | 1.9 | 2.0 |
| 2021 | 0.0 | 7.9 | 0.0 | 0.0 | 0.7 | 0.4 | 0.6 | 1.4 |
| 2022 | 2.6 | 20.0 | 7.5 | 3.9 | 3.7 | 7.5 | 4.0 | 7.0 |
| 2023 | 12.4 | 6.6 | 73.6 | 4.6 | 6.2 | 3.7 | 1.8 | 15.5 |
| 2024 | 18.2 | 31.4 | 6.5 | 6.0 | 26.7 | 2.8 | 2.6 | 13.5 |
| Characteristics | Crude OR (95% CI) | P-value | Adjusted OR (95% CI) | P-value |
|---|---|---|---|---|
| Sex | ||||
| Male | 1 | 1 | ||
| Female | 1.29 (0.97 – 1.71) | 0.08 | 1.21 (0.89 – 1.65) | 0.219 |
| Age Group | ||||
| <1 yr | 1.29 (0.60 – 2.76) | 0.51 | 1.47 (0.66 – 3.31) | 0.35 |
| 1–5 yrs | 1.84 (0.88 – 3.86) | 0.14 | 2.87 (1.30 – 6.32) | 0.01 |
| 6–10 yrs | 1.28 (0.60 – 2.74) | 0.52 | 1.63 (0.73 – 3.60) | 0.32 |
| 11–15 yrs | 1.17 (0.50 – 2.76) | 0.72 | 1.50 (0.61 – 3.70) | 0.38 |
| >15 yrs | 1 | 1 | ||
| Vaccination Status | ||||
| Unvaccinated | 1 | 1 | ||
| 1 dose | 0.354 (0.248 – 0.506) | <0.001 | 0.32 (0.216 – 0.47) | <0.001 |
| 2 doses | 0.13 (0.071 – 0.227) | <0.001 | 0.11 (0.060 – 0.21) | <0.001 |
| Unknown | 1.13 (0.760 – 1.669) | 0.55 | 1.01 (0.65 – 1.57) | 0.97 |
| Region | ||||
| CRR | 1 | 1 | ||
| LRR | 0.55 (0.21 – 1.46) | 0.23 | 0.64 (0.24 – 1.74) | 0.38 |
| NBE | 1.28 (0.63 – 2.60) | 0.49 | 1.18 (0.57 – 2.45) | 0.67 |
| NBW | 0.27 (0.035 – 2.12) | 0.21 | 0.35 (0.04 – 2.78) | 0.32 |
| URR | 1.89 (0.964 – 3.69) | 0.06 | 2.17 (1.08 – 4.36) | 0.03 |
| WR1 | 4.51 (2.54 – 8.00) | 0.00 | 2.36 (1.12 – 4.96) | 0.02 |
| WR2 | 3.71 (2.00 – 6.87) | <0.001 | 2.24 (1.13 – 4.77) | 0.03 |
| Residence | ||||
| Rural | 1 | 1 | ||
| Urban | 3.65 (2.709 – 4.92) | <0.001 | 1.76 (1.05 – 2.94) | 0.03 |
| Mean VIF = 1.84 | ||||
Abdoulie Janneh1,2,&, Bakalilu Kijera1,2, Amadou Barry2, Obafemi Joseph Babalola3
1Expanded Programme on Immunization, Ministry of Health, The Gambia, 2The Gambia Field Epidemiology Programme (Gam-FETP), 3African Field Epidemiology Network, Plot 42, Lugogo Bypass, Kampala, Uganda
&Corresponding author: Abdoulie Janneh, Expanded Programme on Immunization, Ministry of Health, The Gambia, Email: bambagulu@yahoo.com, ORCID: https://orcid.org/0009-0003-3794-3272
Received: 03 Feb 2026, Accepted: 27 May 2026, Published: 29 May 2026
Domain: Infectious Disease Epidemiology
Keywords: Measles, surveillance, vaccination coverage, The Gambia, disease elimination, public health action, epidemiology
©Abdoulie Janneh et al. Journal of Interventional Epidemiology and Public Health (ISSN: 2664-2824). This is an Open Access article distributed under the terms of the Creative Commons Attribution International 4.0 License (https://creativecommons.org/licenses/by/4.0/), which permits unrestricted use, distribution, and reproduction in any medium, provided the original work is properly cited.
Cite this article: Abdoulie Janneh et al., Suboptimal vaccination and diagnostic bottlenecks fuel persistent measles transmission in The Gambia: An 11-year retrospective study. Journal of Interventional Epidemiology and Public Health. 2026; 9(2):87. https://doi.org/10.37432/jieph-d-26-00034
Introduction: Despite national efforts toward measles elimination, the disease remains a significant public health challenge in The Gambia. Recurrent outbreaks are driven by suboptimal vaccination coverage, consistently falling below the 95% herd immunity threshold. This study analysed years of national surveillance data (2014–2024) to assess the epidemiology, vaccine impact, and performance of the national measles surveillance system.
Methods: We conducted a retrospective, population-based cross-sectional study using the national vaccine-preventable disease (VPD) surveillance database. A total of 1,266 suspected cases were analysed. Annual incidence rates per million population were calculated, and surveillance performance was evaluated against WHO-AFRO benchmarks. Multivariate logistic regression was employed to identify independent predictors of laboratory-confirmed (IgM+) measles.
Results: Of the 1,266 cases, 238 (18.8%) were laboratory-confirmed. The highest incidence was recorded in 2015 (32.8 cases per million), significantly exceeding the WHO elimination target of < 1 per million. The sensitivity of the surveillance system, measured by the non-measles febrile rash illness (NMFRI) rate, met the WHO benchmark of ≥ 2 per 100,000 population in nine out of the eleven years studied. Children aged 1–5 years represented 41.6% of confirmed cases. A strong dose-dependent protective effect was observed: receipt of ≥ 2 doses was associated with an 88.8% reduction in the odds of infection (aOR: 0.11; 95%CI: 0.06–0.20; p < 0.001). Geographically, Western Region 1 (WR1) and Western Region 2 (WR2) were identified as the primary epicentres. While the system met targets for notification (89%) and investigation (97%), sample transportation timeliness was critically low in the Upper River Region (46%).
Conclusion: The Gambian measles surveillance system is sensitive and timely in detection; however, persistent transmission is associated with an immunity gap among young children in urban hotspots. The disparity in sample transportation logistics for remote regions like the Upper River Region poses a risk of delayed outbreak confirmation. We recommend that the Ministry of Health prioritise “mop-up” vaccination campaigns and supplementary immunisation activities (SIAs) specifically in Western Regions 1 and 2 to address urban transmission. Furthermore, a dedicated logistics framework must be established to improve sample transport timeliness in the Upper River Region to meet the national 5-day laboratory receipt benchmark.
Measles remains one of the most highly transmissible human pathogens, with a basic reproduction number (R0) ranging from 12 to 18, necessitating a critical herd immunity threshold of at least 95% to interrupt endemic transmission [1, 2]. Despite the availability of a safe, cost-effective, and highly efficacious vaccine for over five decades, measles continues to pose a formidable challenge to global health security [3]. The World Health Organisation (WHO) and United Nations Children’s Fund (UNICEF) have established ambitious elimination targets centred on four foundational pillars: achieving 95% coverage with two doses of measles-containing vaccine (MCV), implementing strategic supplementary immunisation activities (SIAs), maintaining robust case-based surveillance, and optimising clinical management[4, 5].
Globally, significant strides have been made, with an estimated 57 million deaths averted between 2000 and 2022 [6]. However, this progress remains precariously fragile. In recent years, a global resurgence of measles has been observed, exacerbated by the catastrophic disruptions to routine immunisation and surveillance systems caused by the COVID-19 pandemic[7]. Between 2021 and 2022 alone, estimated global measles cases rose by 18%, while related mortality increased by 43%, with the most severe burden concentrated within the WHO African Region (AFRO) [8].
The Gambia, a nation historically recognised for its strong Expanded Programme on Immunisation (EPI), currently faces a critical inflexion point[9]. Despite the integration of MCV into national policy, the country has struggled to maintain the requisite 95% coverage for both MCV1 and MCV2[10]. In 2024, administrative coverage was reported at 82% and 75%, respectively—figures that fall significantly below the threshold required for herd immunity [11]. This persistent “immunity gap” has catalysed 18 sporadic outbreaks between 2014 and 2023, resulting in a burgeoning pool of susceptible individuals. Estimates suggest that by the end of 2025, approximately 129,538 children under five years of age will be susceptible to measles, a cohort exceeding the annual national birth rate and signalling an imminent risk for large-scale epidemics [12].
Central to the elimination agenda is the performance of the measles surveillance system[13]. While The Gambia’s surveillance framework has shown high sensitivity in case investigation, operational bottlenecks—particularly regarding the timeliness of sample logistics from remote regions such as the Upper River Region (URR)—threaten the efficacy of outbreak detection and response [14].
The primary hypothesis states that in The Gambia, individuals who have received two or more measles vaccines have significantly lower odds of laboratory-confirmed measles infection than unvaccinated individuals. Meanwhile, the secondary hypotheses are: Children aged 1-5 years are more likely to have laboratory-confirmed measles infection compared to other age groups, residents of Western 1 Health Region and Western 2 Health Region have higher odds of laboratory-confirmed measles infection than residents in other regions of the Gambia, timeliness of sample transportation to the national laboratory from remotest regions is lower than from other regions. The main objective of the study is to evaluate the performance of The Gambia’s national measles surveillance system from 2014 to 2024 and describe trends in measles incidence during the same period.
The study also intends to determine the annual national incidence and temporal trends of reported measles cases in The Gambia from 2014 to 2024, evaluate the sensitivity of the national measles surveillance system in detecting measles cases, assess the timeliness of case notification, investigation, and specimen transportation within the surveillance system and identify surveillance performance gaps and provide recommendations for strengthening measles elimination efforts.
Study Design
We conducted a nationwide, retrospective analysis of case-based surveillance data with repeated annual cross-sectional assessments (January 1, 2014, to December 31, 2024). The study was designed to evaluate the epidemiological trends of measles and the longitudinal performance of the national surveillance system in accordance with the Strengthening the Reporting of Observational Studies in Epidemiology (STROBE) guidelines.
Study Setting
The study was conducted in The Gambia, a West African nation with an estimated land area of 10,689 km² and a decentralized healthcare system organized into seven Regional Health Directorates (RHDs): Western 1 (WR1), Western 2 (WR2), Lower River (LRR), North Bank West (NBWR), North Bank East (NBER), Central River (CRR), and Upper River (URR)[15]. Measles surveillance is integrated into the national Integrated Disease Surveillance and Response (IDSR) framework. The system relies on a multi-tiered reporting structure. For active case search, Surveillance focal points and District Surveillance Officers (DSOs) conduct routine facility visits and mandatory weekly “zero reporting” to ensure the detection of febrile rash illnesses. Community-based disease notification utilises community informants and traditional healers who are sensitised to use a simplified case definition to facilitate prompt reporting at the primary care level. Lastly, biological samples collected from suspected cases are transported to the National Public Health Laboratory for serological confirmation via IgM enzyme-linked immunosorbent assay (ELISA)[16].
According to the Gambia Bureau of Statistics, “A settlement is considered urban if it satisfies most of the following: has commercial importance, has institutional importance, majority of the population should be non-agricultural in occupation, population should be 5,000 and above, density should be high, some degree of infrastructure should be available while a settlement that does not meet the criteria for urban above is considered rural”[17] The predominantly rural regions are North Bank Region West, North Bank Region East, Lower River Region, Central River Region, and Upper River Region, while Western 2 Health Region is predominantly urban, and the whole of Western 1 Health Region is completely urban.
Study population and case definitions
The study population comprised all suspected measles cases notified to the national vaccine-preventable disease (VPD) surveillance database during the study period. A suspected measles case was defined as “any person presenting with a generalised maculopapular rash and fever.” Initial extraction yielded 1,290 records. We performed rigorous data validation, excluding 24 entries due to biologically implausible dates (e.g., investigation preceding notification), missing primary outcomes, or lack of vaccination history. The final analytical cohort consisted of 1,266 cases.
Data sources and variables
Data were extracted from the central national VPD surveillance database (Epi Info version 3.5). The primary outcome is the laboratory-confirmed measles status (IgM positive vs. IgM negative). Independent variables are the demographics, i.e., age (categorised as <1 yr, 1–5 yrs, 6–10 yrs, 11–15 yrs, and >15 yrs), sex, region of residence, and urbanicity. For immunological history, documented vaccination status is classified as unvaccinated, one dose, or ≥ 2 doses of measles-containing vaccine (MCV). Also, the date of rash onset, the date of notification, and the date of investigation were extracted. The vaccination status is obtained from the national preventable disease surveillance database developed by the World Health Organization. Data are collected from facility-level case investigation forms, which are entered into the dataset weekly. Information on measles vaccination is collected from multiple sources, including vaccination cards, the electronic immunisation register, and recall. However, there is no variable called the source of proof of vaccination on the national database. In the national database, vaccination status was categorised as unvaccinated, one dose, two or more doses of measles-containing vaccines, or unknown when reliable documentation or caregivers were unable to recall, and this has the tendency to cause recall bias or misclassification of vaccination status.
Surveillance performance indicators were assessed using standardised WHO-AFRO measles elimination indicators. For sensitivity, non-measles febrile rash illness (NMFRI) rate (Benchmark: ≥ 2 per 100,000 population), notification timeliness is the proportion of cases notified within 48 hours of rash onset, investigation timeliness is the proportion of cases investigated with a home visit within 48 hours of notification, and specimen logistics is the proportion of samples received at the national laboratory within 5 days of collection.
Data analysis
Data cleaning was finalised in Microsoft Excel, with all statistical computations performed using Epi Info and STATA. We summarised demographic and clinical characteristics using frequencies and proportions. Annual national and regional incidence rates per million population were calculated using Ministry of Health population projections as denominators. model. Bivariate analyses were first conducted to assess the association between each independent variable and the outcome variable. Variables with a P-value of ≤ 0.20 in bivariate analysis were included in the multivariate logistic regression to identify independent predictors of measles infection. Strength of association was reported as Adjusted Odds Ratios (aOR) with 95% Confidence Intervals (CI). A p-value < 0.05 was considered statistically significant. Variance inflation factor (VIF) and tolerance statistics were examined to evaluate potential multicollinearity, with a cut-off VIF of less than 5 used among independent variables.
Ethical Considerations
As this study involved the secondary analysis of de-identified, routine public health surveillance data, it was exempt from formal institutional review board (IRB) approval. Administrative authorisation was obtained from the Ministry of Health and the Regional Health Directorates. All data were managed on password-protected systems to maintain patient confidentiality in accordance with national data protection protocols.
Between January 2014 and December 2024, a total of 1,291 suspected measles cases were notified through the national surveillance system. Following rigorous data cleaning and validation, 1,266 cases were included in the final analysis. Of these, 238 (18.8%) were laboratory-confirmed via IgM ELISA. The confirmed cohort exhibited a slight male predominance (56.3%, n = 122). Children aged 1–5 years constituted the highest burden of disease, accounting for 41.6% (n = 99) of laboratory-confirmed cases (Table 1). Urban residents were disproportionately affected, representing 66.4% (n = 158) of the confirmed burden. Regarding clinical outcomes, four deaths were recorded during the study period, one of which was laboratory-confirmed as measles (CFR: 0.4%).
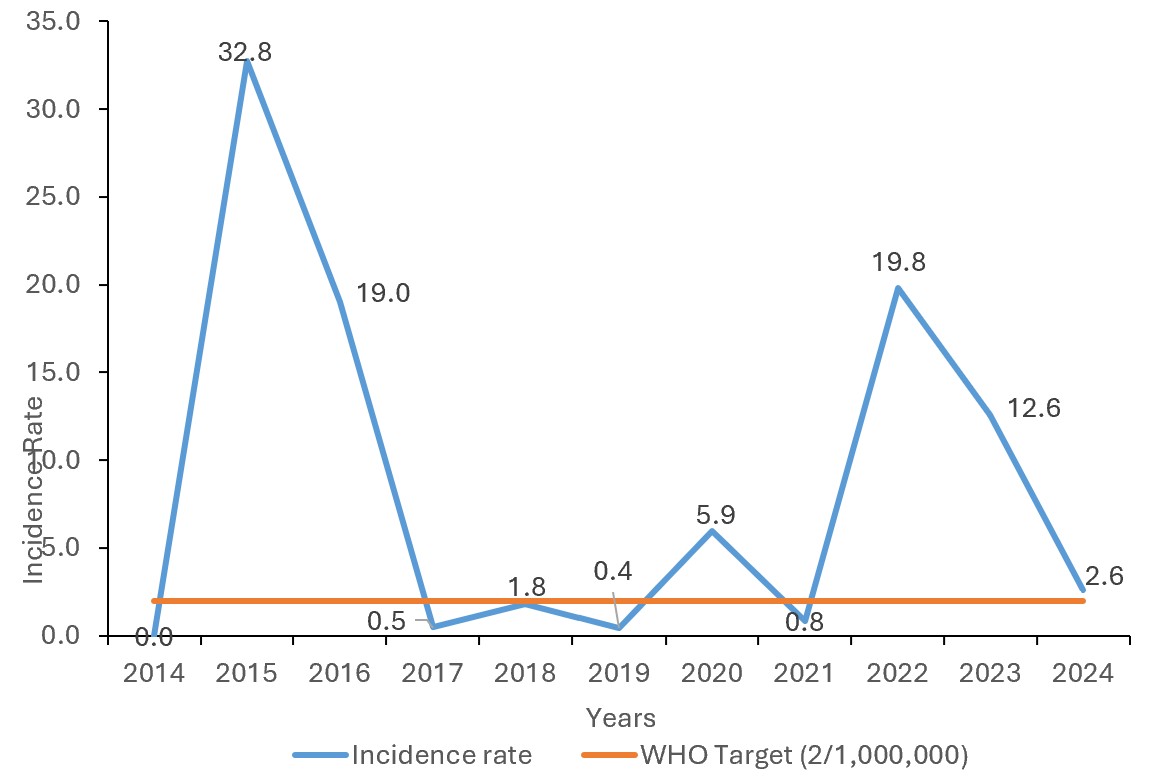
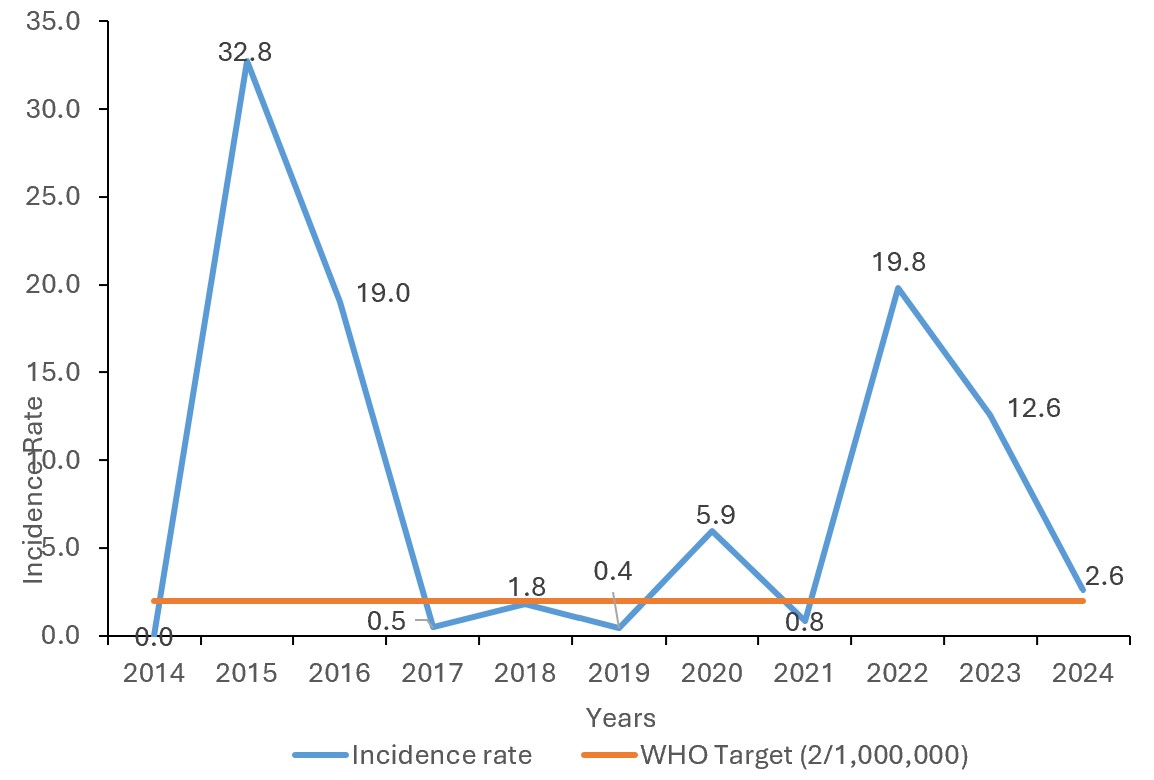
The national incidence of measles exhibited significant inter-annual variability (Figure 1). The highest incidence was recorded in 2015 at 32.8 cases per million population, markedly exceeding the WHO elimination target of <1 per million. Other significant peaks were observed in 2020 (19.8 cases per million) and 2016 (19 cases per million).
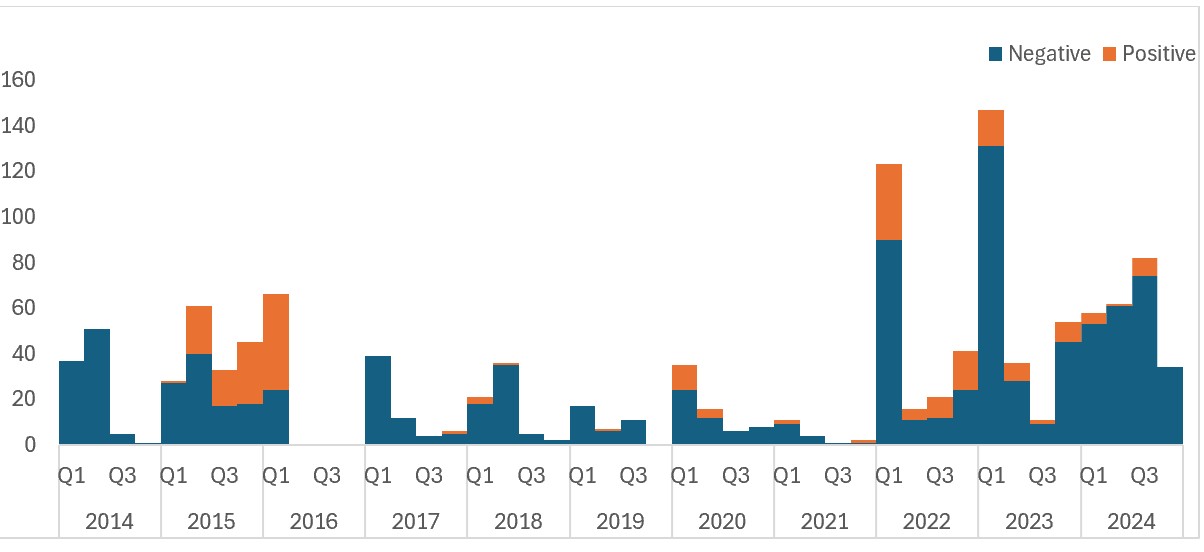
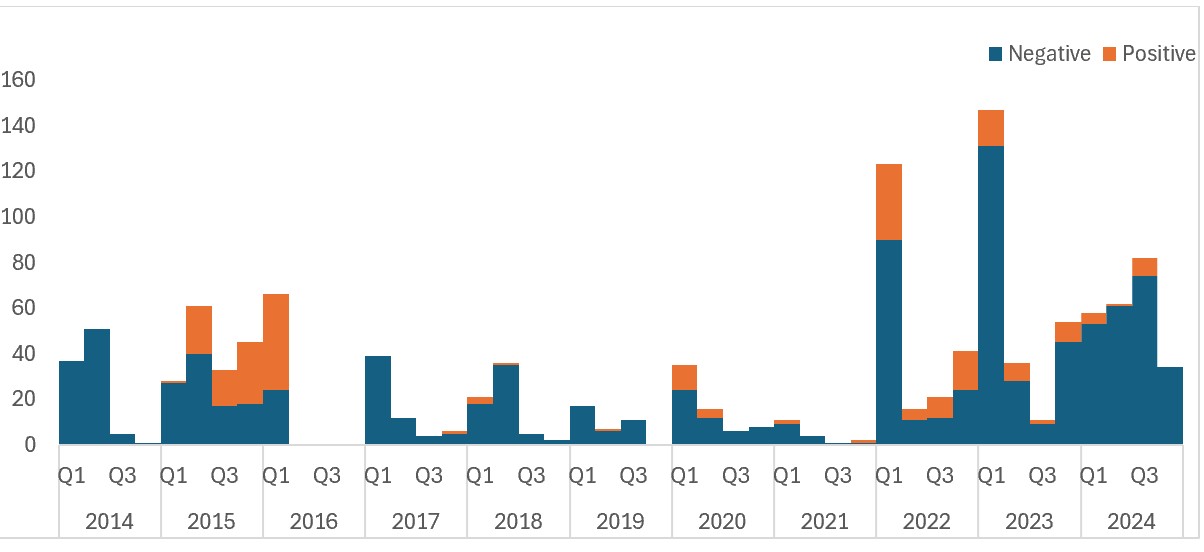
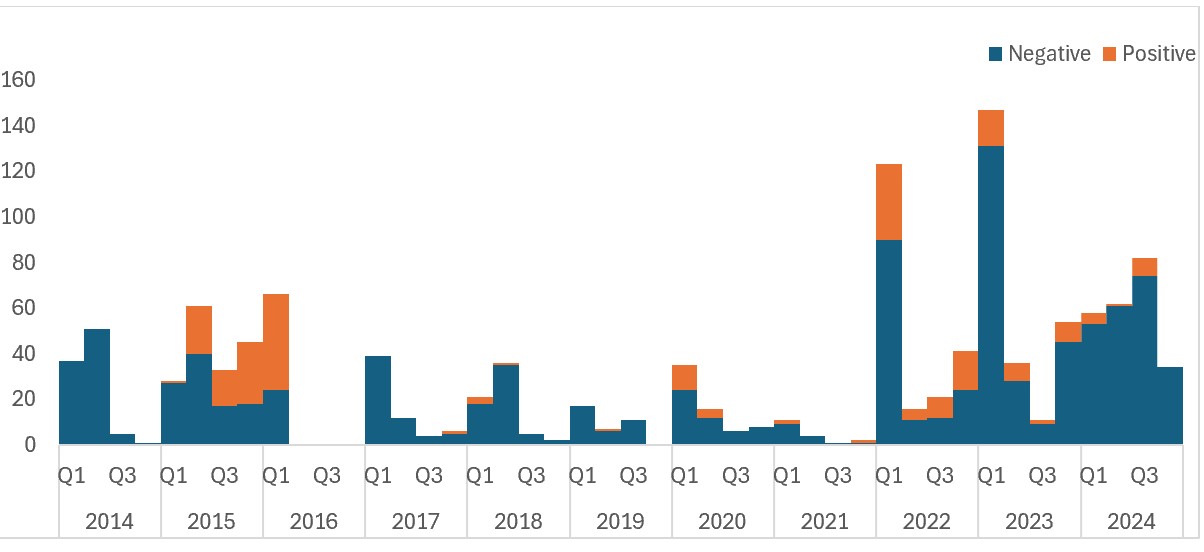
Quarterly trend analysis (Figure 2) revealed distinct epidemic waves, notably between Q2, 2015 and Q1, 2016, and again from Q4, 2017, to Q2, 2018. By the final quarter of 2024, cases were categorised as sporadic rather than indicative of an active outbreak.
Surveillance system performance
The sensitivity of the surveillance system, measured by the non-measles febrile rash illness (NMFRI) rate, met the WHO benchmark of ≥ 2 per 100,000 population in nine out of the eleven years studied. The targets were not achieved in 2016 and 2021, both recording a rate of 1.0 (Table 2).
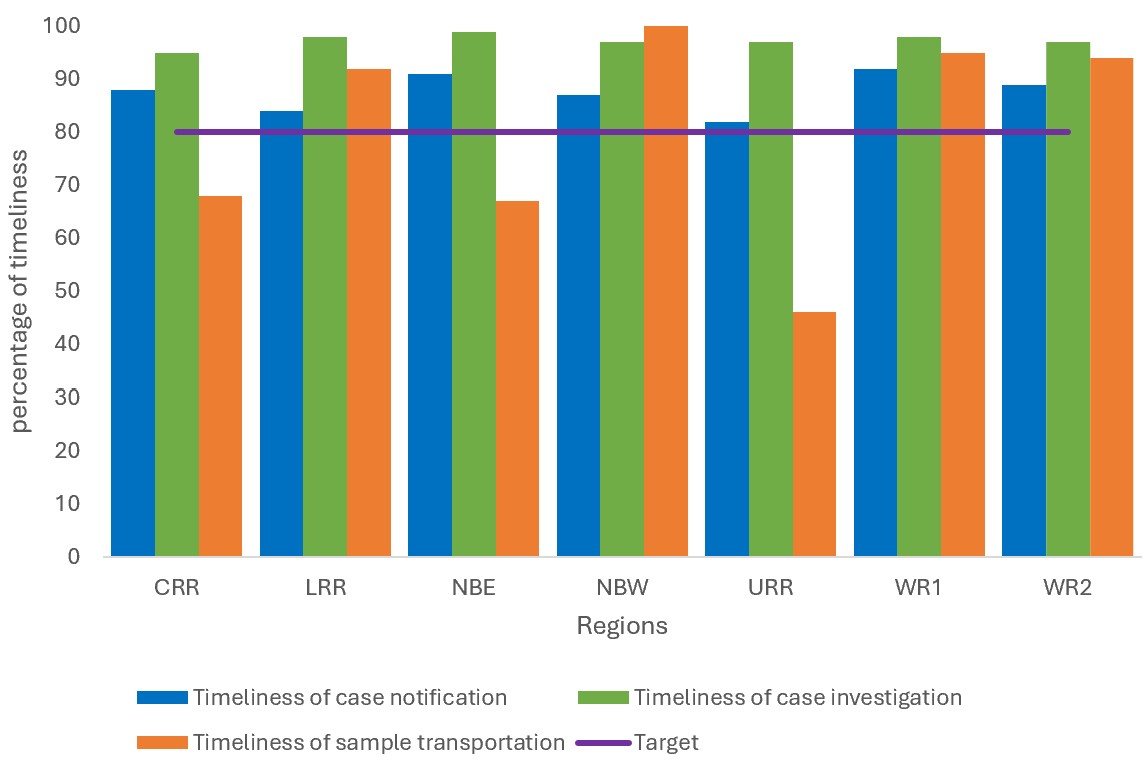
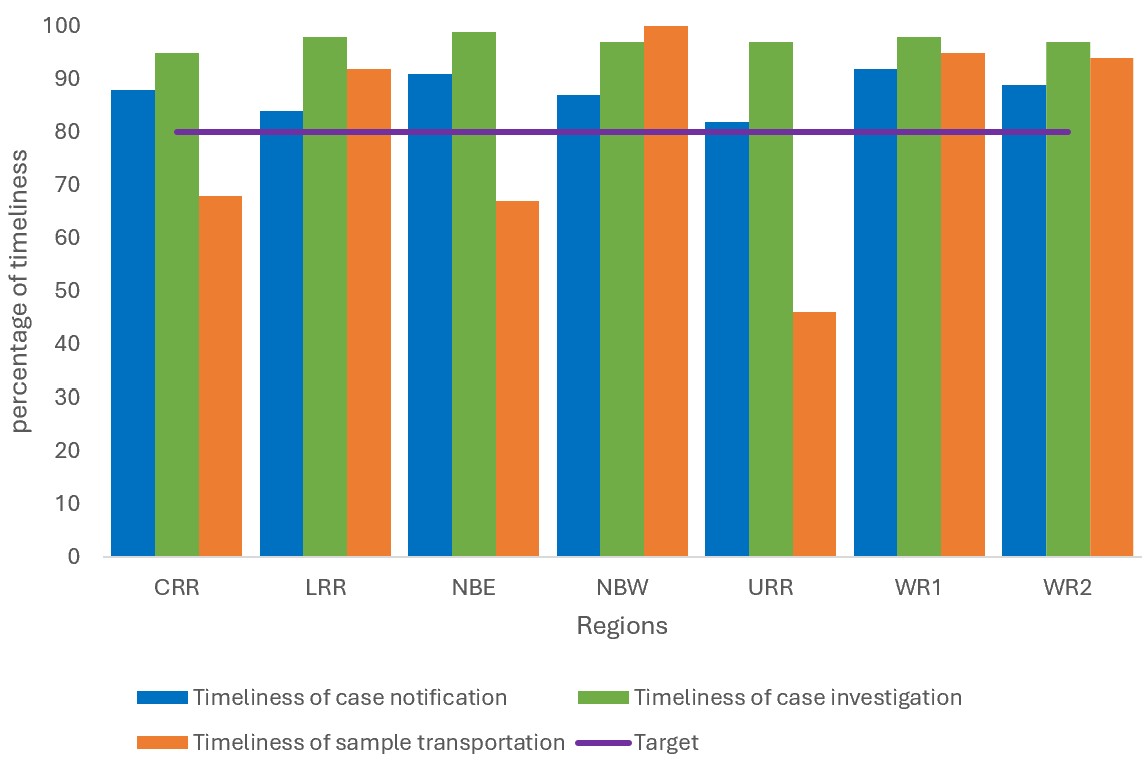
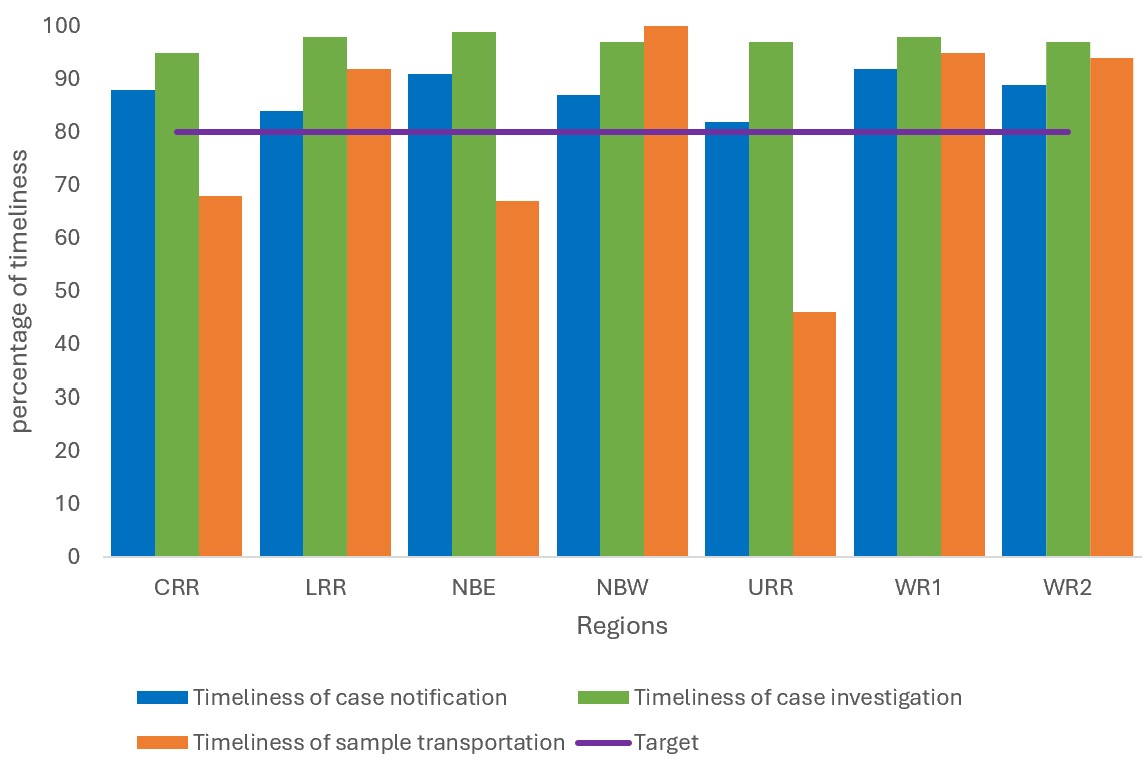
Nationally, the surveillance system demonstrated high performance in process indicators, notification timeliness (cases notified within 48 hours) was 89%, investigation timeliness (within 48 hours) was 97% of cases investigated, and specimen logistics of samples reaching the laboratory within 5 days was 81%. However, significant regional disparities were noted; the Upper River Region (URR) reported a critically low specimen transportation timeliness of 46% (Figure 3).
A clear dose-dependent protective effect was observed across the cohort. The positivity rate was highest among unvaccinated individuals (31.2%), decreasing to 14.0% for those with one dose and 5.4% for those who received two or more doses (p < 0.001).
Factors associated with laboratory-confirmed measles among suspected cases
Multivariate logistic regression (Table 3) identified several independent predictors of laboratory confirmation. Receipt of two or more doses was associated with an 88.8% reduction in the odds of positivity (aOR: 0.11; 95%CI: 0.06–0.20; p < 0.001) compared to unvaccinated children. Children aged 1–5 years had nearly three times higher odds of infection (aOR: 2.87; 95%CI: 1.30–6.31; p = 0.01) relative to those >15 years. Residing in Western Region 1 (aOR: 2.36; 95%CI: 1.12–4.95) or Western Region 2 (aOR: 2.23; 95% CI: 1.13–4.76) significantly increased the odds of being a case. Living in an urban area was independently associated with a 1.76-fold increase in the odds of being a laboratory-confirmed case (p = 0.03). The mean VIF was 1.84, indicating no evidence of significant multicollinearity.
This 11-year analysis of measles surveillance in The Gambia (2014–2024) provides a comprehensive assessment of the nation’s trajectory toward the WHO measles elimination goals. Our findings reveal a persistent circulation of the measles virus, characterised by periodic surges that consistently exceed the WHO-AFRO elimination threshold of <1 case per million population [18]. While the surveillance system demonstrates robust sensitivity and early response capabilities, the persistent incidence suggests that the primary barrier to elimination is not case detection, but rather the failure to interrupt transmission due to profound immunity gaps and localised logistical failures[19].
A critical finding among the suspected measles cases is the concentration of 41.6% of laboratory-confirmed cases in children aged 1–5 years, which is consistent with a finding in a study in Israel in 2011[20]. This demographic profile is symptomatic of an accumulated pool of susceptible individuals, common in settings where measles-containing vaccine (MCV) coverage remains below the 95% herd immunity threshold[21]. The spike in incidence in 2015 (32.80 per million) and the subsequent waves up to 2021 highlight a precarious state of endemicity. These trends mirror global observations where the COVID-19 pandemic exacerbated existing immunity and surveillance gaps, leading to a resurgence of measles in previously stabilised regions [22].
The study provides a powerful evidentiary link between vaccine dose accumulation and disease prevention. The observed 88.8% reduction in odds of infection for individuals receiving ≥ 2 doses, compared to the unvaccinated, confirms the high efficacy of the Gambian EPI schedule when fully implemented [23]. However, the high proportion of “zero-dose” and under-vaccinated children among confirmed cases remains the most significant driver of transmission. The disproportionate burden in Western Regions 1 and 2 (61% of outbreaks) likely reflects the challenges of high population density and urban migration, where traditional immunisation outreach services may struggle to keep pace with rapid urbanisation[24].
A significant strength of the Gambian IDSR framework is its sensitivity. Achieving the NMFRI target of ≥ 2 per 100,000 in most years indicates a system capable of detecting febrile rash illnesses even in the absence of outbreaks . Furthermore, the high timeliness of notification (89%) and investigation (97%) suggests a rapid initial public health response, which is consistent with a study conducted in the Eastern Mediterranean[25].
However, this high sensitivity is undermined by a “last-mile” logistical failure. The critically low timeliness of sample transportation in the Upper River Region (46%) represents a major surveillance blind spot. Delays in specimen logistics not only compromise sample integrity for IgM ELISA testing but also delay the activation of supplementary immunisation activities (SIAs), allowing sporadic cases to evolve into full-scale epidemics [25]. This regional disparity mirrors findings in Zambia and other sub-Saharan contexts, where geographic isolation translates to diagnostic inequity [26].
A significant finding is the higher odds of laboratory-confirmed measles cases among suspected cases residing in the Upper River Region. Although the region accounted for a smaller proportion of the total suspected cases compared to the Western Regions, the elevated odds of confirmation, potential surveillance, and programmatic disparities warrant closer attention. A possible explanation could relate to the logistical challenge in specimen transportation from URR, the geographically remotest region in The Gambia. Surveillance analysis revealed that less 50% of the samples from URR were transported to the national laboratory within the WHO-recommended 5 days. Delays in measles sample transportation may affect the timeliness of laboratory confirmation and outbreak response, potentially allowing localised transmission chains to persist before response measures are implemented[27].
Furthermore measles-specific IgM antibodies typically become detectable approximately 3-4 days after rash onset and remain detectable for several weeks[28]. Specimens collected very early in the course of the illness may therefore yield false-negative results if the IgM antibodies have not yet reached detectable levels. As this study relied on routine surveillance data, the exact timing between rash onset and specimen collection could not always be verified. Consequently, some true measles infections may have been misclassified as IgM-negative, which may lead to diagnostic misclassification[29].
The observed case fatality rate (CFR)of 0.40% appears lower than the CFR estimates reported in several sub-Saharan African settings. However, these estimates should be interpreted with caution because it is based on a very small number of deaths, resulting in wide confidence intervals and limited statistical stability[30].
Limitations
This analysis is constrained by its retrospective design and reliance on routine surveillance data, which may introduce selection bias as only suspected cases reported through the surveillance network were included. As a result, cases that did not seek medical care or had mild symptoms may have been missed, which likely underestimates the burden of measles. The prevalence of “unknown” vaccination status (15.4%) introduces potential misclassification bias and limits our ability to precisely quantify the population at risk. Additionally, the study did not explore the impact of nutritional status (e.g., Vitamin A deficiency), which is a known modulator of measles severity.
This study didn’t analyse patterns of measles occurrence, including comparisons between outbreak and non-outbreak years, and the application of other trend analysis methods, such as joint point regression, to provide deeper insights into the epidemiology of measles over time, and recommends this for future studies. Despite these limitations, the study provides valuable insights into measles epidemiology and vaccination impact in The Gambia.
The Gambia possesses a highly sensitive surveillance framework capable of detecting measles transmission. However, the goal of elimination remains elusive due to a convergence of suboptimal vaccination coverage and logistical bottlenecks in specimen logistics. To transition from outbreak control to elimination, the national program must address the diagnostic inequities in remote regions like the URR and mitigate the urban transmission clusters in the Western Regions. Therefore, we recommended that the Ministry of Health, through the Expanded Program on Immunisation, should implement leverage on the national sample referral network across the country especially in URR to increase transportation timeliness from 46% to the $>80\%$ benchmark, deploy mobile vaccination teams to high-density urban markets and transit hubs in WR1 and WR2 to reach children missed by stationary clinics, ensures that surveillance officers are retrain on the “Investigation and Data Completeness” module to minimize the 15% rate of unknown vaccination status, and establish a real-time DHIS2 dashboard to track NMFRI rates and transportation timelines, enabling immediate administrative intervention when regions fall below targets.
What is already known about the topic
What this study adds
AJ: conceptualization, data curation, formal analysis, funding acquisition, investigation, methodology, project administration, resources, software, supervision, validation, visualization, writing original draft, review and editing. BK: data curation and formal analysis. AB: resources. OJB: conceptualization, data curation, formal analysis, methodology, project administration, supervision, validation, visualization, writing, review and editing.
| Characteristics | Measles IgM results | Total (%) | |
|---|---|---|---|
| Negative (%) | Positive (%) | ||
| Sex | |||
| Female | 437 (79.0) | 116 (21.0) | 553 (43.7) |
| Male | 591 (82.9) | 122 (17.1) | 713 (56.3) |
| Age Group | |||
| <1 yr | 265 (82.8) | 55 (17.2) | 320 (25.3) |
| 1–5 yrs | 334 (77.1) | 99 (22.9) | 433 (34.2) |
| 6–10 yrs | 272 (82.9) | 56 (17.0) | 328 (25.9) |
| 11–15 yrs | 101 (84.2) | 19 (15.8) | 120 (9.5) |
| >15 yrs | 56 (86.2) | 9 (13.9) | 65 (5.1) |
| Vaccination status | |||
| Unvaccinated | 185 (68.8) | 84 (31.2) | 269 (21.3) |
| 1 dose | 454 (86.2) | 73 (13.9) | 527 (41.6) |
| >=2 doses | 260 (94.5) | 15 (5.5) | 275 (21.7) |
| Unknown | 129 (66.2) | 66 (33.9) | 195 (15.4) |
| Region | |||
| CRR | 155 (91.2) | 15 (8.8) | 170 (13.4) |
| LRR | 113 (95.0) | 6 (5.0) | 119 (9.4) |
| NBE | 161 (89.0) | 20 (11.1) | 181 (14.3) |
| NBW | 38 (97.4) | 1 (2.6) | 39 (3.1) |
| URR | 148 (84.6) | 27 (15.4) | 175 (13.8) |
| WR1 | 268 (69.6) | 117 (30.4) | 385 (30.4) |
| WR2 | 145 (73.6) | 52 (26.4) | 197 (15.6) |
| Residence | |||
| Rural | 667 (89.3) | 80 (10.7) | 747 (59.0) |
| Urban | 361 (69.6) | 158 (30.4) | 519 (41.0) |
| Outcome | |||
| Alive | 1025 (81.2) | 237 (18.8) | 1262 (99.7) |
| Dead | 3 (75.0) | 1 (25.0) | 4 (0.3) |
| Year | CRR | LRR | NBE | NBW | URR | WR1 | WR2 | National |
|---|---|---|---|---|---|---|---|---|
| 2014 | 4.4 | 6.1 | 8.9 | 1.8 | 4.5 | 4.40 | 6.0 | 5.2 |
| 2015 | 9.5 | 16.9 | 12.2 | 0.0 | 0.0 | 2.5 | 8.2 | 7.0 |
| 2016 | 0.9 | 4.8 | 0.9 | 0.9 | 0.8 | 1.20 | 1.7 | 1.6 |
| 2017 | 3.7 | 9.4 | 7.5 | 2.5 | 0.4 | 2.5 | 2.1 | 4.0 |
| 2018 | 4.1 | 19.8 | 2.4 | 6.6 | 3.3 | 0.9 | 1.1 | 5.5 |
| 2019 | 4.0 | 2.3 | 4.0 | 4.0 | 2.9 | 0.7 | 1.9 | 2.8 |
| 2020 | 1.2 | 5.7 | 0.8 | 0.0 | 1.4 | 3.0 | 1.9 | 2.0 |
| 2021 | 0.0 | 7.9 | 0.0 | 0.0 | 0.7 | 0.4 | 0.6 | 1.4 |
| 2022 | 2.6 | 20.0 | 7.5 | 3.9 | 3.7 | 7.5 | 4.0 | 7.0 |
| 2023 | 12.4 | 6.6 | 73.6 | 4.6 | 6.2 | 3.7 | 1.8 | 15.5 |
| 2024 | 18.2 | 31.4 | 6.5 | 6.0 | 26.7 | 2.8 | 2.6 | 13.5 |
| Characteristics | Crude OR (95% CI) | P-value | Adjusted OR (95% CI) | P-value |
|---|---|---|---|---|
| Sex | ||||
| Male | 1 | 1 | ||
| Female | 1.29 (0.97 – 1.71) | 0.08 | 1.21 (0.89 – 1.65) | 0.219 |
| Age Group | ||||
| <1 yr | 1.29 (0.60 – 2.76) | 0.51 | 1.47 (0.66 – 3.31) | 0.35 |
| 1–5 yrs | 1.84 (0.88 – 3.86) | 0.14 | 2.87 (1.30 – 6.32) | 0.01 |
| 6–10 yrs | 1.28 (0.60 – 2.74) | 0.52 | 1.63 (0.73 – 3.60) | 0.32 |
| 11–15 yrs | 1.17 (0.50 – 2.76) | 0.72 | 1.50 (0.61 – 3.70) | 0.38 |
| >15 yrs | 1 | 1 | ||
| Vaccination Status | ||||
| Unvaccinated | 1 | 1 | ||
| 1 dose | 0.354 (0.248 – 0.506) | <0.001 | 0.32 (0.216 – 0.47) | <0.001 |
| 2 doses | 0.13 (0.071 – 0.227) | <0.001 | 0.11 (0.060 – 0.21) | <0.001 |
| Unknown | 1.13 (0.760 – 1.669) | 0.55 | 1.01 (0.65 – 1.57) | 0.97 |
| Region | ||||
| CRR | 1 | 1 | ||
| LRR | 0.55 (0.21 – 1.46) | 0.23 | 0.64 (0.24 – 1.74) | 0.38 |
| NBE | 1.28 (0.63 – 2.60) | 0.49 | 1.18 (0.57 – 2.45) | 0.67 |
| NBW | 0.27 (0.035 – 2.12) | 0.21 | 0.35 (0.04 – 2.78) | 0.32 |
| URR | 1.89 (0.964 – 3.69) | 0.06 | 2.17 (1.08 – 4.36) | 0.03 |
| WR1 | 4.51 (2.54 – 8.00) | 0.00 | 2.36 (1.12 – 4.96) | 0.02 |
| WR2 | 3.71 (2.00 – 6.87) | <0.001 | 2.24 (1.13 – 4.77) | 0.03 |
| Residence | ||||
| Rural | 1 | 1 | ||
| Urban | 3.65 (2.709 – 4.92) | <0.001 | 1.76 (1.05 – 2.94) | 0.03 |
| Mean VIF = 1.84 | ||||