Research | Open Access | Volume 9 (2): Article 92 | Published: 03 Jun 2026

Views: 1,957
Menu, Tables and Figures
| Group | CIAF Categories | Description of the Level | Wasting | Stunting | Underweight | |
|---|---|---|---|---|---|---|
| A | No failure | Normal WAZ, HAZ and WHZ | No | No | No | |
Anthropometric failure | B | Wasting only | WAZ < -2SD, but normal HAZ and WHZ | Yes | No | No |
| C | Wasting and underweight | WAZ and WHZ < -2 SD, but HAZ normal | Yes | No | Yes | |
| D | Wasting, underweight and stunting | WAZ, WHZ and HAZ < -2SD | Yes | Yes | Yes | |
| E | Stunting and underweight | HAZ and WHZ < -2SD, but WAZ normal | No | Yes | Yes | |
| F | Stunting only | HAZ < -2SD, but normal WAZ and WHZ | No | Yes | No | |
| Y | Underweight only | WHZ < -2SD, but normal HAZ and WA | No | No | Yes | |
| Source: The Concept of the CIAF by Kuiti and Bose: Revisited and Revised (2018) | ||||||
Table 1: Composite Index of Anthropometric Failure (CIAF) Categories
| Variable | Frequency (n=611) | Percentage |
|---|---|---|
| Age | ||
| 0 – 23 Months | 568 | 93.0 |
| 24 – 59 Months | 43 | 7.0 |
| Sex | ||
| Male | 300 | 49.1 |
| Female | 311 | 50.9 |
| Form of Undernutrition – WHO Criteria | ||
| Underweight | ||
| Yes | 105 | 17.2 |
| No | 506 | 82.8 |
| Stunting | ||
| Yes | 113 | 18.5 |
| No | 498 | 81.5 |
| Wasting | ||
| Yes | 105 | 17.2 |
| No | 506 | 82.8 |
| Form of Undernutrition – CIAF Criteria (n=609) | ||
| No anthropometric failure | 399 | 65.5 |
| Total anthropometric failure | 210 | 34.5 |
*One dataset had variables missing among the 612 participants who responded but was dropped.
**A couple of variables were excluded when analyzing the CIAF parameters as the ENA for SMART software flagged them
Table 2: Demographics Characteristics and Prevalence of Undernutrition Among the Participants (N = 611*)
| Parameter | Number, #N | Underweight, *n (%) | Stunted, n (%) | Wasting, n (%) |
|---|---|---|---|---|
| Age (month) | ||||
| 0 – 23 | 568 | 91 (16.0) | 94 (16.5) | 100 (17.6) |
| 24 – 59 | 43 | 14 (32.6) | 19 (44.2) | 5 (11.6) |
| Sex | ||||
| Male | 300 | 61 (20.3) | 65 (21.7) | 70 (23.3) |
| Female | 311 | 44 (14.1) | 48 (15.4) | 35 (11.3) |
| Category of Malnutrition | ||||
| Severe | 611 | 42 (6.9) | 60 (9.8) | 40 (6.5) |
| Moderate | 611 | 63 (10.3) | 53 (8.7) | 65 (10.6) |
| Normal | 611 | 506 (82.8) | 498 (81.5) | 506 (82.8) |
#N represents the total number or denominator from which the proportion is being determined
*n represents the total number of participants in the subgroup who are undernourished
Table 3: Nutritional status of the participants by age and sex
| CIAF Category | Age Group (Month) | Sex | ||
|---|---|---|---|---|
| 0 – 23 | 24 – 59 | Male | Female | |
| n, % | n, % | n, % | n, % | |
| No failure (A) | 379 (67.0) | 20 (46.5) | 172 (57.7) | 227 (73.0) |
| Wasting only (B) | 57 (10.1) | 0 (0.0) | 36 (12.1) | 21 (6.8) |
| Wasting and underweight (C) | 29 (5.1) | 3 (7.0) | 22 (7.4) | 10 (3.2) |
| Wasting, underweight and stunting (D) | 12 (2.1) | 2 (4.7) | 10 (3.4) | 4 (1.3) |
| Stunting and underweight (E) | 43 (7.6) | 8 (18.6) | 26 (8.7) | 25 (8.0) |
| Stunting only (F) | 39 (6.9) | 9 (20.9) | 29 (9.7) | 19 (6.7) |
| Underweight only (Y) | 7 (1.2) | 1 (2.3) | 3 (1.0) | 5 (1.6) |
| Anthropometric Failure (B+C+D+E+F+Y) | 187 (33.0) | 23 (53.5) | 126 (42.3) | 84 (27.0) |
Table 4: Nutritional status based on the CIAF by age and sex categories

Seidu Salifu1,&, Samuel Dapaa2, Joshua Billy1, Gyesi Razak Issahaku3, Marion Okoh-Owusu1
1Regional Health Directorate, Ghana Health Service, Western North Region, Bodi, Ghana, 2Ghana Field Epidemiology and Laboratory Training Program (GFELTP), Ghana, 3Laboratory Department, Tamale Teaching Hospital, Tamale, Ghana
&Corresponding author: Seidu Salifu, Regional Health Directorate, Ghana Health Service, Western North Region, Bodi, Ghana, Email: seidusalifu@yahoo.com ORCID: https://orcid.org/0009-0006-0886-3523
Received: 18 Dec 2024, Accepted: 02 Jun 2026, Published: 03 Jun 2026
Domain: Maternal and Child Health
Keywords: Nutritional status, stunting, Z-score, malnutrition, CIAF, health facility
©Seidu Salifu et al. Journal of Interventional Epidemiology and Public Health (ISSN: 2664-2824). This is an Open Access article distributed under the terms of the Creative Commons Attribution International 4.0 License (https://creativecommons.org/licenses/by/4.0/), which permits unrestricted use, distribution, and reproduction in any medium, provided the original work is properly cited.
Cite this article: Seidu Salifu et al., Nutritional status of children under five years of age in the Western North Region, Ghana, 2023. Journal of Interventional Epidemiology and Public Health. 2026; 9(2):92. https://doi.org/10.37432/jieph-d-24-02053
Introduction: Undernutrition is a common public health concern among children under five years. In Ghana, undernutrition is prevalent across various regions. Knowledge of the prevalence of malnutrition is a prerequisite for planning interventions and management. This study assessed the nutritional status and prevalence of undernutrition among children under five years old in the Western North Region of Ghana.
Methods: The study used a cross-sectional design, adopting the WHO Z-scores and the Composite Index of Anthropometric Failure (CIAF) approaches. We assessed the anthropometric indices of children who visited randomly selected health facilities for child health and nutrition services from May to July 2022. Demographic data of the children were recorded from the child health record book during the assessment, and the Z-scores were estimated using the Emergency Nutrition Assessment Software (ENA for SMART). Z-scores were analysed into frequency and percentage using SPSS Version 23. Anthropometric failure was determined using the CIAF seven-point criteria.
Results: Of 612 children recruited, 50.8% (311/612) were males. The median age of the participants was 9 (Interquartile range: 6 – 14) months. The prevalence of stunting was 18.5% (113/611), with 53.1% (60/113) of those stunted being severely stunted. Both underweight and wasting had the same prevalence rate of 17.2% (105/611). Of the participants assessed using CIAF, about 34.5% (210/609) had total anthropometric failure, with 2.3% (14/609) failing in all the 3 conventional anthropometric indices of underweight, wasting, and stunting.
Conclusion: There was a high prevalence of undernutrition and total anthropometric failure among the participants. This should be taken into consideration in child health and nutrition programming
Adequate nutrition is a key determinant of optimal growth, especially among children under the age of five years. Adequate nutrition is a requirement for the physical and mental growth of an individual from conception to adulthood. A deficiency in any of the acceptable nutrients required at each stage of the life of an individual often leads to malnutrition [1].
Malnutrition affects many different populations across the globe. The World Health Organization (WHO) estimates that about 149 million children under five years are stunted and 45 million are wasted. In addition, undernutrition is linked to about 45% of global deaths among children under five years [2]. Countries in the developing world, including Sub-Saharan Africa and Asia, have been identified as endemic undernutrition spots with very high prevalence [3,4]. Undernutrition is the most common form of malnutrition. Undernutrition, such as stunting and wasting, which are usually caused by energy and protein deficiencies, is very common in developing countries such as Ghana.
The Ghana Demographic and Health Survey (GDHS) report in 2022 recorded different forms of undernutrition among children under five in all 16 regions of Ghana. According to the report, about 17.5% of children under five in Ghana were stunted, and 12.3% were underweight [5]. In the Western North Region (WNR), the prevalence of stunting was found to be 10.6%, with about 2% of the children being severely stunted. In addition, the prevalence of underweight in the WNR was found to be 7.5% according to the report [6].
To deal with the undernutrition menace, the WHO and its partners over the years have advocated for the implementation of proven health and nutrition recommendations for children. These recommendations include the WHO infant and young child feeding guidelines for health service providers and caregivers of all children, and the advocacy for a supportive environment for infant and young child feeding counselling at all levels [7]. The Ghana Health Service and its partners continuously work to implement the WHO recommendations for infant and young child feeding to reduce malnutrition [8].
The WHO has, over the years, provided an approach for the assessment of the nutritional status of individuals. This method is used to assess the prevalence of various nutrition indicators in children, monitor population situations and assess progress made in the implementation of interventions. The conventional approach to nutritional status assessment commonly involves the use of Z-scores [9]. In recent years, other new methods of nutritional status assessment have emerged through research. One such method that is gaining popularity among researchers is the Composite Index of Anthropometric Failure (CIAF) [10,11].
In Ghana, some research works have delved into issues of undernutrition among children under five years, but these researchers have focused on the northern part of the country [12,13]. The objective of this study was to assess the nutritional status and prevalence of undernutrition among children under five years old in the Western North Region of Ghana.
Study design and setting
The study used a descriptive cross-sectional design to assess the nutritional status of children under five years in the Western North Region of Ghana from May to July 2022. This study was conducted in the Western North Region of Ghana. The WNR is typically noted for farming as well as corporate and local mining activities. It is also predominantly a rural setting with only a couple of peri-urban districts [14].
The study participants were recruited at the points where health services are delivered to the children within public health facilities in the region. There are over 280 government-owned health facilities in the region made up of hospitals, health centres, maternity homes and Community-based Health Planning and Service (CHPS) compounds. The facilities are distributed across the various districts and sub-districts in the region. These public health facilities are managed by staff of the Ghana Health Service (GHS) who provide health and nutrition services to the people of the region. There are also health facilities owned by other agencies in the region, but only a few of them render child health and nutrition services [15].
Researchers therefore focused on some selected public health facilities to conduct the study. The team focused on public health facilities because most of the private health facilities do not render child health and nutrition services. According to data from the Ghana Statistical Service, in 2022, the estimated population of the WNR was about 900,000, with children under five years constituting about 20% (180,000) [5].
Study population
The study population consisted of children less than five years old who visited the study sites from May 2022 to July 2022, when the data were being collected. The study facilities provided growth promotion services for children at Child Welfare Clinic (CWC) sessions as specified in the protocols of the Reproductive, Maternal, Newborn, Child, Adolescent Health and Nutrition (RMNCH & N) Programme under the management of the Family Health Division of the GHS [16]. The assessments of eligible participants were carried out during these sessions.
Inclusion and exclusion criteria
The study included only public health facilities that render child health and nutrition services. Also, the study excluded all children who had been diagnosed with any congenital abnormality or disease, such as congenital heart disease.
Samples size determination
The sample size for the study was calculated by adopting Cochran’s formula for proportions. This formula is stated as n ≥ (z2p(1- p)) / e2 [17]. Where n is the minimum sample size for a large population, z is the selected critical value of the desired confidence level, p is the estimated proportion of the phenomenon of interest, and e is the desired level of precision.
A 16.74% prevalence of stunting according to a study done by [18] in the WNR at 95% confidence level (z = 1.96) and ±3% precision (e = 0.03), was used to calculate the sample size of 594. This sample size was adjusted upwards by 3% (18) to cater for non-responses. The minimum sample size for the survey was therefore 612.
Sample selection
One health facility in each of the nine districts of the WNR was randomly selected through the lottery method to select the study site for data collection. The health facility selection was made from the list of public health facilities in each district. With a sample size of 612, each study facility in each district was assigned a proportionate sample size according to the estimated population of the district. A simple random sampling through the lottery method was employed to select eligible children to be involved in the study using the serial numbers of the participants in the Child Health Register of the sampled health facility.
The names of the selected children and their parents’ addresses were then written on a tracking sheet to identify them for the assessment as and when they visited the facility for services within the period of May to July 2022, during which the data were collected for the study. A follow-up was undertaken to get caregivers of all sampled children to visit the sampled facilities during the study period for the assessment of their children.
Data collection and measurements
We interviewed caregivers using a semi-structured questionnaire to collect data on the demographics of the children involved in the study. Anthropometric assessments were carried out using the WHO guidelines for assessing children under five years [9]. The variables measured were weight and height, or the recumbent length. The weight of each participant was measured using an electronic weighing scale (Model: SECA 268) with an accuracy of 0.10 kg. The recumbent length or height of each participant was measured to the nearest 0.1cm using an infantometer or stadiometer. Before the measurements were undertaken, the date of birth of each participating child was recorded from the child health records book of the participant.
Quality assurance
Data collectors were trained to ensure they adhered to the standard protocols in using the measuring equipment and to avoid observer errors during the assessments. Also, at the beginning of each assessment, the weighing scale was calibrated using a standard weight to ensure accurate readings. In addition, height or length was measured twice, and the average was taken.
Operational definitions and concepts
WHO z-scores
The conventional indicators used in nutritional status assessment for children are the WHO Z-scores, including the weight-for-age (WAZ), length/height-for-age (HAZ) and weight-for-length/height (WHZ). These indicators were computed, and the nutritional status defined as severe malnutrition (< −3 (standard deviation) SD); moderate malnutrition (− 3SD to < −2SD); and normal nutritional status (− 2SD to + 2SD) [9]. In this study, the definition of normal Z-score was modified to include all those whose Z-score values exceeded the + 2SD. This was necessary because, for several years of surveys, there have not been any significant findings on the prevalence of overweight / obesity among children in the region [6]. The three indicators are defined using the appropriate Z-score values as underweight (WAZ), stunting (HAZ) and wasting (WHZ).
Composite index of anthropometric failure
The Composite Index of Anthropometric Failure (CIAF) concept was introduced by Peter Svedberg for detecting totally malnourished children [10] and was employed for further analysis of the undernutrition prevalence. CIAF is an anthropometric index that merges the three indices of WAZ, HAZ and WHZ to establish the nutritional status of children less than five years old. The CIAF has seven categories labelled with the letters A, B, C, D, E, F and Y (Table 1). With the CIAF concept, undernutrition was categorised into anthropometric failure, where at least one of the three conventional Z-score values was < -2SD and no failure, where none of the three indicators had a value below the normal level, as in the WHO’s definition.
Data analysis
The Emergency Nutrition Assessment for Standardized Monitoring and Assessment of Relief and Transitions (ENA for SMART) software [9] was used to analyze the anthropometric data of the study participants to obtain the WHO Z-score values. The Z-score values were then exported to the Statistical Package for Social Sciences (SPSS) version 23 (IBM Corp., USA) for further analysis. The Z-score values of the participants were also categorized and summarized into frequencies and percentages. The raw age results of the participants were categorized into two: children from 0 – 23 months and children 24 – 59 months. These two age categories, in addition to sex, were then summarized as frequencies and percentages.
The prevalence of the various forms of undernutrition was also grouped to determine the non-exclusive CIAF categories. A Chi-square test was performed to determine the association between the demographic characteristics and underweight categories among the study participants. Missing data variables were excluded from the analysis of each indicator. The missing values were those flagged by the ENA for SMART Software, which were not exported to SPSS for the final analysis.
Ethical considerations
This study was granted an ethical approval waiver by the Western North Regional Director of Health Services with permission from the Director General of the GHS. This was captured in a letter with reference number GHS/WNR/RDHS/051-2022 and dated 14th April 2022. The waiver was given in line with the mandate of the Family Health Divisions of the GHS, in which regional and district teams have been directed to conduct research as part of routine nutrition surveillance activities as stated in the National Nutrition Policy of the GHS [16]. Permission was obtained from the other sub-structures of the GHS at the level of data collection. We dropped data elements that could identify the participants, such as the name, and kept the data collected and analysed in a folder with password protection. The consent of the caregivers of the eligible children was sought using a consent form before the measurements were carried out.
Demographic characteristics and nutritional status of the participants
The study involved a total of 612 children under five years old in the nine districts of the WNR. About 7.0% (43) of the participants were at least two years old (Table 2). The median age was 9 (interquartile range: 6 – 14) months. Also, 49.1% (301) of the participants were males. Using the WHO Z-Scores, the prevalence of stunting, one of the key indicators of undernutrition, was 18.5% (113/611), with about 53.1% (60/113) of the stunted participants being severely stunted (Tables 2 and 3).
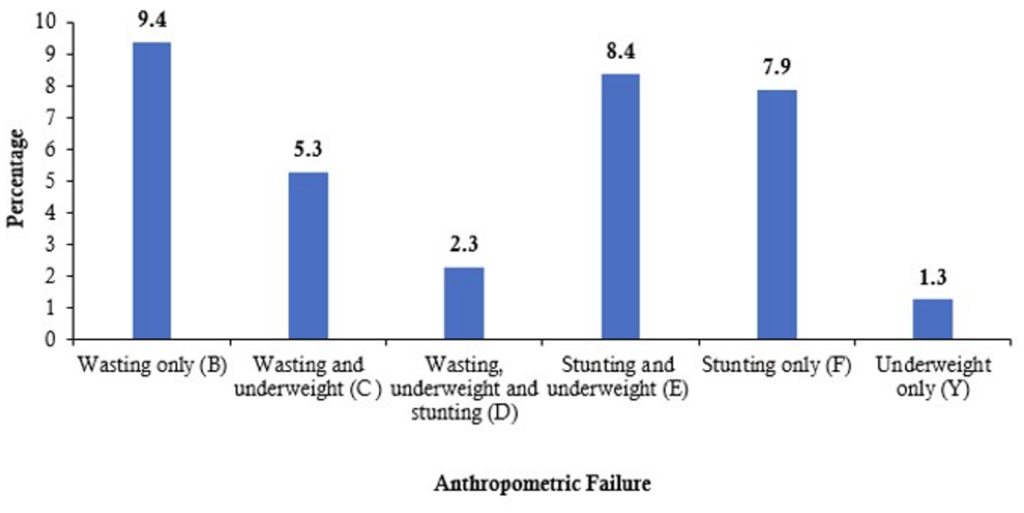
Nutritional status assessment using the CIAF indicators showed that 34.5% (210/609) of the study participants had total anthropometric failure (Table 2). Among the exclusive categories of wasting only (A), stunting only (F) and underweight only (Y), category Y recorded the least of 1.3% (Figure 1).
Nutritional status of the participants by age and sex
About 17.6% (100/568) and 16.0% (91/568) of the study participants aged 0 – 23 months were found to be wasted and underweight, respectively (WAZ < – 3SD). These prevalence levels matter because 9 out of 10 participants studied belonged to this age group. For the sex categories, the prevalence of wasting was 23.3% (70/300), and that of underweight was 20.3% (61/300) among males. Prevalence levels among males were very high when compared with those for females (Table 3).
Nutritional status based on the CIAF by age and sex categories
The distribution of the prevalence of the anthropometric failures among the age categories adopted in this study showed that about 33.0% (187/566) of the participants within the age category group of 0 – 23 months had total anthropometric failure. Also, 73.0% (227/311) of females had no anthropometric failures. Males CIAF exclusive category of wasting recorded the highest prevalence of 12.0% (Table 4).
Association between age and sex of the participants and undernutrition
Out of the 568 study participants who were less than 24 months old, 91 (14.9%) were underweight, whereas out of a total of 43 participants aged 24 months and above, 14 (2.3%) were underweight. The difference between the two groups was statistically significant (p = 0.010). There was also a statistically significant difference between the 94 (15.4%) children less than two years who were stunted and the 19 (3.1%) children two years and above who were stunted. In addition, stunting and wasting prevalence differences among males and females were significant with p-values of 0.049 and < 0.001 respectively.
This study found nearly a fifth (18.5%) of the study participants to be stunted. The prevalence of the various forms of undernutrition was much higher when compared to the Ghana Demographic and Health Survey (GDHS) 2022 data which found 10.6% and 7.5% stunting and underweight prevalence respectively in the WNR [6]. Although the prevalence of the various forms of undernutrition among the study population in this current study was higher the prevalence of stunting was similar to the overall national stunting prevalence in Ghana [6]. The prevalence of stunting was also similar to a prevalence of 16.7% found in a study by [18] in the WNR. Similar environmental factors might have contributed to the similarity in the results especially with that of [18]. The wide variations in the prevalence rates between this study and that of the recent GDHS findings could be since the two sets of data were collected in different seasons of the year. Unlike the GDHS data, the data used in this study was collected during the lean season of the year when various households had food insecurity issues [14].
Stunting is the most serious form of undernutrition among the three major categories due to its irreversible intergenerational consequences [7]. Among the two age categories of participants, stunting was more prevalent in children 0 – 23 months compared to those 24 months and above. The age of the participants was found to be associated with stunting. In a similar study by [1], age was also found to be associated with stunting. Among both sexes involved in the study, the prevalence of stunting was higher among males compared to females. Other studies including that of [1,6,19] also found stunting rates being higher among males when compared to females.
The prevalence of wasting found in this study is similar to the that found (17.8%) in an assessment of the nutritional status of children under five years in an urban area of India in South Delhi by [3]. In Ethiopia, [20] also found a very similar (17.7%) prevalence of wasting among children under five years. The studies in South Delhi and Ethiopia however, found a wider variation of underweight prevalence of 24.5% and 24.0% respectively among the participants compared to the prevalence of underweight found by this study. Different geographic settings might have contributed to these differences. The high prevalence of wasting indicates that the study population has been exposed to chronic undernutrition for a long period.
On the severity of the undernutrition among the participants, severe stunting and severe wasting were 9.8% and 6.5% respectively in this study compared to 4.2% and 1.2% respectively in the 2022 GDHS report [6]. Variations in the seasonal calendar of events such as food availability might be the contributory factors to these differences.
An application of the CIAF criteria to evaluate the nutritional status of the participants showed that over a third (34.5%) of the participants had total anthropometric failure. This finding is similar to a finding by [21] who found an anthropometric failure of 36.1% among Indian children. The total anthropometric failure found in this study was however lower when compared with the findings (42.1%) of a study of Indonesian children [22] and the findings (45.0%) of [3] among urban children in South Delhi in India. Another research finding using the CIAF method in Tanzia showed as high as nearly 6 in 10 participants had anthropometric failure [23]. In all these instances different sets of risk factors may have contributed to the observed difference in the findings of these studies and that of this current study.
In this study, the prevalence of undernutrition according to the CIAF method (34.5%) is higher than the prevalence of undernutrition according to the WAZ, HAZ and WHZ criteria. Studies have shown that in general, prevalence of undernutrition when the CIAF is applied is higher than the single prevalence in the conventional classification of undernutrition [23,24]. The CIAF criteria contains a composite indicator that represents the nutritional status of a given population. Its introduction has facilitated the interpretation of the overall nutritional status of a population. [11]. The CIAF result show the quantum of children who are battling with multiple forms of undernutrition.
The prevalence of the non-exclusive CIAF categories including wasting and underweight (5.3%); and stunting and underweight (8.4%) in this study were also similar to the findings of [3] which were 6.5% and 10.7% for the two CIAF groups respectively. According to a study by [25], a 10.48% prevalence was found for the CIAF non-exclusive category of stunting and wasting.
Furthermore, the research revealed that within the two age categories, over half (53.5%) of the children aged 24 to 59 months encountered anthropometric failure. Additionally, a greater percentage of males (42.0%) experienced anthropometric failure in comparison to females. This trend aligns with findings from a separate study conducted among rural Indonesian children [22], suggesting that these disparities may be attributed to varying geographical contexts.
The study employed a cross-sectional study design and does not therefore depict any causal link. The results are just a snapshot of the prevailing situation and should therefore be interpreted using descriptives only. The data was collected at the health facility level and only a few of the children above three years were captured because of low attendance of older children at the CWC sessions. This made it challenging to sub-categorize age for intrinsic analysis. Additionally, the study did not delve into social factors such as parents’ educational status and household size, as well as occupational and environmental factors, such as type of housing, that also predispose children to malnutrition. Nonetheless, like any descriptive study, this study has documented the prevalence of undernutrition indicators among participants using Z-scores and the CIAF criteria.
The study used an assessment that described all types of undernutrition among the participants. The findings of this study indicate that the prevalence of the various forms of undernutrition was substantially high in the study area when the WHO Z-scores and the CIAF methods were used. The findings have reinforced the rationale for regular growth promotion and child health services. Periodic assessment of nutritional status has the potential to prompt early decision-making on population-level child health and nutrition programs. We will like to recommend that the Ministry of Health, Ghana, should consider incorporating the total anthropometric failure indicators into the Ghana Health Service routine nutrition indicators framework which are uploaded unto the District Health Information System (DHIMS) database. This will help facilitate early detection of children with multiple failures of anthropometry for prompt action.
What is already known about the topic
What this study adds
SS: Preparation for data collection, literature search, study design, manuscript writing, data analysis
SD: data collection, data analysis, presentation, manuscript writing
BJ: data collection, literature search, statistical analysis
RG: manuscript data analysis, manuscript review, data interpretation
MOW: schedule preparation, manuscript review and supervision
| Group | CIAF Categories | Description of the Level | Wasting | Stunting | Underweight | |
|---|---|---|---|---|---|---|
| A | No failure | Normal WAZ, HAZ and WHZ | No | No | No | |
|
Anthropometric failure |
B | Wasting only | WAZ < -2SD, but normal HAZ and WHZ | Yes | No | No |
| C | Wasting and underweight | WAZ and WHZ < -2 SD, but HAZ normal | Yes | No | Yes | |
| D | Wasting, underweight and stunting | WAZ, WHZ and HAZ < -2SD | Yes | Yes | Yes | |
| E | Stunting and underweight | HAZ and WHZ < -2SD, but WAZ normal | No | Yes | Yes | |
| F | Stunting only | HAZ < -2SD, but normal WAZ and WHZ | No | Yes | No | |
| Y | Underweight only | WHZ < -2SD, but normal HAZ and WA | No | No | Yes | |
| Source: The Concept of the CIAF by Kuiti and Bose: Revisited and Revised (2018) | ||||||
| Variable | Frequency (n=611) | Percentage |
|---|---|---|
| Age | ||
| 0 – 23 Months | 568 | 93.0 |
| 24 – 59 Months | 43 | 7.0 |
| Sex | ||
| Male | 300 | 49.1 |
| Female | 311 | 50.9 |
| Form of Undernutrition – WHO Criteria | ||
| Underweight | ||
| Yes | 105 | 17.2 |
| No | 506 | 82.8 |
| Stunting | ||
| Yes | 113 | 18.5 |
| No | 498 | 81.5 |
| Wasting | ||
| Yes | 105 | 17.2 |
| No | 506 | 82.8 |
| Form of Undernutrition – CIAF Criteria (n=609) | ||
| No anthropometric failure | 399 | 65.5 |
| Total anthropometric failure | 210 | 34.5 |
*One dataset had variables missing among the 612 participants who responded but was dropped.
**A couple of variables were excluded when analyzing the CIAF parameters as the ENA for SMART software flagged them
| Parameter | Number, #N | Underweight, *n (%) | Stunted, n (%) | Wasting, n (%) |
|---|---|---|---|---|
| Age (month) | ||||
| 0 – 23 | 568 | 91 (16.0) | 94 (16.5) | 100 (17.6) |
| 24 – 59 | 43 | 14 (32.6) | 19 (44.2) | 5 (11.6) |
| Sex | ||||
| Male | 300 | 61 (20.3) | 65 (21.7) | 70 (23.3) |
| Female | 311 | 44 (14.1) | 48 (15.4) | 35 (11.3) |
| Category of Malnutrition | ||||
| Severe | 611 | 42 (6.9) | 60 (9.8) | 40 (6.5) |
| Moderate | 611 | 63 (10.3) | 53 (8.7) | 65 (10.6) |
| Normal | 611 | 506 (82.8) | 498 (81.5) | 506 (82.8) |
#N represents the total number or denominator from which the proportion is being determined
*n represents the total number of participants in the subgroup who are undernourished
| CIAF Category | Age Group (Month) | Sex | ||
|---|---|---|---|---|
| 0 – 23 | 24 – 59 | Male | Female | |
| n, % | n, % | n, % | n, % | |
| No failure (A) | 379 (67.0) | 20 (46.5) | 172 (57.7) | 227 (73.0) |
| Wasting only (B) | 57 (10.1) | 0 (0.0) | 36 (12.1) | 21 (6.8) |
| Wasting and underweight (C) | 29 (5.1) | 3 (7.0) | 22 (7.4) | 10 (3.2) |
| Wasting, underweight and stunting (D) | 12 (2.1) | 2 (4.7) | 10 (3.4) | 4 (1.3) |
| Stunting and underweight (E) | 43 (7.6) | 8 (18.6) | 26 (8.7) | 25 (8.0) |
| Stunting only (F) | 39 (6.9) | 9 (20.9) | 29 (9.7) | 19 (6.7) |
| Underweight only (Y) | 7 (1.2) | 1 (2.3) | 3 (1.0) | 5 (1.6) |
| Anthropometric Failure (B+C+D+E+F+Y) | 187 (33.0) | 23 (53.5) | 126 (42.3) | 84 (27.0) |