Research | Open Access | Volume 9 (3): Article 112 | Published: 09 Jul 2026

Views: 1,908
Menu, Tables and Figures
| Table 1: Severe MIP as a proportion of reported MIP cases | |||
|---|---|---|---|
| Year | MIP cases | Severe MIP | Proportion of progression to severe MIP (%) |
| 2020 | 5354 | 538 | 10.05 |
| 2021 | 4990 | 559 | 11.20 |
| 2022 | 5328 | 768 | 14.41 |
| 2023 | 5619 | 935 | 16.64 |
| 2024 | 4915 | 692 | 14.08 |
Table 1: Severe MIP as a proportion of reported MIP cases
Junior Mike Wejuli1,2,&, Apolot Hellen Bridget1, Agenonga Jeff1
1Makerere University School of Public Health, Makerere University, P.O. Box 7072, Kampala, Uganda, 2SWEEM Health Consults Limited, P.O. Box 114574, Kampala, Uganda
&Corresponding author: Junior Mike Wejuli, Makerere University School of Public Health, Makerere University, P.O. Box 7072, Kampala, Uganda, Email: wejulijuniormike656@gmail.com
Received: 23 Feb 2026, Accepted: 04 Jul 2026, Published: 09 Jul 2026
Domain: Infectious Disease Epidemiology
Keywords: malaria in pregnancy, insecticide-treated nets, Intermittent Preventive Treatment
©Junior Mike Wejuli et al. Journal of Interventional Epidemiology and Public Health (ISSN: 2664-2824). This is an Open Access article distributed under the terms of the Creative Commons Attribution International 4.0 License (https://creativecommons.org/licenses/by/4.0/), which permits unrestricted use, distribution, and reproduction in any medium, provided the original work is properly cited.
Cite this article: Junior Mike Wejuli et al. Trends of malaria in pregnancy and uptake of prevention measures in Wakiso District, Uganda, 2020 – 2024. Journal of Interventional Epidemiology and Public Health. 2026; 9(3):112. https://doi.org/10.37432/jieph-d-26-00058
Introduction: Despite the availability of interventions for preventing malaria in pregnancy, it remains a significant public health concern in Uganda. Understanding the trends in malaria in pregnancy and uptake of prevention interventions is critical for addressing gaps towards reducing the burden of malaria in pregnancy. This study analysed malaria in pregnancy trends and uptake of prevention measures in Wakiso District (2020-2024) to inform targeted maternal health interventions.
Methods: This study employed a retrospective analysis of DHIS2 data on malaria in pregnancy (MIP) from January 2020 to December 2024 in Wakiso District, Uganda. All reported MIP cases were included, while incomplete, duplicate, or inconsistent entries were excluded. Key variables included age, location, severe MIP cases and deaths, IPTp doses, and LLIN distribution, measured as percentages relative to the number of ANC 1 attendances. Data were cleaned in Excel, analysed in STATA 14, and spatially mapped using QGIS. Descriptive analysis was performed to understand the trends of malaria in pregnancy (cases and deaths) and the coverage of IPTp and LLINs. Findings were presented as line graphs, bar graphs, and pie charts. The QGIS software package was used to describe the spatial distribution of MIP cases per administrative unit.
Results: MIP cases in Wakiso District fluctuated from 5,354 cases in 2020 to 4,915 in 2024. Severe MIP cases steadily increased, rising sharply from 559 in 2021 to 935 in 2023, which also recorded the highest number of deaths (34 deaths). The uptake of IPTp1 remained the highest across the years but showed a slight decline, while IPTp3 uptake remained low, increasing from 34.7% in 2020 to 43.6% in 2024. LLIN coverage among pregnant women attending ANC1 steadily increased from 29.3% in 2021, while the highest was 54.8% in 2024.
Conclusions: Wakiso District shows a moderate downward trend in MIP over the study period, with a proportion of cases progressing to severe malaria and maternal deaths. Despite this decline, IPTp uptake and LLIN distribution at the facility level remain below the WHO-recommended targets. IPTp uptake (doses 1 and 2) demonstrated a downward trend over the study period, while LLIN distribution showed an upward trend. These results suggest the need for strengthened implementation of MIP prevention interventions at the facility level in Wakiso District.
Malaria remains a global health issue affecting millions of lives worldwide [1]. According to the World Health Organization (WHO), an estimated 263 million cases were reported in 2023, along with 597,000 deaths in 83 countries [2]. The burden is disproportionately higher in Africa, a home to 94% of malaria cases (246 million) and 95% (569,000) of malaria deaths. Majority of the deaths (76%) due to malaria happen among children under five and pregnant women, who account for an estimated 12.4 million cases within the region [2-4].
Malaria is caused by parasites of the genus Plasmodium, transmitted to humans through the bites of infected female Anopheles mosquitoes [2, 5]. Five species of Plasmodium infect humans, with Plasmodium falciparum being the most common and deadly, particularly in Sub-Saharan Africa [6]. The signs and symptoms of malaria typically begin with nonspecific features such as fever, chills, headache, and muscle aches. In pregnancy, malaria can present with fever, anaemia, and other flu-like symptoms, but it may also be asymptomatic. It poses significant risks to both the mother and the unborn child, including miscarriage, stillbirth, low birth weight, premature delivery, and maternal death [7, 8]. For instance, a study found that babies of women with microscopic parasitaemia during pregnancy were 30–50g lighter and more likely to have a low birthweight than babies of women without microscopic parasitaemia [9].
Malaria distribution is largely dependent on a range of environmental, social and health-related factors [10-12]. Environmentally, it is driven by the proximity of mosquito breeding zones such as swamps, vegetation, stagnant water and poorly drained areas [11, 12]. Conditions worsen depending on the seasonality, especially during the rainy season [13-15]. Social factors, including poverty, poor living conditions, and low levels of education, affect the uptake of prevention interventions [16, 17]. The health-related factors include inadequate availability of health services, stockouts of medicines, weak surveillance, among others [18, 19]. Climate change is an increasingly important factor, as it alters rainfall patterns and raises temperatures, thereby extending mosquito breeding seasons and creating favourable conditions for malaria transmission in areas that were previously considered low-risk [20, 21]. Rapid urbanization has contributed to unplanned settlements, inadequate waste management, and poor drainage systems, all of which facilitate the proliferation of mosquito breeding sites [22, 23].
Malaria prevention has been streamlined across different platforms and through different initiatives [24]. This includes the vector prevention approaches such as the use of insecticide-treated nets (LLIN), indoor residual spraying, larval source management and other vector control interventions [25, 26]. The pharmaceutical-based measures include vaccination, intermittent preventive treatment of malaria in pregnant women (IPTp), seasonal malaria chemoprevention for children, and perennial malaria chemoprevention [25, 26]. Additionally, guidelines have been established to reduce the global burden of malaria. These include the global technical strategy for malaria 2016–2030 [27], the Roll Back Malaria Partnership Framework [27], the High Burden to High Impact Initiative [28], among others. Despite all these guidelines, the burden of malaria remains very high, yet there is limited evidence on the association between uptake of these interventions and malaria in pregnancy (MIP) [29].
Therefore, this study assessed trends of MIP and uptake of prevention methods in Wakiso District by analysing the district surveillance data from January 2020 to December 2024. The findings should inform evidence-based decision-making, sharpen the focus of malaria control programs, and align Wakiso’s efforts with national and global goals of malaria elimination and maternal health improvement. This analysis generates actionable insights that can inform maternal health strategies, improve ANC service delivery, and ultimately protect two lives at once (the mother and the baby).
Study design, data source and setting
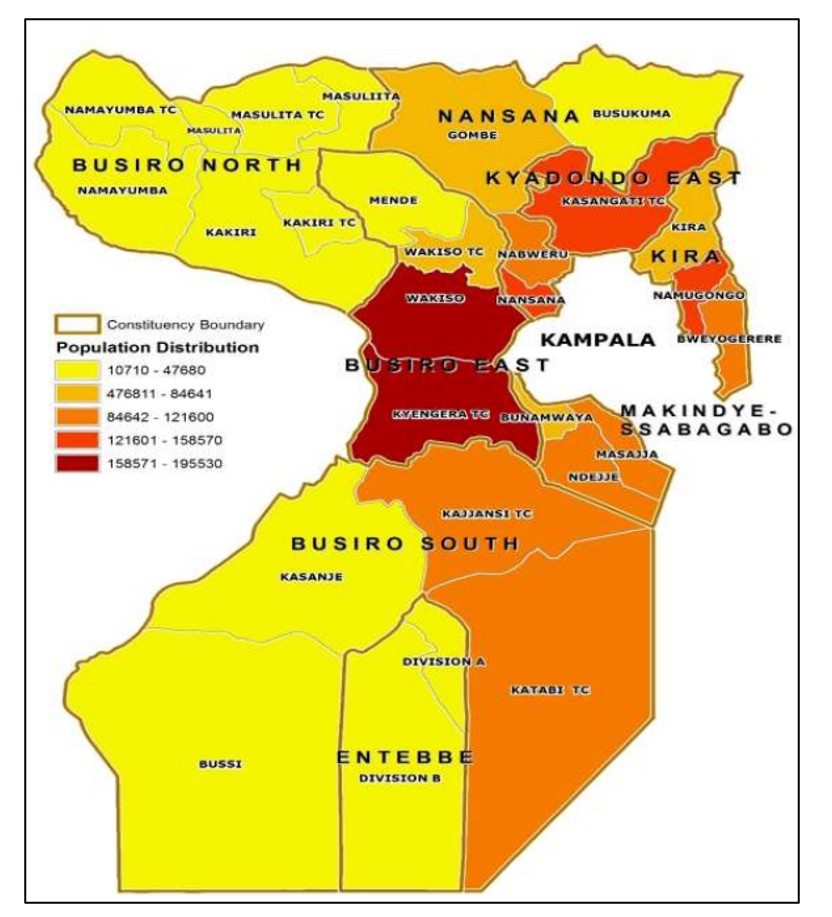
We employed a retrospective analysis of routine secondary data reported through the DHIS2, including all data reported from January 2020 to December 2024 within Wakiso District. Wakiso District is situated in central Uganda and is one of the largest districts in the country(Figure 1). It circles Kampala, one of the fastest-growing cities in east Africa. The district is bordered by Nakaseke and Luweero districts in the north, Kalangala to the south, Mukono to the east and Mityana district to the northwest [30]. Wakiso District has a population of 3,411,177 people, according to the 2024 Uganda National Census report. Of these, 1,828,466 are male, and 1,582,711 are female [31]. The district’s primary economic activities include agriculture, fishing, and other significant sectors such as manufacturing and informal businesses. The district has four municipalities, 9 town councils, six sub-counties, 12 divisions and eight health sub-districts. Wakiso also has a total of 589 Healthcare facilities, of which 234 are clinics, 153 are health centre IIs, 165 are health centre IIIs, 19 are health centre IVs, 15 are hospitals and three specialized clinics [32]. The district comprises urban, periurban, rural and hard-to-reach areas with expanding informal settlements, particularly in areas such as Kira, Nansana, and Kasangati. Wakiso District contains low-lying wetlands, swamps, and lakeshore environments, particularly near Lake Victoria [33]. These natural features contribute to persistent moisture and water stagnation, further promoting mosquito breeding. Additionally, due to frequent rainfall and warm temperatures throughout the year, the district facilitates continuous malaria transmission.
Study population and eligibility criteria
The study population comprised all reported data on MIP (cases and deaths) within the DHIS2 from January 2020 to December 2024. All reported data on MIP within the DHIS2 from January 2020 to December 2024 were included in this study. Those entries which are incomplete, duplicates, or inconsistent were excluded from the study.
Sample size determination and sampling techniques
In this study, we did not determine sample size or follow traditional sampling procedures, as the analysis utilized all the available data obtained from the DHIS2. These were MIP surveillance records reported by health facilities in Wakiso District from January 2020 to December 2024.
Study variables and their measurement
The study focused on variables related to MIP and uptake of prevention interventions. Age group was a categorical variable used to stratify MIP. The age categories included were less than 20 years and greater than 20 years. MIP in each age category was measured by identifying the number of confirmed MIP cases in each age category. The numerator was the number of confirmed MIP cases in each age category. These were confirmed by either RDT or microscopy, while the denominator was the total number of outpatients (ANC) in that category.
The location variable refers to the administrative unit (subcounty) where the MIP data is located. MIP was measured as the number of ANC clients with a confirmed malaria diagnosis during the reporting period. The proportion of IPTp uptake by dose (IPTp1, IPTp2, IPTp3) was assessed as percentages. It was obtained by measuring the number of pregnant women who had received the respective IPTp doses against the number of pregnant women attending ANC 1 during the same period. ANC 1 served as a proxy for the number of women eligible for IPTp, as recommended by the WHO [34]. LLIN distribution at ANC was assessed as a proportion of pregnant women who received LLIN during the first ANC visit. The numerator was the number of ANC clients (pregnant women) who received an LLIN, and the denominator was the total number of first ANC1 clients (pregnant women) during the same period.
Data management and analysis
Data was extracted from DHIS2 with support from the district biostatistician and imported into an Excel spreadsheet, from which thorough cleaning was performed. Data were exported to STATA version 14.0 for analysis. Descriptive statistics were performed to show the trends of MIP transmission in terms of years and age. Descriptive analysis was also made for severe cases and deaths, and the coverage of IPTp and LLINs. The findings of this study were presented in the form of line graphs, bar graphs, and pie charts. The QGIS software package was used to describe the spatial distribution of MIP cases and uptake of the prevention methods.
Quality control and assurance
The researcher was trained by the district biostatistician on the data extraction process from the DHIS2 system. In order to avoid any anomalies, extracted data was thoroughly scrutinized to identify any duplicates, outliers, and missing variables, and these were excluded from the final data set to be used for analysis with reference to the entry forms used at the facility level. A comprehensive data audit with the biostatistician was conducted to further ascertain the quality of reported data in the system.
Ethical considerations
This study used aggregated routine secondary data from DHIS2 and did not involve direct contact with human participants. Administrative permission to access and analyse the data was obtained from the Wakiso District Health Officer. Data extraction and handling were conducted under the supervision of the district biostatistician, and only de-identified aggregate data were used for analysis.
Trends of MIP cases in Wakiso District from January 2020 to December 2024
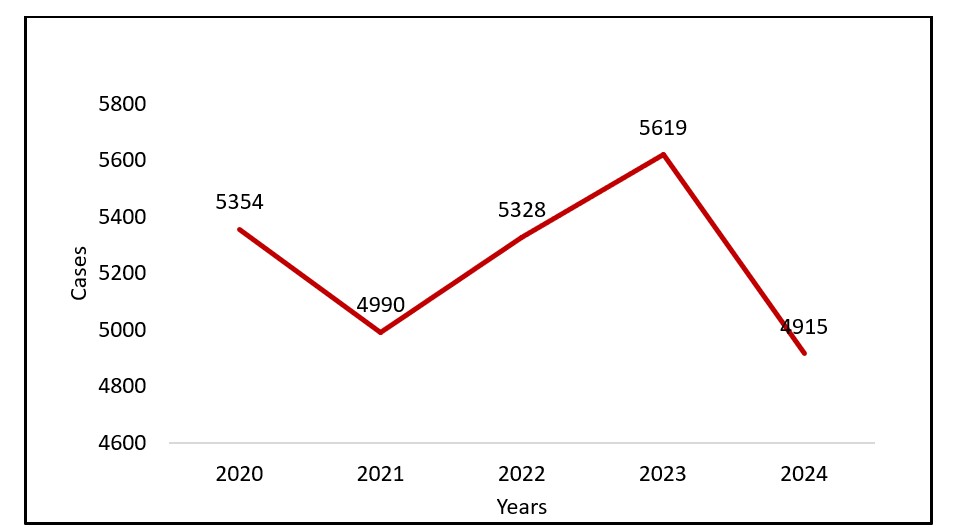
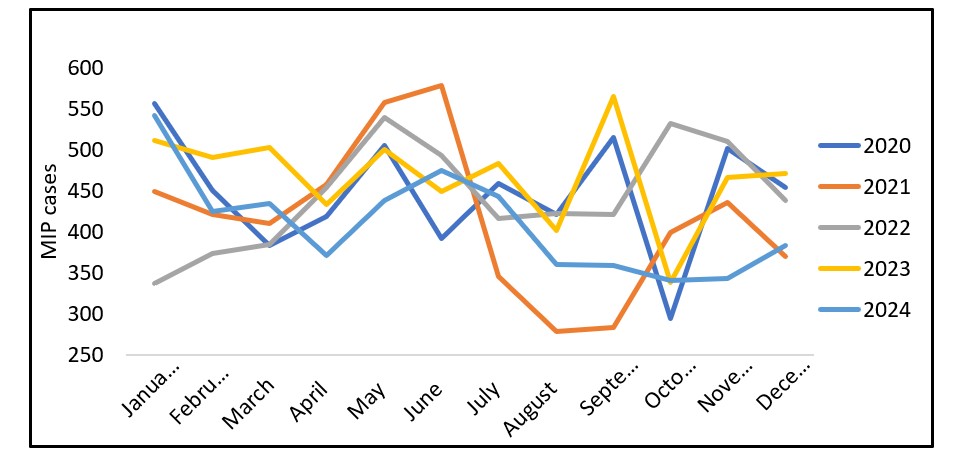
A total of 26,208 cases of MIP were recorded from 2020 to 2024. The cases were lowest in 2024 and highest in 5,619 cases in 2023. (Table 1). MIP over the five years showed an overall decline with fluctuations (Figure 2). With regards to monthly trends for all five years, May, June, September, November, and December were months with high reported cases of MIP. June 2021 had the highest reported MIP (579 cases, Figure 3)
Distribution of MIP by administrative units (sub-county) from 2020 to 2024
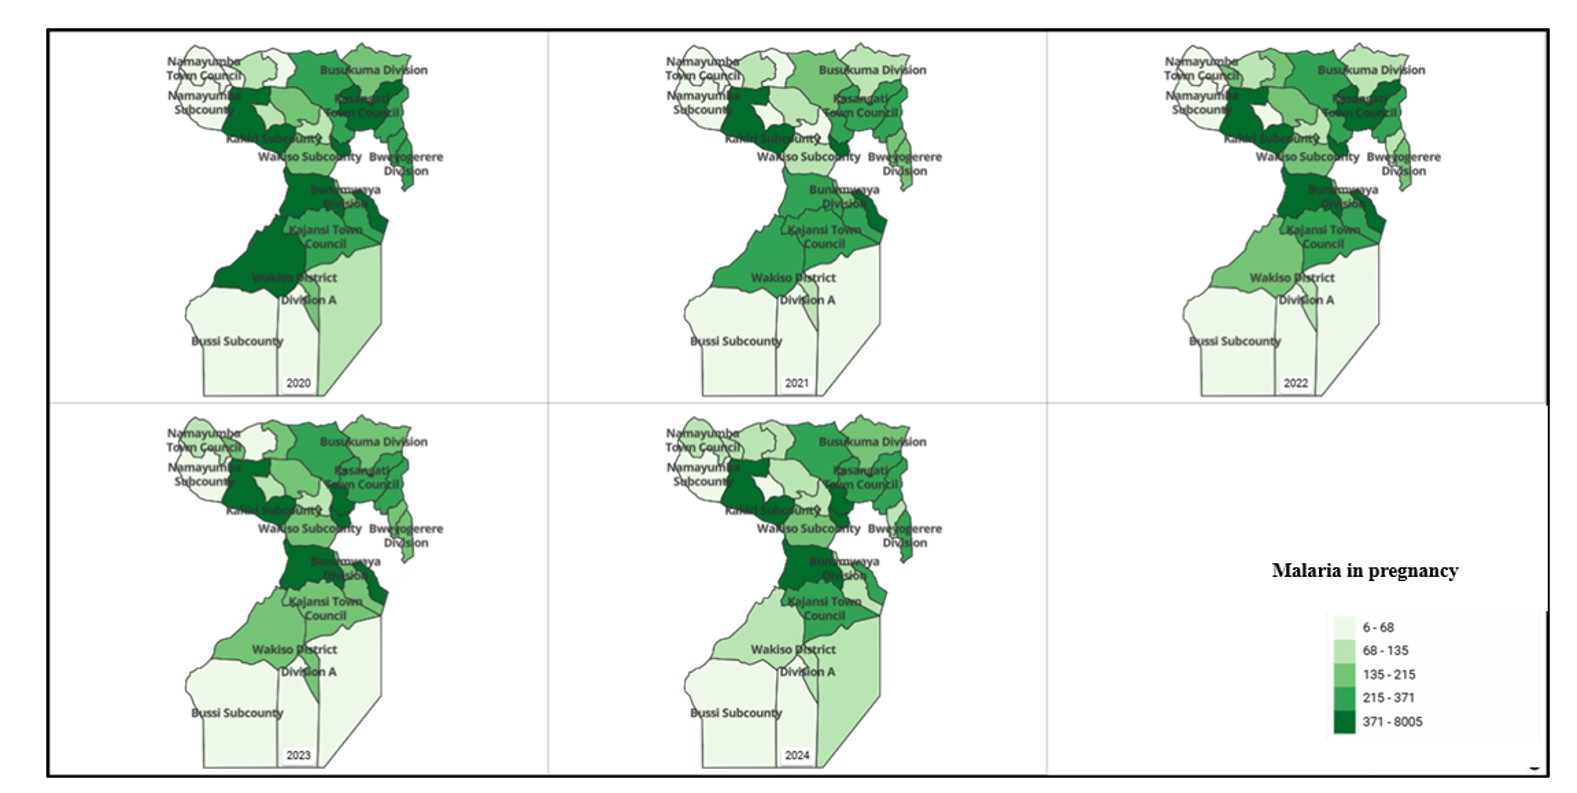
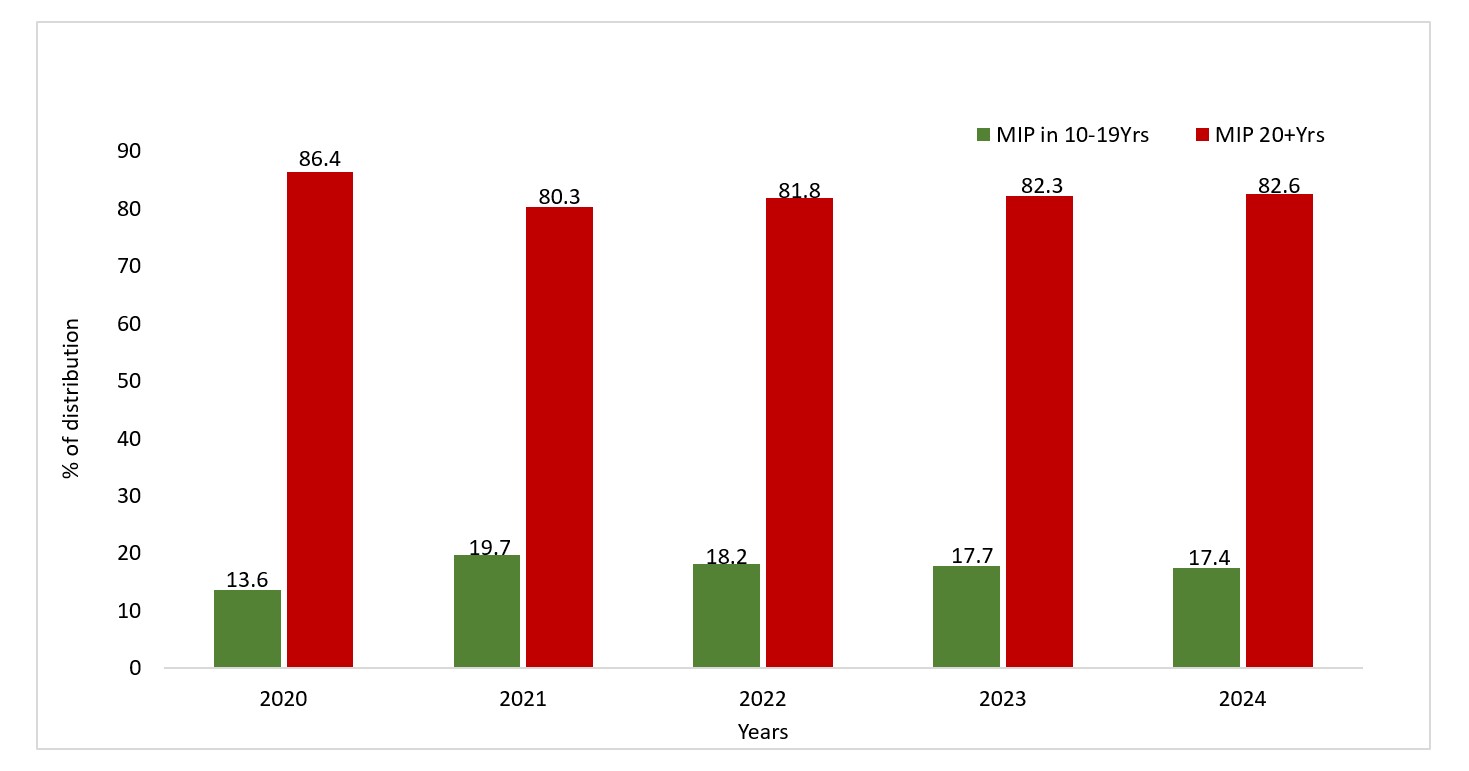
Over the five years, Kakiri, Bunamwaya, and Kasangati consistently reported malaria cases above 300, while Namayumba and Bussi have consistently reported cases below 100 for all five years (Figure 4). MIP was consistently higher among women aged 20 years and above compared to 10–19-year-olds. The highest proportion of MIP among adolescents (10–19 years) was in 2021 (19.7%), while the lowest was in 2020 (13.6%). Conversely, the highest proportion among women aged 20+ was in 2020 (86.4%), with the lowest in 2021 (80.3%).
Trends of severe MIP and deaths in Wakiso District from January 2020 to December 2024
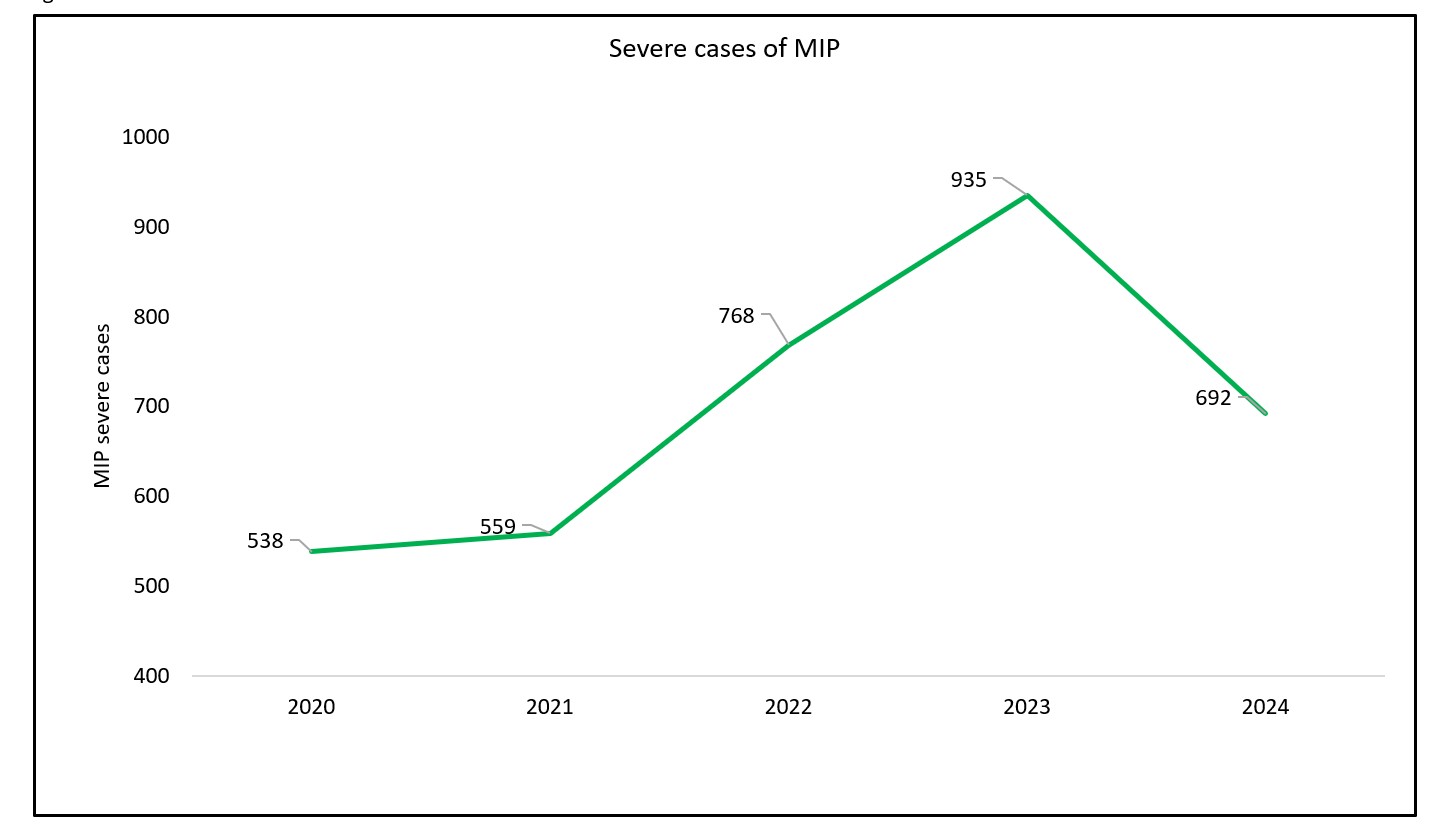
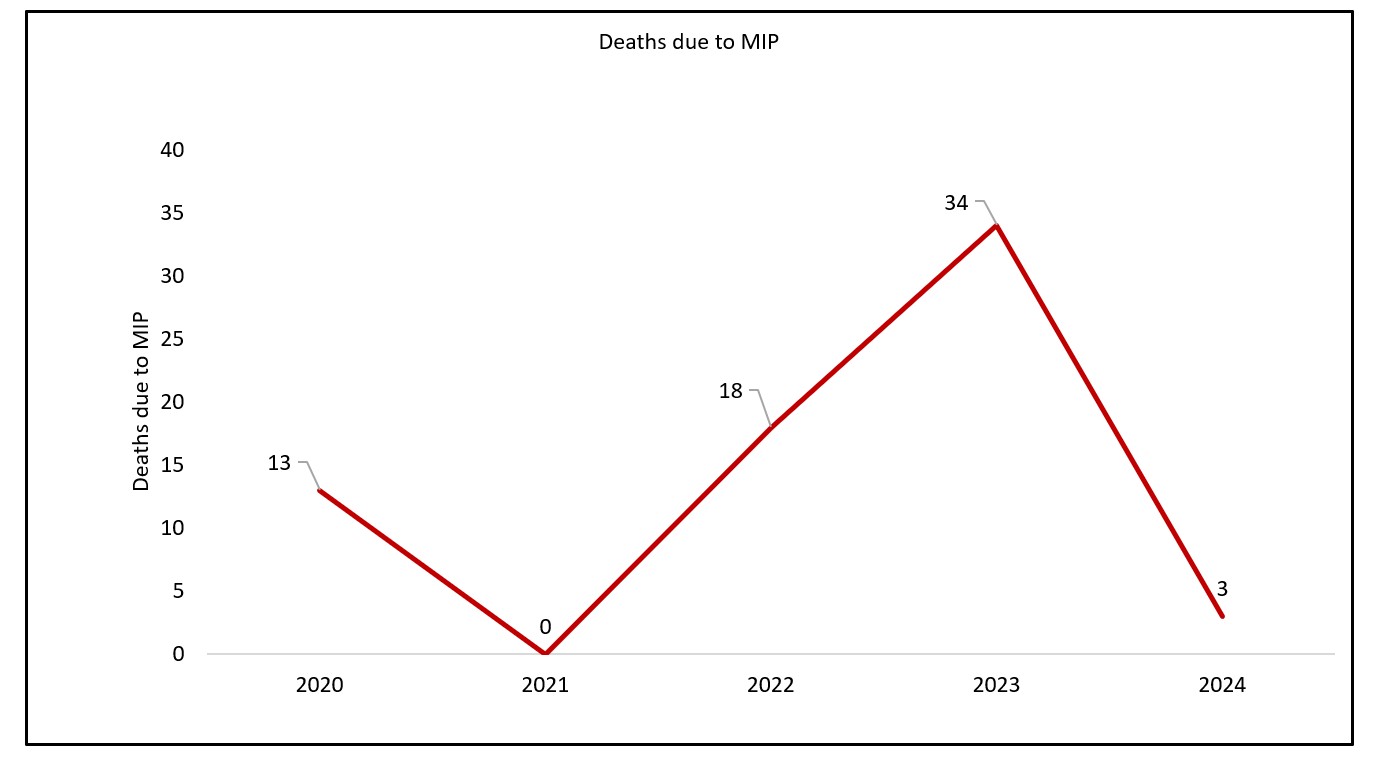
Severe MIP cases were lowest in 2020, at 538 cases, and highest in 2023, at 935 cases, representing 10.0% and 16.6% progression from uncomplicated MIP cases to severe cases, respectively (Figure 6). Notably, there have been reported deaths over the past five years, with 2023 having the highest deaths (34 deaths) (Figure 7). For all five years (2020-2024) an average of 10% of all cases progress into complicated cases of MIP. Majority of cases that progressed into severe stages were noted in 2023 (16.64%, Table 1).
Uptake of IPT doses in Wakiso District from January 2020 to December 2024
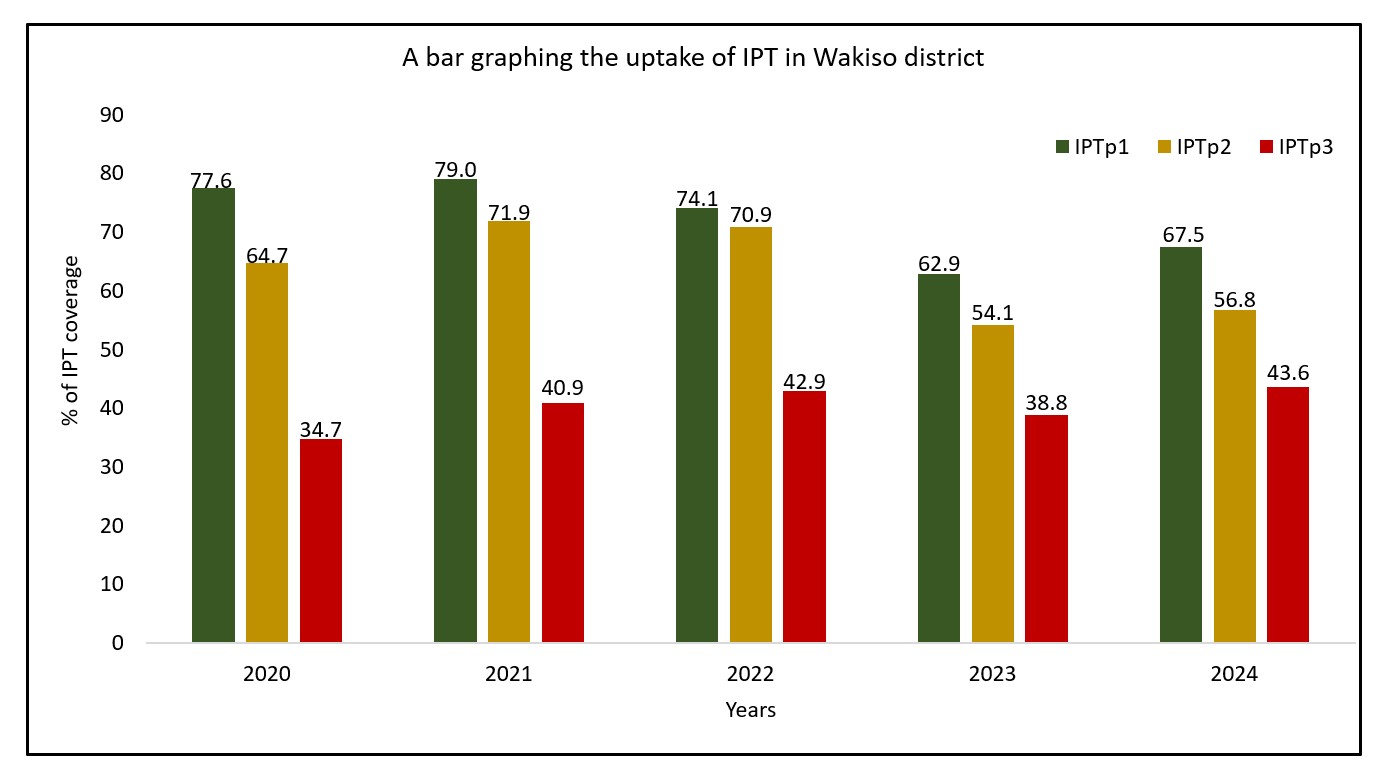
Across all five years, the uptake of IPTp1 dose is highest compared to other doses, with 2021 having the highest uptake (79%) and the lowest in 2023 (62.9%). IPTp3 is generally low across the five years, with 2020 having the lowest recorded percentage of uptake (34.7%) and 2024 having the highest uptake of IPTp3 (43.6%). The uptake of IPTp1 initially improved from 2020 to 2021, but declined consistently over the next 2 years before registering a 4.6% increase between 2023 and 2024. A similar trend is seen for IPTp2 and IPTp3; however, for IPTp3, uptake increased even into 2022. (Figure 8).
Coverage of LLINs among pregnant mothers attending ANC1 in Wakiso District from 2020 to 2024
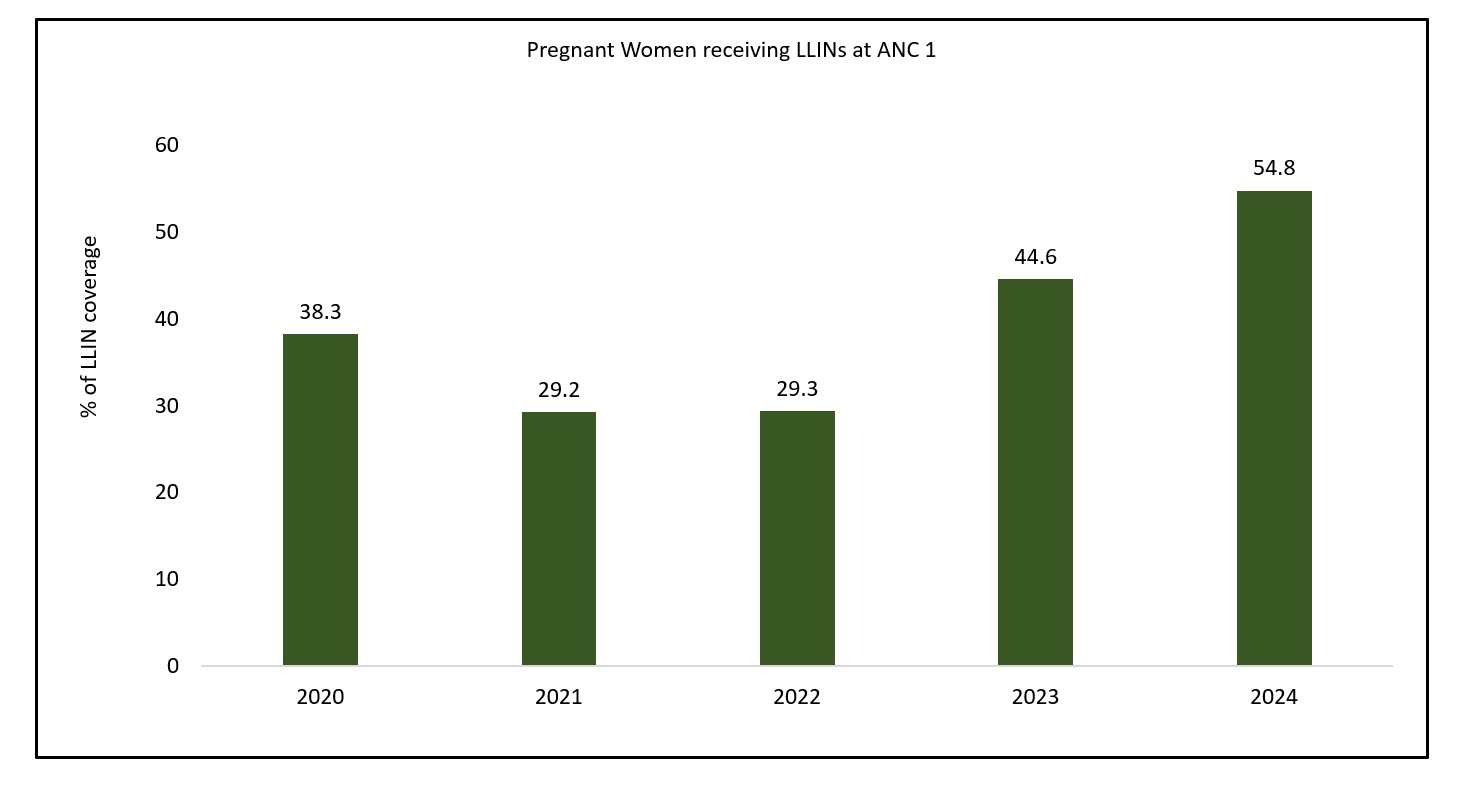
The coverage of LLINs among pregnant women attending ANC 1 in Wakiso District has shown an overall increasing trend over the years. The lowest coverage was recorded in 2021 to 2022 (29.3%), while the highest was in 2024 (54.8%). Starting from 2021, there has been a steady increase in LLIN coverage (Figure 9).
According to this study, a total of 26208 cases of MIP were recorded from 2020 to 2024 in Wakiso District. 2023 had the highest ever recorded cases (5619 cases) within these 5 years, and 2024 had the lowest recorded cases within the same period (4915 cases). The high cases from 2022 to 2023 could be attributed to the malaria outbreak that happened at that time. In the first six months of 2022, over 50% of Uganda’s districts experienced malaria outbreaks lasting at least 10 weeks, based on the 75th percentile threshold method [35].
Throughout the five years, the adult group consistently accounted for over 80% of MIP cases, with a slight decrease from 86.4% in 2020 to 82.6% in 2024. Notably, the highest percentage of adolescent MIP cases was recorded in 2021 at 19.7%, which may reflect an increase in teenage pregnancies during the COVID-19 pandemic due to school closures and reduced access to reproductive health services [36].
Following this peak, the percentage of adolescent MIP cases shows a gradual decline, reaching 17.4% in 2024. This is similar to a study in the US, which reported over 68.7% of MIP among the older population [37]. The trend shows the ongoing vulnerability of adolescent girls to malaria during pregnancy and underscores the need for age-specific interventions. While adult women are expected to have a higher share due to more frequent pregnancies, the relatively high and consistent proportion of adolescents affected suggests gaps in sexual and reproductive health education, access to contraceptives, and youth-friendly antenatal care services [38]. Additionally, this could be that women aged above 20 years seek care and go for ANC compared to those aged 10-19. Hence, most of their data is not captured within the system.
Severe cases of MIP were increasing over time from 538 cases in 2020 to 935 cases in 2023. This severity leads to complications, especially among pregnant women, which corresponds to the high deaths in 2023. Existing reasons could be limited use of mosquito nets, delayed care seeking, and stock out of essential medicines (IPTp). These factors are similar to another study by C Mangusho, E Mwebesa, J Izudi, M Aleni, R Dricile, RM Ayiasi and ID Legason [39], which also reported LLINs usage and early ANC attendance. This highlights the importance of improving the uptake of malaria preventive interventions at the district level among pregnant women, while also encouraging them to attend ANC to receive IPTp.
Across all five years, the uptake of IPTp1 dose is highest compared to other doses, with 2021 having the highest uptake (79%) and the lowest in 2023 (62.9%). This IPTp1 is administered at ANC1, which most pregnant women attend. This is also high because of the intense community engagements that VHTs conduct. IPTp3 is generally low across the five years, with 2020 having the lowest recorded percentage of uptake (34.7%) and 2024 having the highest uptake of IPT3 (43.6%). This is similar to another study conducted in Malawi, where the majority of pregnant women (70.2%) received two or fewer doses of IPTp, while only 29.8% achieved the recommended three or more doses, further highlighting the persistent gap in achieving optimal IPTp coverage [40].
WHO recommends the coverage for IPTp within countries between 80% to 100% [41]. Although these targets are higher, they are aimed at eliminating the burden of malaria, especially among pregnant women, given its impact on the unborn baby. The district still lagged within this period with as it only attained a 79% for IPTp1 in 2021. Uganda has a set target of at least 66% of pregnant women to receive three or more doses [42].
However, according to the analysis, the district was not hitting this target for all five years (2020 to 2024). These findings are consistent with those of a study conducted in three districts (Iganga, Luuka and Buyende) in eastern Uganda, which still reported a low uptake for the IPTp in reference to the national targets [43].
There is a gradual increase in the uptake of IPTp3 from 34.7% in 2020 to 43.6%. This could be due to the policy where the MOH recommends at least 4 ANC visits for all pregnant women. Although these are the recommendations, many women fail to comply, and thus, the majority attend once or twice. This makes them miss the IPTp3, hence its low uptake across the years. This low uptake of IPTp3 is similar to other studies, which have also reported a low uptake of this dose [42, 44].
Notably, pregnant women who can continue until they get IPTp3 are likely to exhibit good behaviour and use the LLINs [44]. Some factors that affect uptake for IPTp3 include poverty, limited knowledge, those living in disadvantaged communities, and health system issues [43, 44]. The role and expertise of health workers are cited as important motivators for IPTp uptake [45].
WHO recommends that all pregnant mothers during their ANC1 receive LLINs, particularly in malaria endemic regions such as Uganda and Wakiso District [46]. However, concerning the number of pregnant women at ANC1, barely half receive or use the LLINs [47]. The years 2021 and 2022 had the lowest uptake for LLINs, which could be due to the COVID-19 pandemic [48].
Based on the analysis, the uptake has gradually been improving from 29.3 in 2022 to 54.8% in 2024. This indicates the dedication by the district to prevent malaria. This could also be explained by the availability of donors that have been supporting health facilities in availing these LLINs at the public HCFs. Although it’s an improvement, it still lags behind the set target of providing a LLIN to every pregnant mother attending ANC [46]. The low uptake is also consistent with another study in Dawo district, Southwest Shoa Zone, Oromia, Ethiopia, which reported a 55.5% utilization of LLINs [49]. Nonattendance for ANC, limited community engagement, enrollment into community based insurance, having a previous child under 5 years, income and knowledge on malaria were reported as the factors affecting the uptake of LLINs [49]. LLINs have also been reported to act as incentives that motivate pregnant mothers to continue ANC and corresponding IPTp [44]. Studies have suggested that reinforcing ANC attendance in the first trimester is key to facilitating the uptake of LLINs [50].
Study limitation
This study was limited as it relied on available data within the DHIS2 which could be subject to misreporting or underreporting. As a facility-based analysis, cases managed at home or in the community were not captured, potentially underestimating the true MIP burden. MIP-related deaths were based on facility recordings in the HMIS 105 tool and may be subject to misclassification due to inconsistent cause-of-death documentation; additionally, deaths occurring outside health facilities were not captured, likely underestimating true MIP mortality. The retrospective design precludes causal inference, and unmeasured confounders such as socioeconomic status and distance to health facilities may have influenced the findings. Additionally, ANC1 attendance was used as a proxy denominator, and spatial analysis was limited to the sub-county level.
Reported MIP cases fluctuated between 2020 and 2024, with the highest number recorded in 2023 and the lowest in 2024 in Wakiso District. Some of these progress into severe cases that also translate into deaths. Within the district, the uptake for IPT and LLIN distribution at the facility level remains low, below the WHO standards. There is a downward trend for the IPT uptake over the years, while there is an increasing trend for LLINs within the district. The district should prioritise strengthening the supply chain and health worker adherence to IPTp administration protocols to reverse the declining trend in IPTp uptake. Additionally, efforts to sustain and scale up LLIN distribution at ANC should be intensified to ensure all eligible pregnant women receive bed nets in line with WHO recommendations.
What is already known about the topic
What this study adds
| Table 1: Severe MIP as a proportion of reported MIP cases | |||
|---|---|---|---|
| Year | MIP cases | Severe MIP | Proportion of progression to severe MIP (%) |
| 2020 | 5354 | 538 | 10.05 |
| 2021 | 4990 | 559 | 11.20 |
| 2022 | 5328 | 768 | 14.41 |
| 2023 | 5619 | 935 | 16.64 |
| 2024 | 4915 | 692 | 14.08 |