
Research | Open Access | Volume 9 (3): Article 116 | Published: 14 Jul 2026

Views: 948
Menu, Tables and Figures
| Variable | Frequency (N/n) | Proportion of AYP (%) |
|---|---|---|
| Socio-demographic characteristics | ||
| Age group in years (n=195) | ||
| 10–14 | 72 | 37 |
| 15–19 | 65 | 33 |
| 20–24 | 58 | 30 |
| Sex | ||
| Male | 76 | 39 |
| Female | 119 | 61 |
| Facility | ||
| Kirwara Subcounty Hospital | 69 | 35 |
| Ithanga Health Centre | 61 | 31 |
| Gatura Health Centre | 38 | 20 |
| Gatunyu Health Centre | 16 | 8 |
| Mitubiri Health Centre | 8 | 4 |
| Kigoro Health Centre | 3 | 2 |
| Marital status | ||
| Not Married | 168 | 86 |
| Married | 25 | 13 |
| Separated | 1 | 0.5 |
| Divorced | 1 | 0.5 |
| Clinical characteristics | ||
| Viral suppression | ||
| Virally suppressed | 175 | 90 |
| Not virally suppressed | 20 | 10 |
| Last Viral Load results duration (Years) | ||
| ≤1 | 76 | 39 |
| >1 | 119 | 61 |
| ART duration (Years) | ||
| 1–5 | 63 | 32 |
| 6–10 | 101 | 52 |
| 11–16 | 31 | 16 |
| Clinical WHO Stage | ||
| 1 | 148 | 76 |
| 2 | 44 | 23 |
| 3 | 3 | 2 |
| ART Regimen Line | ||
| First line | 168 | 86 |
| Second line | 27 | 14 |
| Regimen Type | ||
| DTG Based | 168 | 86 |
| NNRTI Based | 2 | 1 |
| PI Based | 25 | 13 |
| IPT Given | ||
| Yes | 167 | 86 |
| No | 28 | 14 |
| IPT Completion status (n=167) | ||
| Treatment completed | 153 | 92 |
| Discontinued | 2 | 1 |
| Missing data | 12 | 7 |
| TB Co-infection | ||
| No | 191 | 98 |
| Yes | 4 | 2 |
| Nutritional Status (BMI) (Kg/m2) | ||
| Normal Weight (18.5–24.9) | 103 | 53 |
| Obesity (≥30.0) | 5 | 3 |
| Overweight (25.0–29.9) | 12 | 6 |
| Underweight (<18.5) | 75 | 38 |
| CTX Prophylaxis | ||
| Yes | 195 | 100 |
| CD4 Counts Documented | ||
| No | 97 | 49.7 |
| Yes | 98 | 50.3 |
Table 1: Socio-demographic and clinical characteristics of AYP on ART Gatanga Sub-County, April 2022
| Variable | Not Suppressed Frequency (%) | Virally Suppressed Frequency (%) | POR (95% CI) | P Value |
|---|---|---|---|---|
| Current ART Regimen Line | ||||
| Second Line | 8 (40) | 19 (10.8) | 5.47 (1.98–15.08) | 0.00035* |
| First Line | 12 (60) | 156 (89) | ref | |
| Current ART Regimen | ||||
| PI/NNRTI Based | 6 (30) | 21 (12) | 3.14 (1.08–9.06) | 0.027* |
| DTG Based | 14 (70) | 154 (88) | ref | |
| Sex | ||||
| Male | 11 (55) | 65 (37) | 2.06 (0.81–5.2) | 0.12 |
| Female | 9 (45) | 110 (63) | ref | |
| IPT | ||||
| Not given IPT | 5 (25) | 23 (13) | 2.2 (0.73–6.63) | 0.15 |
| Given IPT | 15 (75) | 152 (87) | ref | |
| WHO Stage | ||||
| Stage 3 | 1 (5) | 2 (1) | 4.55 (0.39–52.5) | 0.27 |
| Stage 1 & 2 | 19 (95) | 173 (99) | ref | |
| Age | ||||
| <20 Years | 12 (60) | 125 (71) | 0.6 (0.23–1.55) | 0.28 |
| ≥20 Years | 8 (40) | 50 (29) | ref | |
| Duration on ART in years | ||||
| >5 | 15 (75) | 117 (67) | 1.49 (0.51–4.2) | 0.46 |
| ≤5 | 5 (25) | 58 (33) | ref | |
| Body Mass Index (BMI) (Kg/m2) | ||||
| Under Weight | 9 (45) | 66 (37.7) | 1.35 (0.53–3.43) | 0.52 |
| Normal / Over Weight / Obesity | 11 (55) | 109 (62.3) | ref | |
| Marital Status | ||||
| Single/Divorced/Separated | 17 (85) | 153 (87) | 0.8 (0.22–3.0) | 0.75 |
| Married | 3 (15) | 22 (13) | ref |
*Statistically significant
Table 2: Factors associated with viral non-suppression among AYP on ART in Gatanga Sub-County, April 2022
Moses Muriithi Njiru1,2,&, Maurice Owiny2,3, Bridget Wesonga2, Maryanne Gachari2, Winnie Kanyi1, Bonface Waweru2, Maria Nunga2
1Department of Health, Murang’a County Government, Murang’a, Kenya, 2Field Epidemiology & Laboratory Training Program, Ministry of Health, Nairobi, Kenya, 3African Field Epidemiology Network, Nairobi, Kenya
&Corresponding author: Moses Muriithi Njiru, Kenya FELTP P.O. Box 225-00202, Nairobi, Kenya, Email: mnjiruh@gmail.com, ORCID: https://orcid.org/0009-0008-8178-8587
Received: 17 Jun 2025, Accepted: 07 Jul 2026, Published: 14 Jul 2026
Domain: HIV Epidemiology
Keywords: Adolescent, cross-sectional studies, Viral Load, Kenya, HIV Infections.
©Moses Muriithi Njiru et al. Journal of Interventional Epidemiology and Public Health (ISSN: 2664-2824). This is an Open Access article distributed under the terms of the Creative Commons Attribution International 4.0 License (https://creativecommons.org/licenses/by/4.0/), which permits unrestricted use, distribution, and reproduction in any medium, provided the original work is properly cited.
Cite this article: Moses Muriithi Njiru et al., Viral suppression among adolescents and young people on antiretroviral treatment in a rural setting in Kenya, 2022. Journal of Interventional Epidemiology and Public Health. 2026; 9(3):116. https://doi.org/10.37432/jieph-d-25-00141
Introduction: In Kenya, adolescents and young people (AYP) living with HIV and on antiretroviral therapy (ART) have a low-level viral load suppression of 52% against the globally recommended 95%. Viral suppression outcomes and their associated factors among AYP on ART in Kenya’s rural setting are not well described. We described viral suppression outcomes among AYP on ART in rural Gatanga Sub-County.
Methods: We conducted a cross-sectional study among AYP aged 10–24 years active on ART as of April 2022. The outcome variable was viral suppression of <1,000 viral copies/ml of blood. Data were abstracted from the electronic medical record system, cleaned, coded, and analyzed. Means described continuous variables, while frequencies and proportions described categorical variables. Prevalence odds ratios (POR) and their corresponding confidence intervals (CI) were used to determine the association between independent variables and the outcome of interest (viral suppression).
Results: We analyzed 195 records of AYP on ART. The mean age was 16.7±SD4.3 years. Overall, the virological suppression rate was 90%, while that of those aged 10–14 years was 88%, and that of those aged 20–24 years was 86%. Only 39% had viral load results within the previous year. Second-line ART regimens (POR:5.47, 95%CI:1.98–15.08) relative to first-line and Protease Inhibitors (PI) & Non-Nucleoside Reverse Transcriptase Inhibitors (NNRTI) based regimens (POR:3.14,95% CI:1.08–9.06) relative to Dolutegravir (DTG) based ART regimens were associated with non-suppression.
Conclusions: Viral load suppression among AYP on ART was suboptimal. Second-line ART and use of PI & NNRTI-based ART regimens were risk factors for viral non-suppression. Optimised ART regimens could improve viral load suppression.
Human Immunodeficiency Virus (HIV) is a virus that attacks and weakens the immune system, making infected individuals vulnerable to opportunistic infections [1]. Individuals at risk of HIV infection should have an HIV test, and those found to be HIV positive are offered a standard package of care that includes antiretroviral therapy (ART) as soon as possible. Follow-up is done to monitor an individual’s response to treatment. Clinical evaluation and laboratory tests, such as CD4 and Viral Load testing, are periodically done [2].Towards the elimination of HIV/AIDS by 2030, joint United Nations Program on HIV/AIDS (UNAIDS) set ambitious targets in December 2020 of ensuring that 95% of people living with HIV (PLHIV) knew their HIV status, 95% of PLHIV were initiated on antiretroviral therapy (ART) and 95% of those started on ART achieved viral suppression by 2025 in all the subpopulations [3]. Viral load suppression is a vital indicator of effective ART, defined as having less than 1000 copies per millilitre of blood, while viral load levels greater than 1000 copies per millilitre indicate non-suppression and routine testing is indicated every 6 months for 0–24 years old [4].
Globally in 2021, it was estimated that 37.7 million people were living with HIV, of these being 1.7 million adolescents and 3.4 million young people. The Africa region contributed to over two-thirds (25.4 million) of PLHIV [5]. In Kenya, it was estimated that 1.5 million (4.5% prevalence) people were living with HIV, making the country have the fifth largest HIV burden in the world, with an estimated 237,105 AYP living with HIV. Murang’a County had an estimated 20,663 PLHIV (2.5% prevalence), with 2,248 AYP living with HIV [6]. Gatanga Sub-County was estimated to have 3,540 PLHIV (2.4% prevalence), with 517 AYP living with HIV [7]. The Sub-County had 2,515 PLHIV on ART, among them being 230 AYP currently on care by April 2022 [8].
The number of Adolescents and young people living with HIV continues to increase following new HIV infections, in addition to the perinatal acquisition of HIV. According to Kenya’s World AIDS Day progress report, in 2021, 42% of new adult HIV infections in the country occurred in adolescents and young people (15-24 years old) [9]. Adolescents have low levels of testing, linkage, and retention to care [10]. In addition, they have poor adherence to antiretroviral treatment and therefore are more likely to develop poor viral suppression and treatment failure compared to adults, according to the United Nations Children’s Fund (UNICEF) [11]. Globally, viral suppression among adolescents varied from 27–89% [12]. Other studies in South Africa found that adolescents and young people aged 15–24 years receiving ART had poorer treatment outcomes in terms of virological response, loss to follow-up (LTFU) rates, and virological failure compared with adults [13,14]. According to the Kenya Population-based HIV Impact Assessment (KENPHIA) Report of 2018, adolescents and young people living with HIV had a low-level prevalence of HIV viral load suppression. Age group of 10–14 (48.3%) and 15–24 years (56.3%) compared to adults (71.6%) [15]. Further, a study in Kenyatta National Hospital (KNH) found that Adolescents and young people had overall sub-optimal viral load suppression of 76.9%, with late adolescents (18–19 years) and young adults (20-24 years) being more likely to develop virological failure [10]. However, their study had a limitation of being a single site in Nairobi city, which is an urban setting and therefore not necessarily generalized. Another study done in Kenya found a non-suppression rate of 27%, with younger AYP being less likely to be suppressed compared to older AYP [16].
With limited documentation on viral suppression outcomes among adolescents and young people on ART, in rural health facilities in Gatanga Sub-County, our study aimed at establishing viral suppression outcomes among adolescents and young people on ART attending comprehensive care Centres (CCC) in Gatanga Sub-County, Murang’a County. Areas of intervention identified would be used in making informed decisions towards improving the quality of life for adolescents and young people on ART.
Study design
We conducted a cross-sectional study by retrospectively reviewing electronic medical records (EMR) of adolescents and young people living with HIV on antiretroviral therapy in Gatanga Sub-County’s six comprehensive care centres (CCC) as of April 2022. The abstracted line list included records of AYP aged 10–24 years on ART as of April 2022, and have been on follow-up for at least 6 months, and viral load results were recorded. This included records of AYP who started ART from November 2005 to March 2021. We excluded records of AYP on ART with no viral load results. Their electronic medical records were reviewed to determine viral suppression outcomes.
Study setting
Gatanga Sub-County is one of the seven sub-counties in Murang’a County. In the year 2021, it had an estimated population of 196,752 with six administrative wards, namely: Kariara, Gatanga, Kihumbu-ini, Mugumoini, Kakuzi/Mitubiri and Ithanga[17]. It is largely rural, and residents are mainly involved with agricultural production, including tea, coffee, avocado, horticultural, and dairy farming. Subsistence farming is also common, with maize, beans, bananas, tubers, and vegetables being grown. According to Murang’a County Aids Implementation Plan, 2021–2025, key drivers of new HIV infections include alcoholism, poverty, early sexual debut, sexual gender-based violence, migrant labour, low condom use, and key populations.
HIV Care and treatment services are offered in six Comprehensive Care Centres (CCC): Kirwara Sub-county Hospital, Gatura Health Centre, Kigoro Health Centre, Gatunyu Dispensary, Mitubiri Health Centre, and Ithanga Health Centre. They are all public health facilities.
Definitions
We defined suppression as a viral load of <1,000 viral copies/ml of blood [18]. Adolescents and young people were classified as young adolescents (10–14 years), older adolescents (15–19 years), and young adults (20–24 years). A person active on ART was defined as a client on ART who collected antiretroviral drugs in a place where they regularly pick them up or have drugs to last them between periods of review. The follow-up period depends on the differentiated care categorization of the patients. The stable patients require a longer duration before clinical reviews compared to unstable patients, who require a shorter duration [4].
Data collection and management
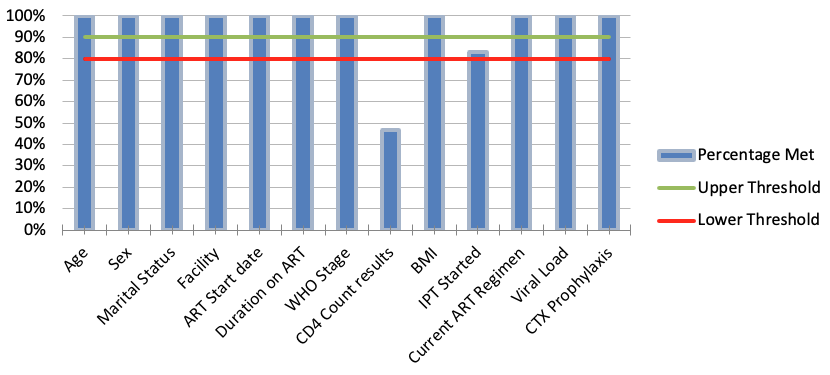
Adolescents and young people (AYP) on antiretroviral therapy (ART), electronic socio-demographic and clinical records were abstracted from the Kenya electronic medical record (EMR) system. Records reviewed were for the AYP who had been on follow-up for at least 6 months, and their last viral load results recorded as of April 2022 in all 6 CCCs in Gatanga Sub-County. A Microsoft Excel 2016 data abstraction sheet was used. The variables selected were based on data available in the EMR system. The variables collected included. Demographic data: Age, Sex, Facility, and Marital status. Clinical data: ART start date, duration of ART, clinical WHO stage, CD4 Count documentation, body mass index (BMI), Co-trimoxazole (CTX) Prophylaxis, Isoniazid Preventive Therapy (IPT), IPT outcome, TB Co-infection, current ART regimen line, current regimen type, viral load and duration since last Viral load test. The outcome variable was viral suppression among AYP. Data Quality Audit (DQA) was conducted using a standard tool to check for completeness (percentage of required data elements that were filled) of variables recorded in the Kenya EMR system. The variables evaluated included age, sex, marital status, facility, ART start date, duration on ART, WHO stage, CD4 count results, BMI, IPT started, current ART regimen, viral load and whether co-trimoxazole prophylaxis was provided. The lower and upper threshold limits were 80% and 90%, respectively.
Data analysis
The data collected were cleaned, coded, and stored in a Microsoft Excel 2016 database. Patients’ data were de-identified by removing names and patients’ unique identifiers such as the CCC number. It was exported to Epi-Info software version 7.2.2 for analysis. Continuous variables were summarized using the mean and standard deviation. The numerator was the sum of AYP ages, and the denominator was the total number of observations. Frequency and proportions were calculated for categorical variables. For analytical statistics, Prevalence odds ratios (POR) were used as a measure of association between viral suppression outcome and exposure variables. Confidence intervals at a 95% confidence level and P< 0.05 were used to report statistical significance.
Ethical consideration
The operational study utilised retrospective secondary routine data, which did not involve any direct contact with human subjects. The data were de-identified and stored in a password-protected computer for confidentiality and privacy maintenance. The findings are reported in aggregate to protect individuals’ privacy. The administrative authorization to access and conduct data analysis was sought and granted by the Department of Health, Murang’a County Government, and the Kenya Field Epidemiology and Laboratory Training Program (K-FELTP).
Socio-demographic and clinical characteristics
We abstracted a total of 230 records of adolescents and young people (AYPs) receiving antiretroviral treatment (ART) in Gatanga Sub-County and excluded 35 records that lacked viral load results. A total of 195 records were analyzed. Their mean age was 16.7 ± SD 4.3 years. Age distribution was 72 (37%) for 10–14 years, 65 (33%) for 15–19 years, and 58 (30%) for 20–24 years old. Females were 119 (61%). Kirwara Sub-County Hospital had the majority of AYP, 6 (35%), while Kigoro Health Centre had the least, 3 (2%). Those who were not married were 168 (86%), married 25 (13%), separated 1 (0.5%), and divorced 1 (0.5%).
AYP on ART in Gatanga Sub-County as of April 2022, who were not virally suppressed were 20 (10.3%), while those virally suppressed were 175 (89.7%). Viral Load tests done and results available within the last year were 76 (39%). Adolescents and young people on ART had a mean duration on ART of 7.3±SD 3.7 years, with 63 (32%) being on ART for 5 years and below, 101 (52%) for 6–10 years, and 31 (16%) for 11–16 years. AYP on ART in clinical WHO stage 1 were 148 (76%), WHO stage 2 were 44 (23%), and WHO stage 3 were 3 (2%). Those on the first line of ART were 168 (86%), while 27 (14%) were on the second line. Patients on Dolutegravir (DTG) based regimens were 168 (86%), contributing to 98% of first-line treatment. Protease Inhibitor (PI) based regimens were 25 (13%), contributing to 89% of the second-line ART, and 2 (1%) were on NNRTI-based regimens. Isoniazid Preventive Therapy (IPT) was given to 167 (86%) of AYPs on ART. Of those, 153 (92%) were recorded as treatment completed, 2 (1%) discontinued, and 12 had missing data. Tuberculosis co-infection was in 4 (2%). Nutritional status was recorded as normal weight 103 (53%), Underweight 75 (38%), Overweight 12 (6%), and Obesity 5 (3%). All were given Co-trimoxazole (CTX) prophylaxis, and CD4 Counts were done and documented in 98 (50.3%) of the AYP (Table 1).
Viral suppression rates
The viral suppression rate was 88% (63/72) for those aged 10–14 years, 95% (62/65) for those aged 15–19 years and 86% (50/58) for those aged 20–24 years.
For the data quality audit, all the assessed variables met a lower threshold of 80% of data completeness, except the CD4 count, which had a score of 47% (Figure 1).
Factors associated with viral suppression outcomes.
Adolescents and young people (AYP) on the second line of the ART regimens had higher odds of non-suppression compared to those on the first line (POR: 5.47, CI: 1.98–15.08, p-value <0.001). Those on Protease Inhibitors (PI) & Non-Nucleoside Reverse Transcriptase (NNRTI) based ART regimens had higher odds of non-suppression compared to those on Dolutegravir (DTG) based regimen (POR 3.14, CI: 1.08–9.06, p=0.027). Though not statistically significant, males had higher odds of non-suppression relative to females (POR 2.06, CI: 0.81–5.2, p=0.12). Those not given IPT had higher odds of non-suppression relative to those given (POR 2.2, CI: 0.73–6.63, p=0.15). Those in clinical WHO Stage 3 had higher odds of non-suppression compared to those in clinical stages 1 and 2 (POR 4.55, CI:0.39–52.5, p=0.27). Adolescents (10–19 years) had lower odds of viral non-suppression relative to younger adults (20–24) (POR 0.6, CI:0.23–1.55, p=0.28). Those on ART for more than 5 years had higher odds of viral non-suppression compared to those who had taken ART for less than 5 years (POR 1.49, CI:0.51–4.2, p=0.46). Additionally, those AYPs on ART whose nutritional status was underweight had higher odds of non-suppression compared to those who had normal weight, overweight and obese (POR 1.35, CI: 0.53–3.43, p=0.52). Finally, those whose marital status was indicated as single, divorced or separated had lower odds of viral non-suppression compared to those married (POR 0.8, CI: 0.22–3.0, p= 0.75) (Table 2).
Our study showed that adolescents and young people (AYP) on Antiretroviral treatment (ART) in Gatanga Sub-County had an overall viral suppression rate of 90% against the Joint United Nations Program on HIV/AIDS (UNAIDS) global target of 95% for viral suppression.
The majority of the AYP were adolescents (10–19 years old), which could be indicative of long-term survival of vertically infected children due to expanded access to ART and horizontal infection of older adolescents [18,19]. Females were predominant. This was consistent with the KENPHIA report, which showed that HIV was twice as prevalent in women as in men[15]. Also consistent with a survey carried out in Kenya, which found women to be the majority (70%) [16]. However, it differed from the findings of the Kenyatta National Hospital (KNH) study, which reported a male-to-female ratio of nearly 1:1 [10]. Two-thirds of the AYP on ART received their treatment from Kirwara Sub-County Hospital and Ithanga Health Centre Comprehensive Care Centres (CCC). These are larger healthcare facilities offering more services to patients than the others. Also, the majority of AYP had a single marital status. This is because of the inclusion of those aged less than 18 years, which is the legal age of marriage in Kenya.
The viral suppression status was lower than the UNAIDS 95-95-95 target of 95% viral suppression of those initiated on ART[3]. Younger adolescents (10–14 years) and younger adults (20–24 years) had lower viral suppression rates compared to older adolescents (15–19 years). While maintaining viral suppression for older adolescents, interventions to address non-suppression in younger adolescents and younger adults should be prioritized. The suppression rates were higher than the KENPHIA findings of 48.3% for those aged 10–14 and 56.3% for those aged 15–24 years [15] and also higher than the KNH study findings of viral load suppression of 76.9% [10]. Some of the reasons for lower suppression among younger adolescents could be due to caregivers’ characteristics, such as change of caregivers, their education level and comprehension of ART administration, regimen characteristics such as unpalatable paediatric medications, and child characteristics such as rapid weight changes affecting dosing and optimal response to ART [20].
Being in the adolescent age group of 10–19 years was a protective factor for non-suppression relative to young adults. This meant, though not statistically significant, that lower suppression rates among young adults compared to adolescents were notable. A third of AYP had valid viral load results. Their last viral loads were done within one year. This was attributable to the national-level stock-out of viral load reagents in 2020 and 2021. There was a possibility of missed opportunities for interventions such as enhanced adherence counselling for those who could not have achieved viral suppression. Indeed, shorter viral load turnaround times may improve viral suppression in AYP [16]. More than two-thirds of AYP were on a first-line ART regimen, with a Dolutegravir (DTG) based regimen being predominantly used as a first-line regimen. This indicated adherence to the National guidelines on ART optimisation [4] and WHO recommendations [21].
Adolescents and Young People (AYP) on the first line of the ART regimen were five times less likely to have viral non-suppression relative to those in the second line of ART. This is especially true when barriers that led to the 1st line ART failure were not addressed adequately. There is a need for enhanced adherence counselling (EAC) for at least 3 months before ART switch [4]. Additionally, AYP on Dolutegravir (DTG) based regimens were 3 times less likely to develop non-suppression relative to those on Protease Inhibitors (PI) & Non-Nucleoside Reverse Transcriptase Inhibitors (NNRTI) based ART regimens. These findings were statistically significant and support evidence that DTG use is effective in rapidly lowering viral load levels in the blood. Male AYP on ART were two times more likely to develop viral non-suppression relative to females, though not significant. This was consistent with findings of a national survey in Kenya on factors that influence HIV viral suppression in AYP, which showed male AYP had lower odds of viral suppression [16] but was different from a study carried out in Bomu Hospital, Mombasa County, in adult HIV patients, which found no association between gender and viral suppression [22]. Those in clinical WHO Stage 3 had nearly five times the odds of developing non-suppression compared to those in stages 1 and 2. This is possibly due to advanced HIV disease with an associated poor immune response. Therefore, there was a need to initiate treatment early, as per the national guidelines, to preserve immunity [4]. AYP who never used IPT and were on ART for more than 5 years were twice as likely to develop non-suppression. IPT prevents tuberculosis infection from becoming a disease [23]. TB comorbidity could strain already weakened immunity, affecting treatment response. Being Single/Divorced/separated was protective for non-suppression relative to being married.
Data Quality Assessment on variables in Kenya EMR showed that all assessed variables met the minimum threshold, except CD4 Count. Further, documentation of CD4 count was only documented in half of the records abstracted. This indicated that Healthcare workers were not carrying out baseline CD4 Count tests as recommended by the National guidelines on the use of ART[4].
Study limitations
The study involved secondary facility-based data review from the electronic medical system, with most of the viral load data being more than one year old, and those without viral load results were excluded. The latter may overestimate the viral suppression in the included records of AYP. However, the numbers excluded due to missing data were small, at only 35 AYP. Overall, the findings provide a snapshot of the viral suppression status for AYP, which can inform decision-makers towards targeted interventions.
Viral load suppression was suboptimal among AYP, especially in younger adolescents (10–14 years) and young adults (20–24 years). Second-line ART regimen and use of PI/NNRTI-based regimens were significantly associated with viral non-suppression, while other factors showed no statistically significant association. Strengthening timely Viral-load testing would be critical for optimal patient management.
What is already known about the topic
What this study adds
Maurice Owiny is an Associate Editor at the Journal of Interventional Epidemiology and Public Health (JIEPH) and a co-author of this manuscript. In line with the journal’s conflict of interest policy, he was fully recused from the peer review process and had no involvement in editorial handling or decision-making for this submission. An independent editor oversaw the review and decision-making process. The other authors declare that they have no competing interests.
The authors appreciate the Field Epidemiology and Laboratory Program, Kenya, for facilitating the study. Gratitude to the Department of Health, Murang’a County, for the opportunity to carry out the study. We also thank the members of staff in Gatanga Sub-County’s six Comprehensive Care Centres and Monitoring and Evaluation officers in the Tegemeza Plus project.
MMN, BW, and MN conceptualized and designed the study. MMN collected the data. MMN and MO conducted the analysis and drafted the manuscript. MO, BW, MG, WK, BW, and MN provided supervision and critically reviewed the manuscript for intellectual content. All authors read and approved the final manuscript.
| Variable | Frequency (N/n) | Proportion of AYP (%) |
|---|---|---|
| Socio-demographic characteristics | ||
| Age group in years (n=195) | ||
| 10–14 | 72 | 37 |
| 15–19 | 65 | 33 |
| 20–24 | 58 | 30 |
| Sex | ||
| Male | 76 | 39 |
| Female | 119 | 61 |
| Facility | ||
| Kirwara Sub-County Hospital | 69 | 35 |
| Ithanga Health Centre | 61 | 31 |
| Gatura Health Centre | 38 | 20 |
| Gatunyu Health Centre | 16 | 8 |
| Mitubiri Health Centre | 8 | 4 |
| Kigoro Health Centre | 3 | 2 |
| Marital status | ||
| Not Married | 168 | 86 |
| Married | 25 | 13 |
| Separated | 1 | 0.5 |
| Divorced | 1 | 0.5 |
| Clinical characteristics | ||
| Viral suppression | ||
| Virally suppressed | 175 | 90 |
| Not virally suppressed | 20 | 10 |
| Last Viral Load results duration (Years) | ||
| ≤1 | 76 | 39 |
| >1 | 119 | 61 |
| ART duration (Years) | ||
| 1–5 | 63 | 32 |
| 6–10 | 101 | 52 |
| 11–16 | 31 | 16 |
| Clinical WHO Stage | ||
| 1 | 148 | 76 |
| 2 | 44 | 23 |
| 3 | 3 | 2 |
| ART Regimen Line | ||
| First line | 168 | 86 |
| Second line | 27 | 14 |
| Regimen Type | ||
| DTG Based | 168 | 86 |
| NNRTI Based | 2 | 1 |
| PI Based | 25 | 13 |
| IPT Given | ||
| Yes | 167 | 86 |
| No | 28 | 14 |
| IPT Completion status (n=167) | ||
| Treatment completed | 153 | 92 |
| Discontinued | 2 | 1 |
| Missing data | 12 | 7 |
| TB Co-infection | ||
| No | 191 | 98 |
| Yes | 4 | 2 |
| Nutritional Status (BMI) (Kg/m2) | ||
| Normal Weight (18.5–24.9) | 103 | 53 |
| Obesity (≥30.0) | 5 | 3 |
| Overweight (25.0–29.9) | 12 | 6 |
| Underweight (<18.5) | 75 | 38 |
| CTX Prophylaxis | ||
| Yes | 195 | 100 |
| CD4 Counts Documented | ||
| No | 97 | 49.7 |
| Yes | 98 | 50.3 |
| Variable | Not Suppressed Frequency (%) | Virally Suppressed Frequency (%) | POR (95% CI) | P Value |
|---|---|---|---|---|
| Current ART Regimen Line | ||||
| Second Line | 8 (40) | 19 (10.8) | 5.47 (1.98–15.08) | 0.00035* |
| First Line | 12 (60) | 156 (89) | ref | |
| Current ART Regimen | ||||
| PI/NNRTI Based | 6 (30) | 21 (12) | 3.14 (1.08–9.06) | 0.027* |
| DTG Based | 14 (70) | 154 (88) | ref | |
| Sex | ||||
| Male | 11 (55) | 65 (37) | 2.06 (0.81–5.2) | 0.12 |
| Female | 9 (45) | 110 (63) | ref | |
| IPT | ||||
| Not given IPT | 5 (25) | 23 (13) | 2.2 (0.73–6.63) | 0.15 |
| Given IPT | 15 (75) | 152 (87) | ref | |
| WHO Stage | ||||
| Stage 3 | 1 (5) | 2 (1) | 4.55 (0.39–52.5) | 0.27 |
| Stage 1 & 2 | 19 (95) | 173 (99) | ref | |
| Age | ||||
| <20 Years | 12 (60) | 125 (71) | 0.6 (0.23–1.55) | 0.28 |
| ≥20 Years | 8 (40) | 50 (29) | ref | |
| Duration on ART in years | ||||
| >5 | 15 (75) | 117 (67) | 1.49 (0.51–4.2) | 0.46 |
| ≤5 | 5 (25) | 58 (33) | ref | |
| Body Mass Index (BMI) (Kg/m2) | ||||
| Under Weight | 9 (45) | 66 (37.7) | 1.35 (0.53–3.43) | 0.52 |
| Normal / Over Weight / Obesity | 11 (55) | 109 (62.3) | ref | |
| Marital Status | ||||
| Single/Divorced/Separated | 17 (85) | 153 (87) | 0.8 (0.22–3.0) | 0.75 |
| Married | 3 (15) | 22 (13) | ref |
*Statistically significant