
Research | Open Access | Volume 9 (3): Article 135 | Published: 12 Aug 2026

Views: 764
Menu, Tables and Figures
| Attribute | Definition | Indicator(s) Used | Data Source(s) | Method of Assessment |
|---|---|---|---|---|
| Data Quality | Completeness and validity of recorded data | Completeness of key variables (age, sex, onset date), consistency across data sources | SORMAS, DHIMS2, facility registers | Proportion of complete records; comparison across data sources |
| Timeliness | Speed between steps in the surveillance process | Proportion of reports submitted on time; turnaround time from specimen collection to lab results | SORMAS, DHIMS2, laboratory records | Time interval analysis; percentage meeting reporting timelines |
| Sensitivity | Ability of the system to detect cases/outbreaks | Number of outbreaks detected; consistency of case detection over time | Surveillance reports, outbreak records | Trend analysis; documentation of detected outbreaks |
| Predictive Value Positive (PVP) | Proportion of reported cases that are true cases | Number of laboratory-confirmed cases among suspected cases tested | Laboratory records, SORMAS | (Confirmed cases ÷ total tested) × 100 |
| Representativeness | Ability to accurately describe disease distribution by person, place, and time | Distribution of cases by sub-municipality, age, and sex compared to population distribution | SORMAS, population data | Comparative analysis of case vs population distribution |
| Simplicity | Ease of operation of the surveillance system | Ease of case definition use, data entry process, and workflow complexity | Stakeholder interviews, system observation | Thematic analysis of user experience and workflow |
| Acceptability | Willingness of individuals and organizations to participate | Reporting completeness, participation rates, and stakeholder satisfaction | SORMAS, stakeholder interviews | Analysis of reporting patterns and qualitative feedback |
| Flexibility | Ability to adapt to changing needs | Integration of SARS-CoV-2 surveillance, system modifications | System records, stakeholder interviews | Assessment of system adaptation without disruption |
| Stability | Reliability and availability of the system | System uptime, availability of staff, logistics, and supplies | Facility reports, stakeholder interviews | Review of system functionality and resource availability |
| Usefulness | Contribution to the prevention and control of health events | Outbreak detection; response actions; training; resource mobilization | Surveillance reports, program documents, and interviews | Documentation of actions informed by surveillance data |
Table 1: Measurement of Surveillance Attributes and Usefulness
| Year | Samples Tested | Prevalence per 10,000 | A(H1N1)pdm09 | AH3 | B/Victoria | Total Influenza Virus Isolated | % Influenza Virus PVP | Total SARS-CoV-2 Isolated | % SARS-CoV-2 PVP |
|---|---|---|---|---|---|---|---|---|---|
| 2024 | 142 | 33 | 0 | 9 | 4 | 13 | 9.2 | 4 | 2.8 |
| 2023 | 212 | 34 | 27 | 1 | 1 | 29 | 13.7 | 11 | 5.2 |
| 2022 | 201 | 23 | 0 | 30 | 11 | 41 | 20.4 | 1 | 0.5 |
| Total | 555 | 27 | 40 | 16 | 83 | 15 | 16 | 2.9 |
Table 2: Respiratory pathogens locally circulating influenza strains, coronaviruses, and other respiratory pathogens, Jasikan Municipal, 2022-2024
| Attribute | Key Indicator | Key Findings | Score (1–3) | Attribute Average Score | Interpretation |
|---|---|---|---|---|---|
| Timeliness | Weekly reporting | ≥99% reports submitted on time | 3 | 3 | Good |
| Monthly reporting | >94.4% completeness | 3 | |||
| Laboratory turnaround time | Results returned within 7 days | 3 | |||
| Acceptability | Reporting completeness | ≥95% reporting completeness | 3 | 3 | Good |
| Stakeholder participation | High participation and compliance | 3 | |||
| Flexibility | System adaptability | SARS-CoV-2 surveillance integrated into existing workflows without disruption | 3 | 3 | Good |
| Adaptability to system changes | Updates to case definitions, forms, and SORMAS implemented without affecting operations | 3 | |||
| Representativeness | Geographic distribution | 96.4% of cases originated from one sub-municipality | 2 | 2.7 | Good |
| Demographic distribution | Cases captured across all age groups and sexes | 3 | |||
| Temporal distribution | Seasonal trends observed | 3 | |||
| Simplicity | Case definition application | 90% reported ease in case identification | 3 | 2.7 | Good |
| Reporting process | 85% streamlined SORMAS reporting | 3 | |||
| Ease of system use | 81.0–100% reported ease of use | 2 | |||
| Sensitivity | % weeks ILI samples transported | 71.8% (inconsistent weekly sampling) | 2 | 2.7 | Good |
| % weekly ILI sampling target achieved | 80% (within expected threshold) | 3 | |||
| Outbreak detection | Three outbreaks detected | 3 | |||
| Stability | System continuity | Surveillance activities maintained without interruption throughout the evaluation period | 3 | 2.6 | Good |
| Availability of complete and timely data | 76.2% reported consistent availability | 2 | |||
| Availability of data collection tools | 90.5% reported no shortages | 3 | |||
| Availability of sample collection materials | 76.2% reported consistent availability | 2 | |||
| Power supply reliability | No reported power outages affecting surveillance operations | 3 | |||
| Functional refrigeration/cold chain | Rare instances of non-functional refrigerators | 3 | |||
| Sustainability of operations | Activities sustained through integration into routine services despite donor dependence | 3 | |||
| Data credit and transport support | Occasional shortages of data credit and delays in specimen transport reported | 2 | |||
| Data Quality | Completeness of core variables | >95% completeness (age, sex, onset date) | 3 | 2.3 | Moderate |
| Completeness of secondary variables | Lower completeness for address and reporting time | 2 | |||
| Data consistency | Minor discrepancies across SORMAS, DHIMS2, and registers | 2 | |||
| Predictive Value Positive (PVP) | Laboratory confirmation rate | Influenza: 15.0% (83/555); SARS-CoV-2: 2.9% (16/555) | |||
Table 3: Performance of the Respiratory Pathogen Surveillance System Attributes
John Sonnyinado Duako Baffoe1,2,&, George Adu Asumah2,3, Charles Noora Lwanga2, Mawuli Gohoho2,4, Thomas Vigbedor1,2, Beatrice Obeng Ampomah5, Isaac Annobil4, Delia Benewaa Bandoh2, Donne Kofi Ameme2, Joseph Asamoah Frimpong2, Mavis Borkai Osafo2, Alphonsus Nindow1, Ernest Kenu2
1Public Health Unit, Oti Regional Health Directorate, Ghana Health Service, Worawora, Ghana, 2Ghana Field Epidemiology and Laboratory Training Programme, School of Public Health, University of Ghana, Accra, Ghana, 3National Malaria Elimination Programme, Ghana Health Service, Accra, Ghana, 4Jasikan Municipal Health Directorate, Ghana Health Service, Jasikan, Ghana, 5Jasikan Municipal Hospital, Ghana Health Service, Jasikan, Ghana
&Corresponding author: John Sonnyinado Duako Baffoe, Public Health Unit, Oti Regional Health Directorate, Ghana Health Service, Worawora, Ghana, Email: sonnyinado@yahoo.com ORCID: https://orcid.org/0000-0002-4021-4172
Received: 27 Mar 2025, Accepted: 10 Aug 2026, Published: 12 Aug 2026
Domain: Infectious Disease Epidemiology
Keywords: Respiratory pathogens, surveillance system, sentinel, evaluation, Ghana
©John Sonnyinado Duako Baffoe et al. Journal of Interventional Epidemiology and Public Health (ISSN: 2664-2824). This is an Open Access article distributed under the terms of the Creative Commons Attribution International 4.0 License (https://creativecommons.org/licenses/by/4.0/), which permits unrestricted use, distribution, and reproduction in any medium, provided the original work is properly cited.
Cite this article: John Sonnyinado Duako Baffoe et al., Evaluation of respiratory pathogens sentinel surveillance system, Jasikan Municipality, Ghana, 2025. Journal of Interventional Epidemiology and Public Health. 2026; 9(3):135. https://doi.org/10.37432/jieph-d-26-00099
Introduction: Following the COVID-19 pandemic, Ghana expanded the Respiratory Pathogen Sentinel Surveillance (RPSS) system and incorporated SARS-CoV-2 testing into the existing influenza surveillance platform. However, the performance of the newly established sentinel site in Jasikan Municipality had not been formally evaluated. We assessed whether the system met its objectives, was useful, and its attributes to provide targeted recommendations.
Methods: We conducted a descriptive evaluation using the updated CDC guidelines for public health surveillance systems. Influenza-like illness (ILI) and severe acute respiratory infection (SARI) records from April 2022 to December 2024 were extracted from Surveillance Outbreak Response Management and Analysis System (SORMAS) and validated against case investigation forms and other records. Data collection included stakeholder interviews using semi-structured questionnaires, direct observation, and document review. Quantitative data were analysed descriptively, while qualitative data underwent deductive thematic analysis. Surveillance attributes were assessed using indicators scored from 1 to 3, with mean scores classified as weak (1.0–<1.8), moderate (1.8–<2.4), or good (≥2.4–3.0).
Results: A total of 555 suspected respiratory pathogen cases were reported, including 83 laboratory-confirmed influenza cases (15.0%) and 16 SARS-CoV-2 cases (2.9%). Three outbreak signals were detected during the period. Core variables were >95% complete, although completeness was lower for traceable address 389/555 (70.1%) and reporting time 362/555 (65.2%). Weekly reporting was timely on 154/156 (98.7%) of expected reporting weeks, and 93.7% of laboratory results were returned within 7 days. Samples were transported in 71.8% of expected weeks, while the weekly ILI sampling target was achieved in 80.0% of expected sampling weeks. Attribute scores were good for acceptability (3.0), flexibility (3.0), representativeness (2.7), simplicity (2.7), sensitivity (2.7) and stability (2.6), but moderate for data quality (2.3). The system supported three outbreak investigations and 12 public health actions.
Conclusion: The RPSS system in Jasikan Municipality met its objectives and is useful, with good performance in acceptability, flexibility, representativeness, simplicity, timeliness, sensitivity, and stability. However, moderate data quality, incomplete sample transportation coverage, and suboptimal achievement of sampling targets indicate areas requiring improvement to strengthen surveillance performance and ensure consistent case detection and laboratory confirmation.
Acute Respiratory Illnesses (ARIs), including Influenza-Like Illness (ILI) and Severe Acute Respiratory Infection (SARI), remain leading causes of morbidity and mortality worldwide, particularly in low- and middle-income countries (LMICs) [1,2]. These conditions range from mild upper respiratory tract infections to severe lower respiratory tract infections such as pneumonia, disproportionately affecting children under five years, older adults, and individuals with underlying comorbidities [3,4]. Globally, influenza-associated respiratory infections contribute to millions of hospitalizations and an estimated 290,000–650,000 deaths annually, with the greatest burden occurring in resource-limited settings [1,2]. Beyond respiratory outcomes, influenza and other respiratory pathogens are associated with complications such as cardiovascular events and exacerbation of chronic diseases, further amplifying their public health impact [5]. These patterns suggest the need for robust surveillance systems that can promptly detect and respond to respiratory disease threats.
Public health surveillance systems are crucial in monitoring disease trends, identifying circulating pathogens, detecting outbreaks, and guiding evidence-based interventions. Sentinel surveillance systems are widely implemented for respiratory pathogens due to their cost-effectiveness and operational feasibility, particularly in low- and middle-income countries (LMICs) where comprehensive population-based surveillance is often not feasible. However, evaluations across multiple settings have consistently identified performance gaps. While sentinel systems frequently demonstrate strengths in timeliness, simplicity, and data quality, challenges remain in sensitivity, representativeness, and translating surveillance data into public health action [6,7]. In addition, the integration of emerging pathogens such as SARS-CoV-2 into existing surveillance platforms has highlighted both the adaptability and limitations of these systems, particularly in resource-constrained environments [3]. These findings emphasize the importance of periodic evaluation using standardized frameworks, such as the Centres for Disease Control and Prevention (CDC) guidelines, to ensure that surveillance systems remain effective and responsive.
In Ghana, respiratory pathogen surveillance is conducted through sentinel systems integrated within the Integrated Disease Surveillance and Response (IDSR) framework. Previous evaluations have shown that while these systems can identify circulating influenza strains and support laboratory confirmation, they face important operational challenges. For example, an evaluation in the Greater Accra Region reported suboptimal case detection, incomplete reporting, and limitations in achieving surveillance objectives despite overall system functionality [8]. Similar findings have been reported in other African settings, where sentinel surveillance systems demonstrate strong operational performance but limited geographic representativeness and uneven data utilization for decision-making [7,9,10]. These gaps suggest that existing surveillance systems may not fully capture the true burden and distribution of respiratory pathogens or consistently inform timely public health action.
In response to the need for strengthened respiratory surveillance, the respiratory pathogens sentinel surveillance system (RPSS) was established in April 2022 in Jasikan Municipality, Ghana. The system was designed to monitor circulating respiratory pathogens, detect outbreaks early, and support preparedness and response activities. Despite its strategic importance, the system has not undergone a comprehensive evaluation since its implementation. Preliminary observations have raised concerns regarding sensitivity, data quality, and geographic representativeness, which may limit its effectiveness in generating actionable information. Given the critical role of surveillance systems in disease control and the documented challenges in similar settings, a systematic evaluation is warranted. We assessed whether the RPSS is meeting its stated objectives, evaluated its performance across key surveillance attributes in line with CDC guidelines, and determined its usefulness for informing public health action in Jasikan Municipality.
Evaluation design and framework
A descriptive evaluation of the RPSS in Jasikan Municipality was conducted from April 2022 to December 2024 using the updated CDC guidelines for evaluating public health surveillance systems. The evaluation followed the CDC six-step framework, including stakeholder engagement, system description, evaluation design, evidence gathering, interpretation of findings, and ensuring use of results.
Stakeholder engagement and evaluation focus
Key stakeholders involved in the surveillance system, including municipal and regional health officers, surveillance officers, clinicians, laboratory personnel, and health information officers, were identified and engaged throughout the evaluation. The evaluation was designed to assess system performance and inform improvements in surveillance effectiveness and responsiveness.
Study setting
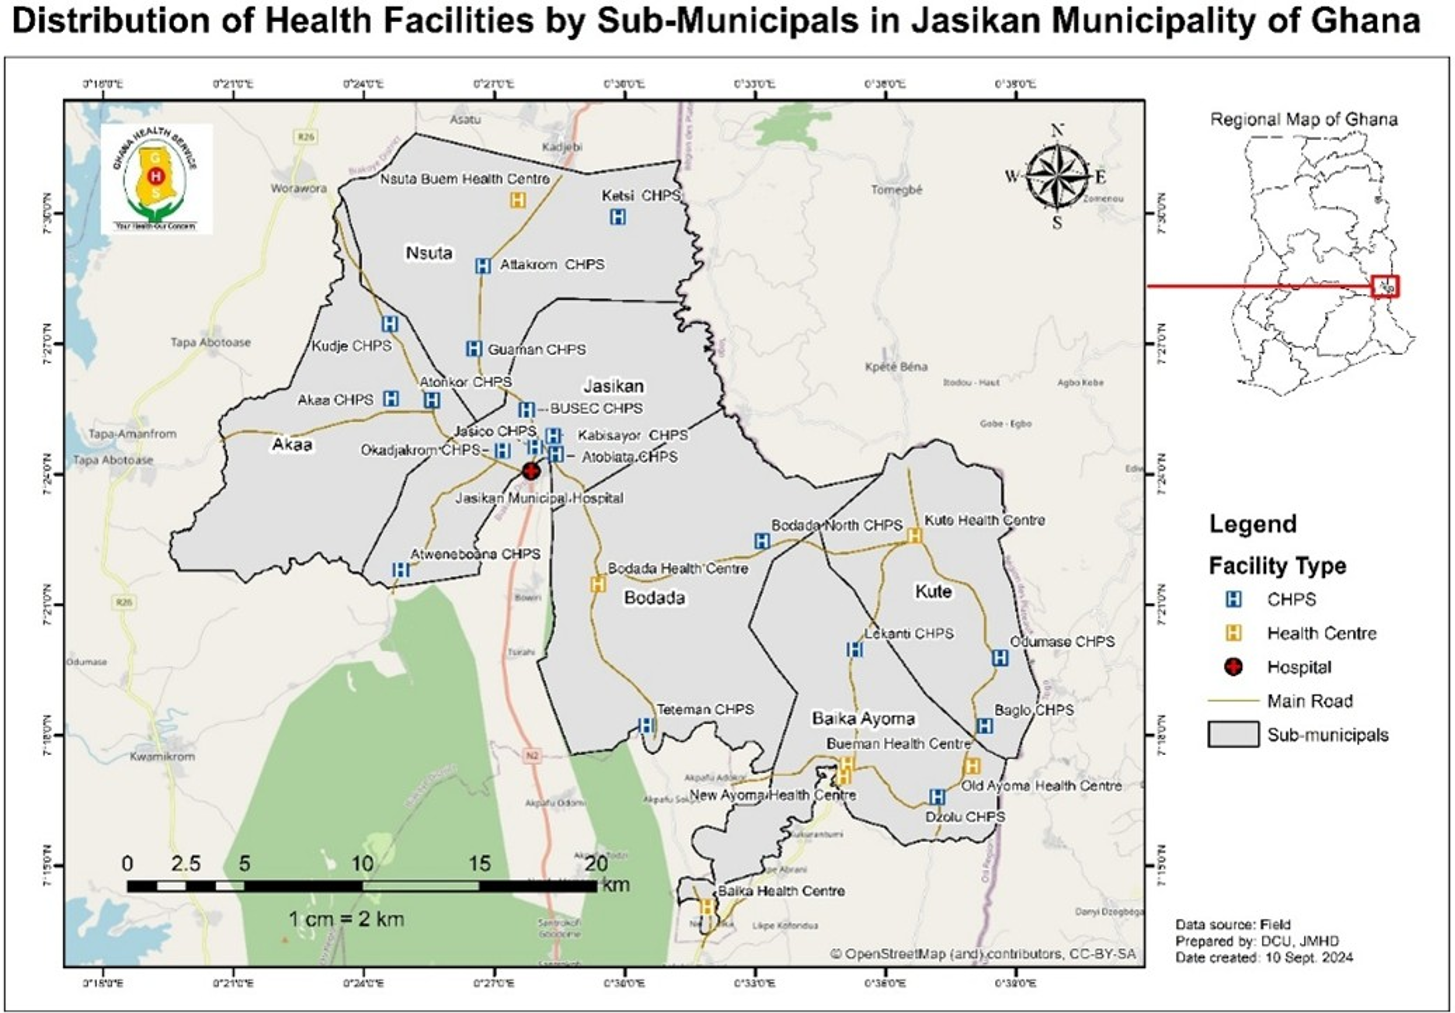
The evaluation was conducted in Jasikan Municipality, located in the Oti Region of Ghana, with an estimated population of approximately 64,870. The municipality is administratively divided into six sub-municipalities and served by a network of health facilities, including one municipal hospital, health centres, and Community-based Health Planning and Services (CHPS) compounds. The municipality’s geographic features, cross-border population movement, and institutional settings contribute to the transmission dynamics of respiratory pathogens [11,12].
Data sources and study population
The evaluation included all suspected cases of ILI and SARI recorded in the RPSS in Jasikan Municipality from April 2022 to December 2024. Case-based data were obtained from the Surveillance Outbreak Response Management and Analysis System (SORMAS), which serves as the primary electronic surveillance platform.
To ensure completeness and enable data triangulation, additional data sources were reviewed, including aggregated reports from the District Health Information Management System 2 (DHIMS2), facility-level ILI and SARI registers, laboratory testing records from the National Influenza Centre (NIC), and routine surveillance reports. Programmatic documents, including training records, feedback reports, outbreak investigation reports, and annual reports, were also examined to assess system functionality and usefulness.
The study population comprised all individuals meeting the standard case definitions for ILI and SARI who were enrolled in the surveillance system during the evaluation period. In addition, qualitative data were obtained from key stakeholders involved in the implementation and management of the surveillance system. These included clinicians, disease surveillance officers, laboratory personnel, health information officers, and district health management staff.
Description of the surveillance system
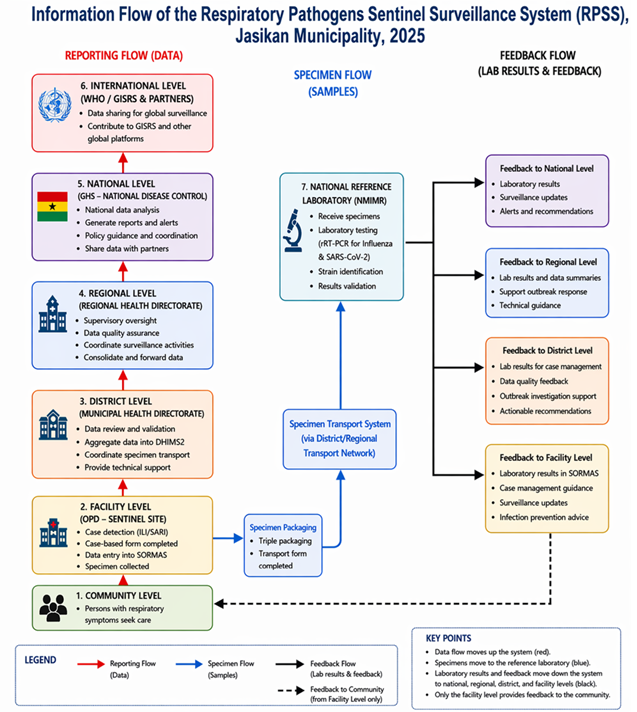
The RPSS in Jasikan Municipality is a facility-based sentinel surveillance system established in April 2022 to monitor circulating respiratory pathogens, including influenza viruses and SARS-CoV-2, and to support early detection of outbreaks and public health response. The system operates within Ghana’s IDSR framework and is supported by the National RPSS Programme. Surveillance activities are conducted at the Jasikan Municipal Hospital as the sentinel site, and other facilities are non-sentinel sites within the Municipality. Patients presenting at outpatient and inpatient departments are screened using standardized case definitions for ILI and SARI. Eligible cases are enrolled, and case-based data are captured electronically through SORMAS. Respiratory specimens (including nasopharyngeal and/or oropharyngeal swabs) are collected from enrolled cases and transported under appropriate reverse cold chain conditions to the NIC at the Noguchi Memorial Institute for Medical Research (NMIMR) for laboratory confirmation using reverse transcriptase polymerase chain reaction (rRT-PCR). Laboratory results are communicated electronically through SORMAS to inform case management and public health action. Surveillance data are aggregated and reported through the DHIMS2. Data flow follows a hierarchical structure from the facility level to district, regional, and national levels, with feedback mechanisms in place to support surveillance performance and decision-making [13,14].
Sampling approach
A purposive sampling approach was used to select stakeholders with direct involvement in surveillance system implementation, including case detection, reporting, laboratory testing, and decision-making. A total of 20 key informants were interviewed, with sampling guided by the principle of data saturation.
Case definition
Suspected case definition
Probable case definition
A probable case is a suspected case, either alive or dead, with an epidemiological link to a confirmed case or a dead case of influenza.
Confirmed case definition
A confirmed case of respiratory illness is a case that meets the suspected case definition for ILI/ARI/SARI and is confirmed positive for influenza, coronaviruses, human respiratory syncytial virus, or other respiratory pathogens by the laboratory [7,14–16].
Data analysis
The analysis was conducted in accordance with the updated CDC guidelines for evaluating public health surveillance systems, which recommend the use of descriptive epidemiological methods and triangulation of multiple data sources to assess system performance [3,6,17]. Quantitative data were analyzed using descriptive statistics, including frequencies, proportions, and temporal trends. Age was categorized into ≤4, 5–14, 15–24, 25–34, 35–44, 45–54, 55–64, and ≥65 years to facilitate age-specific analysis [7,8].
Quantitative surveillance attributes were assessed using predefined indicators. Data quality was assessed based on completeness and consistency of key variables across data sources. Timeliness was evaluated as the proportion of reports submitted within recommended timelines and the turnaround time from specimen collection to laboratory confirmation. Predictive value positive (PVP) was calculated as the proportion of laboratory-confirmed cases among all suspected cases tested. Sensitivity was assessed using proxy indicators, including the system’s ability to detect outbreaks and consistency of case detection over time, given the absence of a gold standard for total case ascertainment. Representativeness was evaluated by comparing the distribution of reported cases across sub-municipalities with their underlying population distribution, as well as by examining demographic and temporal patterns.
Qualitative data obtained from stakeholder interviews, system observations, and document reviews were analyzed using a deductive thematic approach guided by the CDC surveillance evaluation framework. Data were reviewed manually and organized according to predefined surveillance attributes, including simplicity, acceptability, flexibility, stability, and usefulness. Information from the different data sources was coded and summarized under these themes. Findings from interviews were compared with observations and documentary evidence to assess consistency and identify areas of convergence or divergence. Any discrepancies were resolved through discussion among the evaluation team and verification against surveillance records and supporting documents. The qualitative findings were subsequently triangulated with quantitative results to provide a comprehensive assessment of system performance. A structured scoring approach was applied to summarize performance across surveillance attributes. Surveillance attributes were assessed using indicators scored from 1 to 3, with mean scores classified as weak (<60%, 1.0–<1.8), moderate (60–79%, 1.8–<2.4), or good (≥80%, ≥2.4–3.0), consistent with approaches used in similar surveillance system evaluations in low- and middle-income settings [3,6,7,17,18]. Attribute-level scores were calculated as the mean of individual indicator scores, and overall system performance was derived as the mean of all attribute scores.
The usefulness of the surveillance system was assessed by documenting instances where surveillance data informed public health action, including outbreak detection, response activities, training, health education, and resource mobilization, in line with CDC criteria for evaluating surveillance utility [17]. Findings from quantitative and qualitative analyses were triangulated to enhance validity and provide a comprehensive assessment. All results were summarized and presented using tables, figures, and narrative descriptions (Table 1).
Declaration on the use of artificial intelligence (AI) tools
AI tools were used solely to enhance language clarity, grammar, and formatting of this manuscript. These tools did not contribute to the study design, data collection, data analysis, interpretation of findings, or conclusions. All intellectual content and scientific decisions presented in this work are the original contributions of the authors, who take full responsibility for their accuracy and integrity.
Ethical considerations
This evaluation used routinely collected surveillance data from the RPSS. Administrative approval was obtained from the Municipal and Regional Health Directorates. The evaluation was conducted in accordance with the Public Health Act, 2012 (Act 851), which permits the use of surveillance data for public health purposes. No personal identifiers were included, and data were anonymized, stored securely on a password protected laptop, and accessed only by the evaluation team. Written informed consent was obtained from all participants in the qualitative component, and participation was voluntary.
Surveillance system outputs
A total of 555 suspected respiratory pathogen cases were recorded in Jasikan Municipality from April 2022 to December 2024. Of these, 328 (59.1%) were female. The ages ranged from 1 month to 93 years, with a median age of 26 years. Laboratory testing identified 83 influenza cases (15.0%) and 16 SARS-CoV-2 cases (2.9%). Influenza positivity declined from 20.4% (2022) to 13.7% (2023) and 9.2% (2024), while SARS-CoV-2 increased from 0.5% (2022) to 5.2% (2023) before declining to 2.8% (2024). Among the positive influenza cases (n = 83), the strains detected include A(H3) 40 (48.2%), A(H1N1)pdm09 27 (32.5%), and B/Victoria 16 (19.3%). Dominant strains shifted from A(H3) and B/Victoria in 2022 to A(H1N1)pdm09 in 2023, with reduced activity in 2024 mainly comprising A(H3) and B/Victoria. Annual cases reported were 201 (2022), 212 (2023), and 142 (2024), with peaks during rainy seasons (Table 2).
Performance of the surveillance system
Data quality and completeness
Completeness of core variables shows that age was recorded in 548 (98.7%) records, sex in 555 (100%), date of onset in 532 (95.9%), and clinical classification in 540 (97.3%). Consistency checks across SORMAS, DHIMS2, and facility registers showed high agreement in reported case counts, with discrepancies observed in less than 5% of records. Traceable address was recorded in 389 (70.1%) of cases, while time of reporting was documented in 362 (65.2%) of records. (Table 3).
Timeliness
Weekly reporting was timely in 154/156 (98.7%) of expected reporting weeks. Monthly reporting completeness showed that 34/36 (94.4%) reports were submitted within the required timelines. Laboratory turnaround time from specimen collection to dissemination of results was within 7 days for 520/555 (93.7%) of samples tested (Table 3).
Sensitivity
The system detected three outbreak signals during the evaluation period: A(H1N1)pdm09 in epidemiological week 3 of 2023, A(H3) in week 22 of 2023, and SARS-CoV-2 in week 31 of 2024. Overall, samples were transported in 71.8% of the expected weeks during the evaluation period, based on a 52-week annual denominator. The annual ILI sampling target, based on a minimum of five samples transported per week, was achieved at 80.0% overall. Disaggregated by year, weekly sample transportation was 100.0% in 2022, 55.8% in 2023, and 59.3% in 2024. Annual ILI sampling target achievement was 111.7% in 2022, 76.0% in 2023, and 52.3% in 2024 (Table 3).
Predictive value positive (PVP)
The PVP for influenza was 83/555 (15.0%), while the PVP for SARS-CoV-2 was 16/555 (2.9%). Influenza PVP declined from 20.4% in 2022 to 13.7% in 2023 and 9.2% in 2024. In contrast, SARS-CoV-2 PVP rose from 0.5% in 2022 and peaked at 5.2% in 2023 before declining to 2.8% in 2024 (Table 2 and Table 3).
Representativeness
Representativeness had a mean score of 2.7. The system described cases by person and time, capturing all age groups, both sexes, and seasonal trends. Geographically, 96.4% of reported cases originated from the sentinel sub-municipality (Table 3).
Simplicity
The system involved case detection, case-based form completion, SORMAS data entry, specimen collection at the facility level, and reporting through the district, regional, and national levels, with feedback following the same reporting pathway (Figure 2). Standardized case definitions for ILI and SARI were used. Eighteen of 20 (90%) respondents reported that case identification was easy or very easy, 20/20 (100%) reported that completing case-based forms was easy, and 17/20 (85%) reported that SORMAS data entry was easy. The average time from case identification to specimen packaging was approximately 90 minutes. Nineteen of 20 (95%) respondents reported that the system was integrated despite the use of multiple reporting platforms. Some respondents also reported challenges with form completion and understanding of the case definitions (Table 3).
Acceptability
The proportion of suspected cases entered into SORMAS was 100%, and weekly and monthly reporting rates exceeded 95% throughout the evaluation period. Most respondents indicated willingness to continue participating in the surveillance system and reported positive perceptions of its operation and relevance to public health practice. Acceptability had a mean score of 3.0 (Table 3).
Flexibility
The flexibility attribute had a mean score of 3.0. The system used standardized case definitions and updated case-based forms during the evaluation period. Integration of SARS-CoV-2 surveillance was implemented using existing platforms and workflows, including SORMAS, with 19/20 (95%) respondents reporting this capability. The system also accommodated updates to the SORMAS platform without interruption to reporting processes. Routine activities, including case detection, reporting, and specimen handling, continued throughout the evaluation period (Table 3).
Stability
The RPSS had a mean score of 2.6 (86.7%). All facilities had designated surveillance staff responsible for surveillance activities. Sixteen of 20 (80.0%) respondents reported consistent availability of complete and timely data. Nineteen of 20 (95.0%) reported no shortages of data collection tools, while 16/20 (80.0%) indicated consistent availability of sample collection materials; 3/20 (15.0%) reported occasional shortages. No power failures were reported, and instances of non-functional refrigerators were rare. Reliance on donor support was reported, with activities integrated into routine surveillance. Some respondents reported occasional shortages of data credit and delays in sample transport (Table 3).
Usefulness
The RPSS was used for public health decision-making during the evaluation period. Surveillance data were used to monitor trends in respiratory pathogens, identify circulating influenza viruses and SARS-CoV-2, and detect outbreaks. Three outbreaks were identified, triggering investigation and response activities. The document reviewed showed that surveillance output supported at least 12 public health actions, including five health education activities and four training sessions for health personnel, as well as outbreak responses. Routine surveillance reports (weekly, monthly, half-yearly, and annual) were produced and shared with stakeholders for planning and resource mobilization. Laboratory results were used for pathogen identification and reporting within the health system.
This evaluation assessed the performance, key attributes, and usefulness of the RPSS in Jasikan Municipality using CDC-recommended surveillance evaluation guidelines. Overall, the system demonstrated satisfactory performance, with good performance observed in timeliness, simplicity, acceptability, stability, sensitivity, flexibility, and representativeness, while moderate performance was observed in data quality. These findings indicate that the system is operationally robust and capable of supporting public health action, although important gaps remain that may affect its ability to fully capture the burden and geographic distribution of respiratory infections.
The completeness of key variables exceeding 95% and reporting rates consistently above 95%. Laboratory turnaround time was within the recommended threshold of 7 days. These findings are consistent with previous evaluations of surveillance systems in sub-Saharan Africa, where integration into routine health services and use of electronic reporting platforms have contributed to improved data completeness and timeliness [6,9,10]. High-quality and timely data are essential for effective surveillance, as they enable early detection of outbreaks and timely implementation of control measures [17].
Overall, the sensitivity of the RPSS was good. The system detected three outbreak signals during the evaluation period and achieved 80.0% of the expected weekly ILI sampling target. However, respiratory specimens were transported in only 71.8% of the expected weeks, indicating gaps in consistent sampling and specimen submission. These gaps may have resulted in missed cases during periods when samples were not collected or transported. This finding is consistent with the design of sentinel surveillance systems, which are intended to monitor trends and detect outbreaks rather than achieve complete case ascertainment [3,7]. Similar observations have been reported in influenza surveillance systems in Zambia and other African countries, where outbreak detection was achieved despite incomplete coverage [7]. Improving adherence to case definitions and expanding surveillance coverage could enhance case detection.
The relatively low PVP (15.0%) may be partly attributable to the broad syndromic case definition used by the RPSS, which prioritizes sensitivity and may result in lower specificity [19]. Comparable findings have been reported in other LMICs, where laboratory confirmation rates among suspected cases vary depending on case definition and testing capacity [6].
Representativeness of the RPSS was good overall, reflecting its ability to capture cases across all age groups and both sexes and to describe temporal trends in respiratory pathogen occurrence. However, geographic representativeness was limited, with almost all cases originating from the sentinel sub-municipality where the surveillance site is located. Although this area accounts for a substantial proportion of the municipal population, the concentration of reported cases suggests underrepresentation of peripheral sub-municipalities, likely due to differences in healthcare access and proximity to the sentinel site. This limitation is inherent in sentinel surveillance systems, which are designed to monitor disease trends rather than provide complete geographic coverage of a population [7]. Nevertheless, the system adequately characterized the distribution of respiratory pathogens by person and time within the municipality. Simplicity was achieved using standardized case definitions and integration into routine workflows. Acceptability was reflected in high reporting completeness and consistent participation of surveillance staff. Stability was demonstrated by uninterrupted system operation, and flexibility was evidenced by the successful integration of SARS-CoV-2 surveillance without disruption. The PVP was low, with 15.0% of suspected cases confirmed as influenza and 2.9% as SARS-CoV-2. These findings are consistent with other evaluations showing that integration of surveillance systems into routine health services enhances sustainability and adaptability [3,19].
Importantly, the RPSS was useful for public health action. The system detected three outbreaks and supported outbreak investigations and response activities. In addition, surveillance data informed five health education activities, four training sessions, and resource mobilization, including procurement of logistics and operational support. These findings demonstrate a clear linkage between surveillance outputs and public health interventions, which is a key criterion for usefulness in surveillance system evaluation [17]. This evaluation had several strengths. It utilized multiple data sources, including surveillance databases, laboratory records, and stakeholder interviews, allowing for triangulation of findings. The application of CDC evaluation guidelines ensured a systematic and standardized assessment.
Limitations
This evaluation has some limitations. First, the analysis relied on routinely collected surveillance data, which may be subject to information bias due to incomplete or inaccurate recording of some variables, particularly traceable address and time of reporting. Second, sensitivity could not be directly quantified because a gold standard for total case ascertainment was not available; therefore, sensitivity was inferred using proxy indicators such as outbreak detection and temporal trends, which may underestimate or overestimate true system performance. Third, the sentinel design of the surveillance system introduces selection bias, as most cases were captured from a single facility located in the Jasikan sub-municipality. Consequently, the findings may not be fully generalizable to the entire municipality or similar settings without sentinel coverage. Finally, the assessment of qualitative attributes, including simplicity, acceptability, flexibility, and stability, was based on stakeholder perceptions and system observations, which may be subject to respondent bias. However, triangulation of multiple data sources was used to enhance the validity of the findings.
The respiratory pathogens sentinel surveillance system in Jasikan Municipality met its objectives of monitoring circulating respiratory pathogens, detecting outbreaks, and providing information for public health action. The system performed well in timeliness, simplicity, acceptability, flexibility, stability, and representativeness, while data quality was moderate. The system detected influenza and SARS-CoV-2, identified changes in circulating influenza strains, detected three outbreak signals, and generated information that supported outbreak investigation, health education, training, resource mobilization, and routine public health decision-making. However, inconsistent weekly sampling and specimen submission reduced sensitivity, while the concentration of reported cases at the sentinel site limited geographic representativeness.
Recommendations
Public health actions
Public health actions implemented during the surveillance system evaluation included orientation of sentinel site staff on descriptive data analysis to improve interpretation and use of surveillance data. Stakeholder engagements were held with the Jasikan Municipal Health Directorate (JMHD), Municipal Health Management Team, and Oti Regional Health Directorate (ORHD) surveillance team, led by the Deputy Director of Public Health (DDPH), to review findings and identify improvement strategies. In addition, healthcare workers were oriented on improved case detection for ILI and SARI. Clinical team meetings were also conducted to identify gaps and strengthen surveillance sensitivity.
What is already known about the topic
What this study adds
The authors of this work declare no competing interests. Delia Benewaa Bandoh is an Associate Editor at the Journal of Interventional Epidemiology and Public Health (JIEPH) and a co-author of this manuscript. In line with the journal’s conflict of interest policy, she was fully recused from the peer review process and had no involvement in editorial handling or decision-making for this submission. An independent editor oversaw the review and decision-making process.
The authors acknowledge the Pandemic Fund and the World Health Organization (WHO) Ghana for technical and logistical support. Appreciation is extended to the Oti Regional Health Directorate, the Ghana Field Epidemiology and Laboratory Training Programme (GFELTP), and the University of Ghana School of Public Health, Legon–Accra, for their institutional support. Gratitude is also expressed to the Jasikan Municipal Health Directorate and Jasikan Municipal Hospital, Ghana Health Service, for their collaboration and assistance during the study. Special recognition goes to the study mentor for guidance and technical input throughout the work. The authors also acknowledge the National Influenza Centre team for their laboratory and technical support.
JSDB conceived and designed the study, coordinated data collection, performed data analysis and interpretation, and drafted the manuscript. GAA, CNL, and EK contributed to the study design, supervised the work, and critically reviewed the manuscript for intellectual content. MG, TV, BOA, and IA participated in data collection, validation, and interpretation of findings. MG, DBB, DA, JAF, MBO, and AN provided technical guidance, contributed to the interpretation of results, and critically reviewed the manuscript. All authors read and approved the final manuscript and agreed to be accountable for all aspects of the work.
| Attribute | Definition | Indicator(s) Used | Data Source(s) | Method of Assessment |
|---|---|---|---|---|
| Data Quality | Completeness and validity of recorded data | Completeness of key variables (age, sex, onset date), consistency across data sources | SORMAS, DHIMS2, facility registers | Proportion of complete records; comparison across data sources |
| Timeliness | Speed between steps in the surveillance process | Proportion of reports submitted on time; turnaround time from specimen collection to lab results | SORMAS, DHIMS2, laboratory records | Time interval analysis; percentage meeting reporting timelines |
| Sensitivity | Ability of the system to detect cases/outbreaks | Number of outbreaks detected; consistency of case detection over time | Surveillance reports, outbreak records | Trend analysis; documentation of detected outbreaks |
| Predictive Value Positive (PVP) | Proportion of reported cases that are true cases | Number of laboratory-confirmed cases among suspected cases tested | Laboratory records, SORMAS | (Confirmed cases ÷ total tested) × 100 |
| Representativeness | Ability to accurately describe disease distribution by person, place, and time | Distribution of cases by sub-municipality, age, and sex compared to population distribution | SORMAS, population data | Comparative analysis of case vs population distribution |
| Simplicity | Ease of operation of the surveillance system | Ease of case definition use, data entry process, and workflow complexity | Stakeholder interviews, system observation | Thematic analysis of user experience and workflow |
| Acceptability | Willingness of individuals and organizations to participate | Reporting completeness, participation rates, and stakeholder satisfaction | SORMAS, stakeholder interviews | Analysis of reporting patterns and qualitative feedback |
| Flexibility | Ability to adapt to changing needs | Integration of SARS-CoV-2 surveillance, system modifications | System records, stakeholder interviews | Assessment of system adaptation without disruption |
| Stability | Reliability and availability of the system | System uptime, availability of staff, logistics, and supplies | Facility reports, stakeholder interviews | Review of system functionality and resource availability |
| Usefulness | Contribution to the prevention and control of health events | Outbreak detection; response actions; training; resource mobilization | Surveillance reports, program documents, and interviews | Documentation of actions informed by surveillance data |
| Year | Samples Tested | Prevalence per 10,000 | A(H1N1)pdm09 | AH3 | B/Victoria | Total Influenza Virus Isolated | % Influenza Virus PVP | Total SARS-CoV-2 Isolated | % SARS-CoV-2 PVP |
|---|---|---|---|---|---|---|---|---|---|
| 2024 | 142 | 33 | 0 | 9 | 4 | 13 | 9.2 | 4 | 2.8 |
| 2023 | 212 | 34 | 27 | 1 | 1 | 29 | 13.7 | 11 | 5.2 |
| 2022 | 201 | 23 | 0 | 30 | 11 | 41 | 20.4 | 1 | 0.5 |
| Total | 555 | 27 | 40 | 16 | 83 | 15 | 16 | 2.9 |
| Attribute | Key Indicator | Key Findings | Score (1–3) | Attribute Average Score | Interpretation |
|---|---|---|---|---|---|
| Timeliness | Weekly reporting | ≥99% reports submitted on time | 3 | 3 | Good |
| Monthly reporting | >94.4% completeness | 3 | |||
| Laboratory turnaround time | Results returned within 7 days | 3 | |||
| Acceptability | Reporting completeness | ≥95% reporting completeness | 3 | 3 | Good |
| Stakeholder participation | High participation and compliance | 3 | |||
| Flexibility | System adaptability | SARS-CoV-2 surveillance integrated into existing workflows without disruption | 3 | 3 | Good |
| Adaptability to system changes | Updates to case definitions, forms, and SORMAS implemented without affecting operations | 3 | |||
| Representativeness | Geographic distribution | 96.4% of cases originated from one sub-municipality | 2 | 2.7 | Good |
| Demographic distribution | Cases captured across all age groups and sexes | 3 | |||
| Temporal distribution | Seasonal trends observed | 3 | |||
| Simplicity | Case definition application | 90% reported ease in case identification | 3 | 2.7 | Good |
| Reporting process | 85% streamlined SORMAS reporting | 3 | |||
| Ease of system use | 81.0–100% reported ease of use | 2 | |||
| Sensitivity | % weeks ILI samples transported | 71.8% (inconsistent weekly sampling) | 2 | 2.7 | Good |
| % weekly ILI sampling target achieved | 80% (within expected threshold) | 3 | |||
| Outbreak detection | Three outbreaks detected | 3 | |||
| Stability | System continuity | Surveillance activities maintained without interruption throughout the evaluation period | 3 | 2.6 | Good |
| Availability of complete and timely data | 76.2% reported consistent availability | 2 | |||
| Availability of data collection tools | 90.5% reported no shortages | 3 | |||
| Availability of sample collection materials | 76.2% reported consistent availability | 2 | |||
| Power supply reliability | No reported power outages affecting surveillance operations | 3 | |||
| Functional refrigeration/cold chain | Rare instances of non-functional refrigerators | 3 | |||
| Sustainability of operations | Activities sustained through integration into routine services despite donor dependence | 3 | |||
| Data credit and transport support | Occasional shortages of data credit and delays in specimen transport reported | 2 | |||
| Data Quality | Completeness of core variables | >95% completeness (age, sex, onset date) | 3 | 2.3 | Moderate |
| Completeness of secondary variables | Lower completeness for address and reporting time | 2 | |||
| Data consistency | Minor discrepancies across SORMAS, DHIMS2, and registers | 2 | |||
| Predictive Value Positive (PVP) | Laboratory confirmation rate | Influenza: 15.0% (83/555); SARS-CoV-2: 2.9% (16/555) | |||