
Research | Open Access | Volume 9 (4): Article 164 | Published: 16 Oct 2026

Views: 1,098
Menu, Tables and Figures
| Table 1: Demographic characteristics of ISSS cases in Kenya, 2021–2022 | |||
|---|---|---|---|
| Characteristic | Type of case definition | ||
| Age group (Years) | ILI (n=899) | SARI (n=6639) | Total (N=7538) |
| n (%) | n (%) | n (%) | |
| 0 to <2 | 309 (34.4) | 4755 (71.5) | 5064 (67.2) |
| 2 to <5 | 248 (27.6) | 1274 (19.2) | 1522 (20.2) |
| 5 to <15 | 140 (15.6) | 353 (5.3) | 493 (6.5) |
| 15 to <50 | 166 (18.5) | 150 (2.3) | 316 (4.2) |
| 50 to <65 | 24 (2.7) | 48 (0.7) | 72 (0.9) |
| ≥65 | 12 (1.2) | 58 (0.9) | 70 (0.9) |
| Missing | 0 (0) | 1 (0.0) | 1 (0.0) |
| Median (IQR) | 9.9 (1.3-11.2) | 1.6 (0.5-2.1) | 2.0 (0.6-2.6) |
| Sex | |||
| Female | 385 (42.8) | 2846 (42.9) | 3231 (42.9) |
| Male | 514 (57.2) | 3793 (57.1) | 4307 (57.1) |
| Sentinel site | |||
| Dadaab | 32 (3.6) | 459 (6.9) | 491 (6.5) |
| Kakamega | 16 (1.8) | 232 (3.5) | 248 (3.3) |
| Kakuma | 248 (27.7) | 2414 (36.3) | 2662 (35.3) |
| KNH | 12 (1.3) | 1258 (18.9) | 1270 (16.8) |
| Marsabit | 281 (31.4) | 147 (2.2) | 428 (5.7) |
| Mombasa | 30 (3.3) | 527 (7.9) | 557 (7.4) |
| Nakuru | 8 (0.9) | 1107 (16.7) | 1115 (14.8) |
| Nyeri | 269 (30) | 498 (7.5) | 767 (10.2) |
| Influenza Virus Results (rRT-PCR) | |||
| Influenza Positive | 163 (18.1) | 835 (12.6) | 998 (13.2) |
| Influenza A Detected | 110 (67.5) | 600 (71.9) | 710 (71.1) |
| A/H1N1 | 52 (47.3) | 374 (62.3) | 426 (60.0) |
| A/H3N2 | 57 (51.8) | 217 (36.2) | 274 (38.6) |
| A(Unclassified) | 1 (0.9) | 9 (1.5) | 10 (1.0) |
| Influenza B Detected | 55 (33.7) | 247 (29.6) | 302 (30.3) |
| B/Victoria | 20 (36.7) | 52 (21.1) | 72 (23.8) |
| B(Unclassified) | 35 (63.6) | 195 (78.9) | 230 (76.2) |
| Influenza A & B | 2 (1.2) | 12 (1.4) | 14 (1.4) |
| Turn-Around-Time (TAT) | |||
| ≤ 7 Days | 571 (63.5) | 4880 (73.5) | 5,451 (72.3) |
| >7 Days | 151 (16.8) | 1182 (17.8) | 1333 (17.7) |
| Missing date | 177 (19.7) | 577 (8.7) | 754 (10.0) |
Table 1: Demographic characteristics of ISSS cases in Kenya, 2021–2022
| Attribute | Number of evaluated indicators | Mean score | Performance {1-weak, 2-moderate, 3-Good} |
|---|---|---|---|
| Simplicity | 10 | 2.7 | Moderate to good |
| Timeliness | 5 | 2.6 | Moderate to good |
| Acceptability | 6 | 2.7 | Moderate to good |
| Flexibility | 3 | 2.7 | Moderate to good |
| Data quality and completeness | 4 | 2.8 | Moderate to good |
| Stability | 4 | 2.9 | Moderate to good |
| Representativeness | 2 | 2 | Moderate |
| Usefulness | 6 | 2.8 | Moderate to good |
| Positive predictive value | 1 | 1 | weak |
| Overall | 36 | 2.5 | Moderate to good |
Table 2: Mean indicators’ scores (range 1-3) for each attribute used for the evaluation of the influenza sentinel surveillance system in Kenya, 2021–2022
| Table 3: Description of the surveillance system attributes performance. | ||||
|---|---|---|---|---|
| Attribute | Calculation/Data inputs | Data source | Indicator score | Attribute mean score 1(Weak performance) 2(Moderate performance) 3(Good performance) |
| Qualitative Attributes | ||||
| Usefulness | ||||
| The proportion of surveillance staff aware of the influenza system objectives | No. of surveillance staff in each category/Number of staff interviewed No. of surveillance staff in each category/Number of staff interviewed | Questionnaire survey among surveillance staff at the KNH sentinel site and NIC lab staff | 3 | 2.8 |
| Perception of surveillance staff on whether the program has informed decision-makers in policy-making | No. of surveillance staff in each category/Number of staff interviewed | 2.8 | ||
| Perception of surveillance staff on whether the influenza data has stimulated research opportunities | No. of surveillance staff in each category/Number of staff interviewed | NIC data focal person | 2.6 | |
| Perception of surveillance staff on whether the influenza data provides insights into the disease burden | No. of surveillance staff in each category/Number of staff interviewed | 2.6 | ||
| Perception of surveillance staff on whether the ISSS has helped in identifying previously undetected or missed cases of influenza | No. of weekly bulletin/Number of total weeks | 3 | ||
| Availability of influenza weekly bulletins for the period under review | 3 | |||
| Simplicity | ||||
| Perception of surveillance staff on identification of cases | No. of surveillance staff in each category/Number of staff interviewed | Questionnaire survey among surveillance staff at the KNH sentinel site and NIC lab staff | 2.9 | 2.7 |
| Perception of surveillance staff on obtaining consent | No. of surveillance staff in each category/Number of staff interviewed | 2.4 | ||
| Perception of surveillance staff on filling the case investigation forms | No. of surveillance staff in each category/Number of staff interviewed | 2.8 | ||
| Perception of surveillance staff on sample collection | No. of surveillance staff in each category/Number of staff interviewed | 2.8 | ||
| Perception of surveillance staff on sample packaging and sending of samples | No. of surveillance staff in each category/Number of staff interviewed | 2.9 | ||
| Perception of surveillance staff on sending samples | No. of surveillance staff in each category/Number of staff interviewed | 2.8 | ||
| Perception of surveillance staff on data flow | No. of surveillance staff in each category/Number of staff interviewed | 2.9 | ||
| Perception of surveillance staff on retrieval of data | No. of surveillance staff in each category/Number of staff interviewed | 2.2 | ||
| Perception of surveillance staff on whether there are unnecessary steps to be modified or eliminated | No. of laboratory staff in each category/Number of lab staff interviewed | 3 | ||
| Surveillance staff rating ease of understanding ISSS guidelines | No. of lab staff in each category/Number of lab staff interviewed | 2.7 | ||
| Flexibility | ||||
| The proportion of samples tested for pathogens other than influenza | No. of samples tested for pathogens other than influenza/Number of samples tested for influenza | 3 | 2.7 | |
| Perception of surveillance staff whether the existing ISSS easily adapts to any new guidelines | No. of surveillance staff in each category/Number of staff interviewed | 2.8 | ||
| Perception of surveillance staff whether human resource gaps affect the smooth operation of the ISSS. | No. of surveillance staff in each category/Number of staff interviewed | 2.4 | ||
| Acceptability | ||||
| Proportion surveillance staff that receives feedback on influenza test results | No. of surveillance staff in each category/Number of staff interviewed | Questionnaire survey among surveillance staff at the KNH sentinel site and NIC lab staff | 2.9 | 2.7 |
| Proportion surveillance staff that is satisfied with the influenza weekly bulletins | No. of surveillance staff in each category/Number of staff interviewed | 2.1 | ||
| Proportion surveillance staff that receives feedback on epi curve | No. of surveillance staff in each category/Number of staff interviewed | 2.8 | ||
| Proportion surveillance staff that is satisfied with influenza test results | No. of surveillance staff in each category/Number of staff interviewed | 2.9 | ||
| The proportion of surveillance staff that is satisfied with the influenza weekly bulletin | No. of surveillance staff in each category/Number of staff interviewed | 2.5 | ||
| Perception of surveillance staff on whether the system respects cultural norms, privacy, and confidentiality requirements | No. of surveillance staff in each category/Number of staff interviewed | 3 | ||
| Representativeness | ||||
| Geographical coverage | No. of surveillance staff in each category/Number of staff interviewed | Geographical distribution of sentinel sites | 1 | 2 |
| Inclusion of all age groups | Age distribution of cases ILI/SARI (median 1.13 Y, minimum 0 Y, and maximum 122 Y) | Case-based database | 3 | |
| Stability | ||||
| Frequency of lack of data forms | No. of surveillance staff in each category/Number of staff interviewed | Questionnaire survey among surveillance staff at the KNH sentinel site and NIC staff | 3 | 2.9 |
| Frequency of lack of sampling materials/kits | No. of surveillance staff in each category/Number of staff interviewed | 3 | ||
| Frequency of power supply outages | No. of surveillance staff in each category/Number of staff interviewed | 3 | ||
| Perception surveillance staff on whether the ISSS is reliable in reporting influenza cases | No. of surveillance staff in each category/Number of staff interviewed | 2.8 | ||
| Quantitative Attributes | ||||
| Data quality and completeness | ||||
| The proportion of ILI/SARI cases that meet the case definition | No. of ILI/SARI cases that meet the case definition/Total number of ILI/SARI cases | Case-based database | 3 | 2.8 |
| The proportion of sampled ILI/SARI cases with available laboratory results | No. of good quality samples received/Total number of samples received | Case-based database | 3 | |
| Perception of surveillance staff on whether training of ILI/SARI reporting tools is adequate | No. of ILI/SARI cases with available laboratory results/Number of sampled ILI/SARI cases | Laboratory logbook and case-based database | 3 | |
| Perception of surveillance staff on whether supervision done by higher levels on influenza reporting is adequate | No. of surveillance staff in each category/Number of staff interviewed | Questionnaire | 2.8 | |
| Data with missing (not filled) variables | No. of surveillance staff in each category/Number of staff interviewed | Questionnaire | 1.9 | |
| Data Completeness | Data audit tool | 2.9 | ||
| Timeliness | ||||
| Time to implement all steps of analysis of laboratory testing | No. of lab staff within each reported category (<30 min, 30-60 min, >60 min)/Number of lab staff interviewed | Case-based database | 2.7 | 2.6 |
| The proportion of samples tested within one week from receipt | No. of samples tested within one week from receipt/Number of samples tested | Case-based database | 2 | |
| Perception of surveillance officers on whether the transportation service complies with the pick-up of boxes/samples | No. of surveillance staff in each category/Number of staff interviewed | Questionnaire | 2.6 | |
| Positive predictive value | No. of positive / Total suspects (SARI/ILI) | Case-based data | 1 | 1 |
Table 3: Description of the surveillance system attributes performance.
Valentine Ndunge Kabita1,&, Samuel Kadivane2, Lily Chepkirui3, Rosalia Kalani2, Maria Nunga1
1Kenya Field Epidemiology and Laboratory Training Program, Ministry of Health, Nairobi, Kenya, 2Division of Disease Surveillance and Response, Ministry of Health, Nairobi, Kenya, 3National Influenza Center, Ministry of Health, Nairobi, Kenya,
&Corresponding author: Valentine Ndunge Kabita, Kenya Field Epidemiology and Laboratory Training Program, Ministry of Health, Nairobi, Kenya, Email:valentinekabita@gmail.com, ORCID: https://orcid.org/0009-0003-1777-8054
Received: 22 Jul 2026, Accepted: 14 Oct 2026, Published: 16 Oct 2026
Domain: Infectious Disease Epidemiology
Keywords: Influenza, Human, Sentinel Surveillance, Kenya
©Valentine Ndunge Kabita et al. Journal of Interventional Epidemiology and Public Health (ISSN: 2664-2824). This is an Open Access article distributed under the terms of the Creative Commons Attribution International 4.0 License (https://creativecommons.org/licenses/by/4.0/), which permits unrestricted use, distribution, and reproduction in any medium, provided the original work is properly cited.
Cite this article: Valentine Ndunge Kabita et al., Evaluation of influenza sentinel surveillance system in Kenya, 2021–2022. Journal of Interventional Epidemiology and Public Health. 2026; 9(4):164. https://doi.org/10.37432/jieph-d-26-00267
Introduction: Influenza sentinel surveillance entails the routine, systematic collection of influenza data from selected surveillance sites. In Kenya, it was established in 2007 to monitor circulating influenza viruses. We evaluated the usefulness of Kenya’s influenza surveillance system to determine if it meets its objectives.
Methods: We applied CDC guidelines to assess performance. Microsoft Excel was used to extract data from the influenza database register. Descriptive statistics were conducted. Performance was assessed using nine attributes: simplicity, timeliness, acceptability, flexibility, stability, usefulness, data quality and completeness, positive predictive value, and representativeness. A 1–3 scale was used to score each indicator and attribute: 1 (weak), 2 (moderate), and 3 (good). Overall scores for each attribute and the system were obtained by averaging the scores.
Results: Records from eight sentinel sites were reviewed, 2021–2022. A total of 7,538 cases were tested; the majority, 6,586 (87.4%), were under 5 years; males were 4,307 (57.1%). Influenza-positive cases were 998 (13.2%), of which 835 (83.7%) were SARI patients; Kakuma site had 354 (35.5%) positives. Samples tested within one week of receipt were 5,451 (72.3%); type A accounted for 710/998 (71.1%). The majority, 5,183 (95%), had not received influenza vaccine. The overall mean system score was 2.5 (moderate-to-good performance). Key strengths were data quality (2.8), stability (2.9), and usefulness (2.8). Representativeness showed moderate (2.0) performance.
Conclusion: The system performed moderately well and generated surveillance data. However, gaps remained in the completeness of selected variables, laboratory testing timeliness and geographical representativeness. We recommend regular data-quality reviews, improved laboratory turnaround time and carefully planned expansion of the sentinel surveillance coverage.
According to the World Health Organization, seasonal influenza epidemics result in an estimated 3–5 million severe illnesses and 290,000–650,000 respiratory deaths each year worldwide. Children younger than five years, adults aged 65 years and above, pregnant women, and individuals with underlying medical conditions are at increased risk of serious disease [1].
The burden of influenza-related mortality is highest in Sub-Saharan Africa, Southeast Asia, and the Western Pacific, with nearly 99% of deaths occurring in low- and middle-income countries [2]. In Kenya, influenza prevalence has been estimated at 19% [3]. Influenza and pneumonia contribute to 22,571 deaths (8.57% of all deaths), corresponding to an age-standardised mortality rate of 85.68 per 100,000 population, ranking the country 38th globally [4].
The Global Influenza Surveillance and Response System (GISRS) of the WHO, established in 1952, is a worldwide network of laboratories and collaborating centers responsible for monitoring circulating influenza viruses and informing the annual selection of influenza vaccine strains for both the northern and southern hemispheres. The system also functions as a global surveillance mechanism for the early detection of novel influenza viruses with potential pandemic implications [5].
The GISRS network comprises six WHO Collaborating Centers, four WHO Essential Regulatory Laboratories, and 142 institutions designated as National Influenza Centers across 112 WHO Member States, supported by ad hoc groups established to address emerging influenza-related challenges. Following the 2009–2010 influenza pandemic, laboratory capacity for influenza detection using RT-PCR has improved in the African Region, with 30 out of 47 countries (64%) currently able to identify influenza infection[5].
In Kenya, a tropical setting, influenza transmission occurs throughout the year, with seasonal variations in activity. The highest incidence is observed during the southern hemisphere winter, with peaks occurring during the rainy seasons (March–April and October–November) and the cooler month of July. Both influenza A and B viruses circulate in the country, with several strains identified. A study conducted between 5 October 2006 and 8 November 2011 reported the distribution of influenza types and subtypes as follows: influenza B (31%), pandemic influenza A(H1N1) 2009 (28%), seasonal influenza A(H3N2) (24%), seasonal influenza A(H1N1) (10%), and unsubtyped influenza viruses (7%) [6].
Influenza sentinel surveillance involves the systematic collection of clinical and epidemiological information from designated surveillance sites. In Kenya, the system was introduced in 2007 to generate timely and reliable data on influenza patterns and to support the detection of emerging and circulating virus strains, thereby informing public health actions [7]. Currently, Kenya’s influenza surveillance system operates through eight sentinel sites, including Kenyatta National Hospital (KNH), a tertiary academic referral facility in Nairobi; Coast General Teaching and Referral Hospital (CGTRH); County Referral Hospitals in Kakamega, Nakuru, Nyeri, and Marsabit; and health facilities serving refugee populations in Kakuma (International Rescue Committee main hospital) and Dadaab. The surveillance system captures both Influenza-Like Illness (ILI) and Severe Acute Respiratory Illness (SARI) cases [8]. At KNH, influenza surveillance is limited to paediatric wards, while the remaining sentinel sites enrol patients across all age categories [9].
Patients presenting with respiratory symptoms in outpatient departments (ILI) and those hospitalized with respiratory illness (SARI) are recruited into the surveillance system. After providing consent, clinical specimens are collected, and the surveillance program is currently supported by the Henry Jackson Foundation (HJF) and the Kenya Medical Research Institute (KEMRI), which work in collaboration with the Ministry of Health (MOH) to implement and monitor the system. The program receives financial support from the United States Centers for Disease Control and Prevention (CDC) [8]
The WHO recommends regular assessment of influenza surveillance systems to identify gaps, enhance performance, and generate evidence on the reliability of surveillance data for continued use in guiding public health policies and interventions. However, evaluations assessing the performance of established influenza surveillance systems remain scarce in Africa, including Kenya. Evaluating Kenya’s influenza sentinel surveillance system is important for several reasons. First, it ensures public health authorities have reliable and timely data on circulating influenza strains, which is essential for targeted prevention and control measures. Second, identifying gaps and areas for improvement strengthens the country’s overall capacity for pandemic preparedness and emergency response. In recent years, the effectiveness and reliability of this system have not been comprehensively evaluated. We aimed to address this gap by providing updated information on the system’s performance, identifying areas for improvement, and assessing the reliability of the data collected. We evaluated system performance using nine attributes: simplicity, timeliness, acceptability, flexibility, stability, usefulness, data quality and completeness, positive predictive value, and representativeness. The specific objectives were to characterize influenza cases reported through the system by time, place, and person, and to assess the performance of the Influenza Sentinel Surveillance System (ISSS) in Kenya during 2021–2022.
Study design
We conducted a retrospective records review of severe acute respiratory illness (SARI) and Influenza-like Illness (ILI) cases reported between 2021 and 2022 at eight sentinel sites. We adopted CDC guidelines to evaluate the performance of the influenza surveillance system in Kenya, 2021–2022. To assess and fully describe the influenza system, key users involved in influenza surveillance at the Kenyatta National Hospital (KNH) sentinel site, National Influenza Center (NIC), and Center for Disease Control (CDC) completed a structured questionnaire survey.
Study site
The Influenza Sentinel Surveillance System (ISSS) is domiciled at the Division of Disease Surveillance and Response, and a national coordinator is in place. The evaluation was conducted across 8 sentinel sites: Dadaab, IRC Kakuma, Marsabit, Nyeri, Nakuru, Kakamega, Coast, and KNH.
Study participants
All suspected cases enrolled in the abstracted records between 2021 and 2022 that met the case definition of either severe acute respiratory illness (SARI) or Influenza-like Illness (ILI) were included for analysis. Both pediatric and adult cases were investigated. Key system users were interviewed for the system evaluation.
Operational definitions
Influenza-like illness (ILI) was defined as an outpatient of any age presenting with an acute respiratory infection characterized by a measured temperature of ≥38°C and cough, with symptom onset within the preceding 10 days. Severe acute respiratory illness (SARI) was defined as a hospitalized patient with an acute respiratory infection, a history of fever or measured temperature of ≥38°C, and cough, with symptom onset within the previous 10 days. A confirmed influenza case was defined as an individual meeting the clinical case definition and having laboratory confirmation of influenza virus infection.
Questionnaire Development
The authors developed a structured questionnaire by adapting items from previously published influenza surveillance system evaluation instruments. Items were reviewed and adapted to ensure relevance to the objectives, attributes, and operational context of Kenya’s influenza sentinel surveillance system. The adapted questionnaire was reviewed for clarity and relevance before administration to key surveillance personnel.
Data collection tools, process and exclusion criteria
We used a Microsoft Excel data abstraction tool to extract and clean data from the influenza database. We collected demographic, clinical, and laboratory variables. Records with incomplete information on essential variables, including age and influenza laboratory results, were excluded from the analysis. For the questionnaire component, participation was voluntary, and stakeholders who were not willing to complete the self-administered questionnaire were not included in the questionnaire analysis.
To evaluate and fully describe the influenza system, we administered a structured questionnaire to purposively selected key personnel involved in coordinating and implementing influenza sentinel surveillance. Participants were selected to capture perspectives from key components of the surveillance system, based on their direct involvement in and knowledge of surveillance activities. Nineteen personnel were eligible, and 14 (73.7%) completed the questionnaire. Respondents were mainly drawn from KNH sentinel site, the National Influenza Centre (NIC), and CDC-supported surveillance activities.
Data Analysis
We used MS Excel to analyze the data and perform descriptive statistics. For continuous variables, we used measures of central tendency (Median and interquartile range), and for categorical variables, frequencies and proportions were used. We evaluated performance using nine attributes: simplicity, timeliness, acceptability, flexibility, stability, usefulness, data quality and completeness, positive predictive value, and representativeness. We developed specific indicators for each attribute and assessed them using quantitative and qualitative methods. We applied a three-point scoring scale, with scores of 1, 2, and 3 representing weak, moderate, and good performance, respectively. For quantitative indicators, scores of <60%, 60–79%, and ≥80% were assigned scores of 1, 2, and 3, respectively. We scored qualitative indicators using predefined assessment criteria and expert judgment informed by surveillance documentation, interviews with key surveillance personnel, and assessment of surveillance procedures. Study investigators with experience in epidemiology and public health surveillance conducted the qualitative assessments. Evaluators discussed any differences in interpretation and resolved them by consensus.
The approach for calculating attribute and overall system scores was adapted from previous evaluations of influenza sentinel surveillance systems in the Democratic Republic of Congo and Zambia [10] [11]. We assigned each indicator a score of 1, 2, or 3 according to the predefined scoring criteria. We adapted the scoring and aggregation approach from previous evaluations of influenza sentinel surveillance systems in Africa. We calculated each attribute score as the arithmetic mean of its constituent indicator scores, with all indicators contributing equally to the attribute. The overall system score was calculated as the mean of the nine attribute scores, also giving each attribute equal weight. These mean scores served as summary measures of system performance and were interpreted as comparative measures rather than precise continuous measurements.
Ethical considerations
Permission to conduct this evaluation was obtained from the Head of the Division of Disease Surveillance and Response (DDSR), Ministry of Health, Kenya. This evaluation was classified as a public health surveillance activity rather than research and, therefore, did not require formal ethical approval from an Institutional Review Board (IRB) or Ethical Review Committee (ERC), in accordance with the Kenya Ministry of Health research and ethics guidelines. The study utilized routinely collected surveillance data, and no direct patient contact occurred. Verbal informed consent for participation in the surveillance system was obtained from all patients at enrollment, following national surveillance protocols. The evaluation was conducted ensuring that ethical considerations such as confidentiality, anonymity, and data security were upheld. No personal identifiers were collected or reported in this study.
Characteristics of ILI and SARI cases
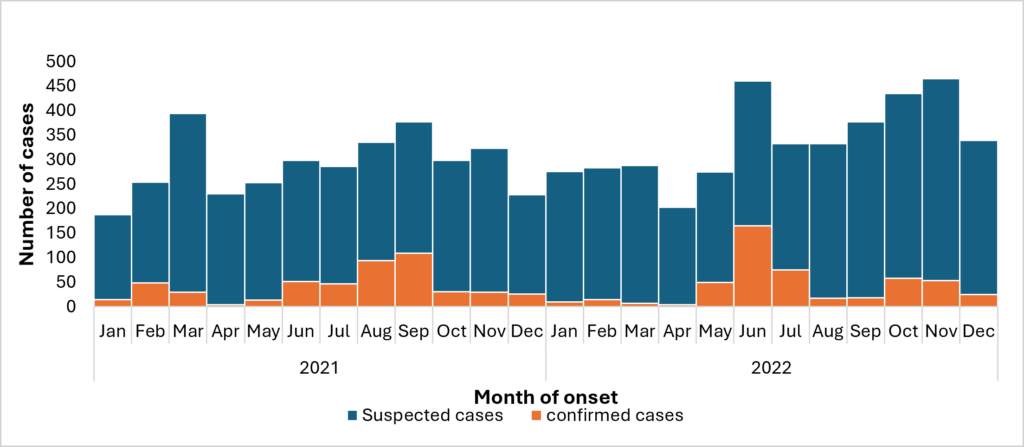
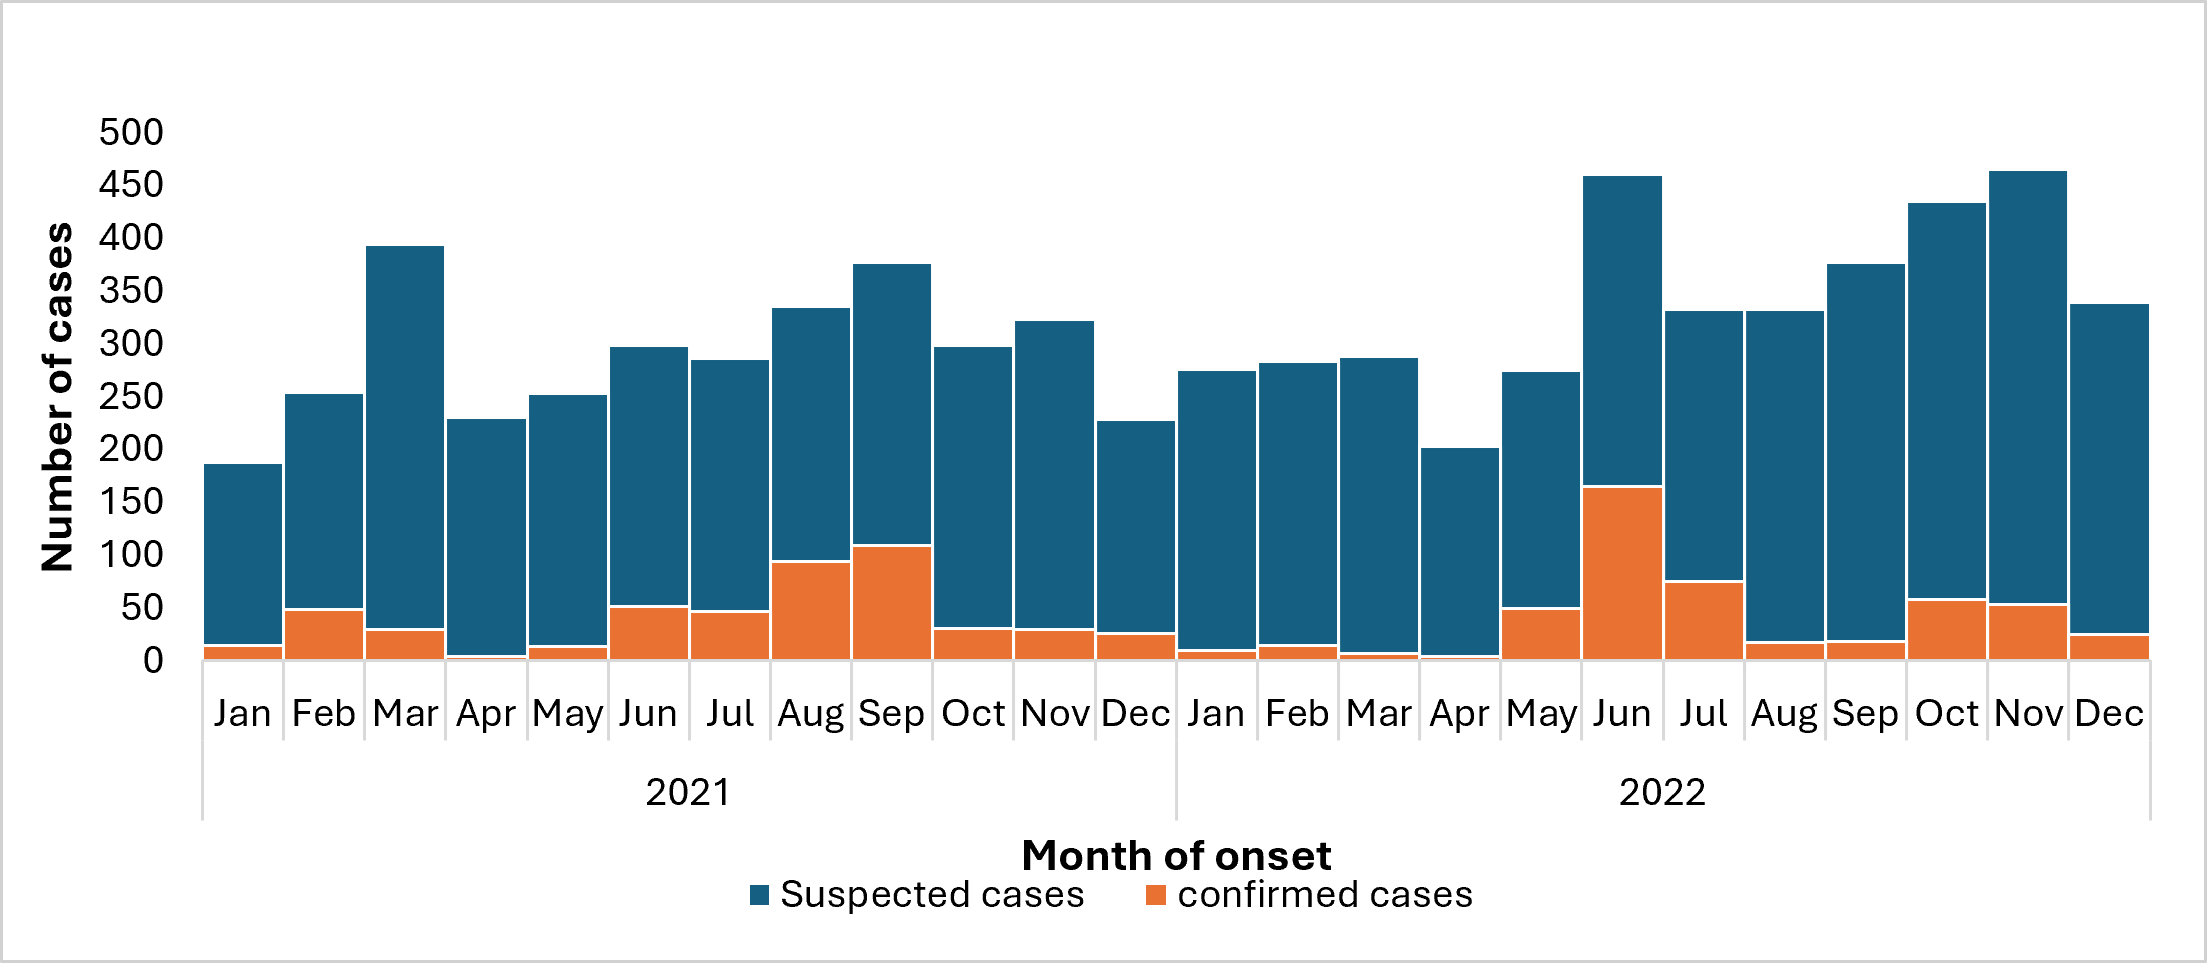
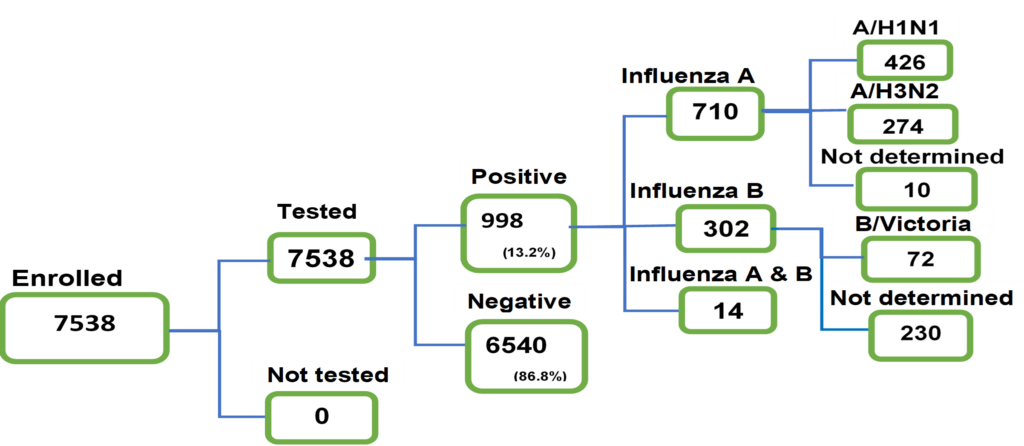
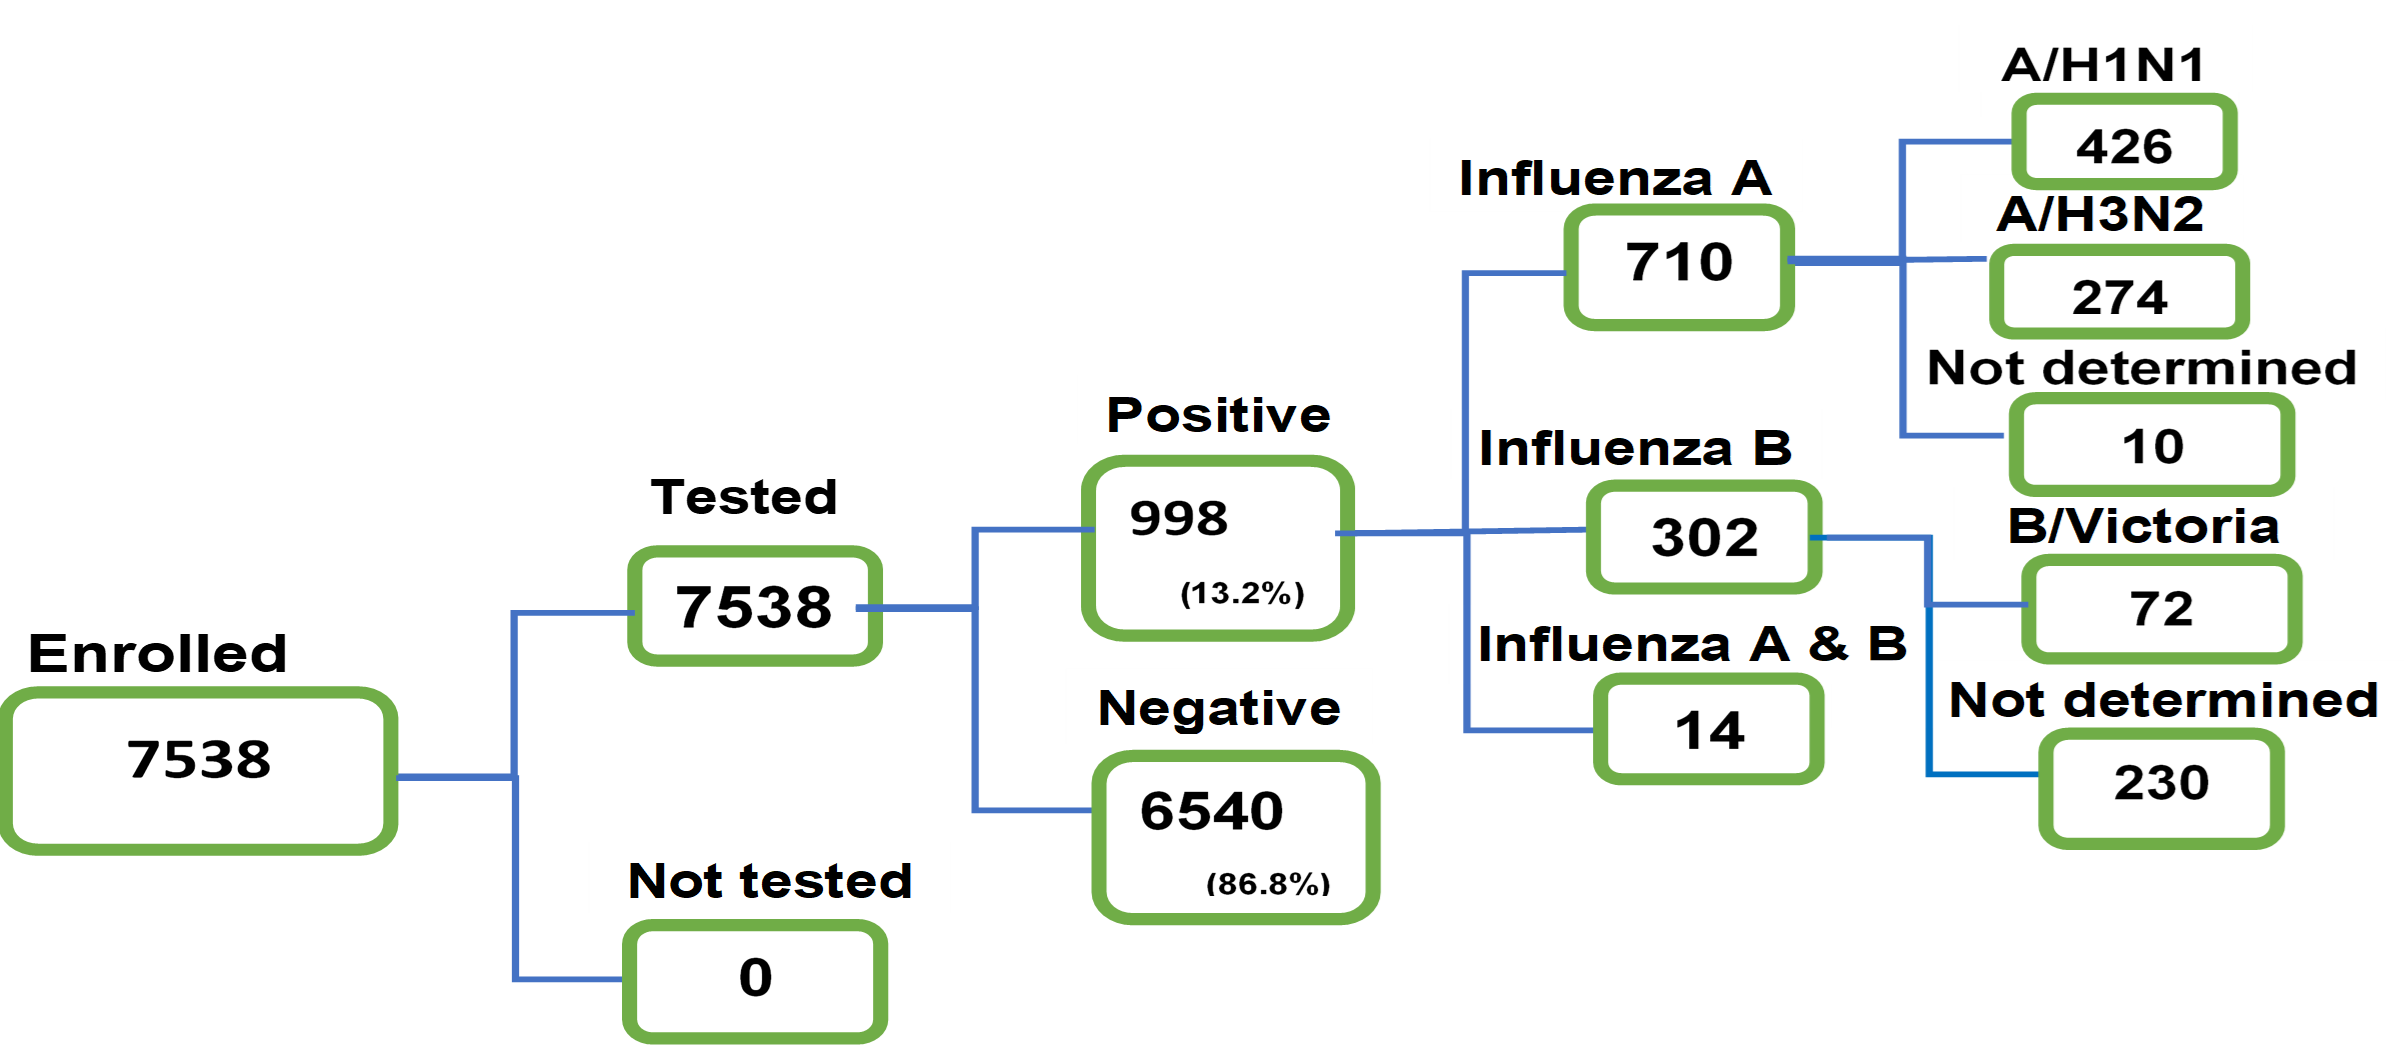
A total of 7538 cases from the eight sentinel sites were included in the final analysis, of which 899 (11.9%) met the ILI case definition, and 6639 (88.1%) met the SARI case definition(Table 1). Influenza viruses were detected in 998 of 7538 (13.2%) samples tested, including 163 of 899 (18.1%) from ILI cases and 835 of 6639 (83.7%) SARI cases. The most affected age group was 0 to <2 years, with 554 (55.5%) confirmed influenza cases, and the least affected was ≥65 years, with 7 (0.7%) cases. The majority, 6,586 (87.4%) of suspected cases and 839 (84.1%) of confirmed cases, were children aged <5 years, as shown in Table 1. Influenza A virus cases were 710 (71.1%), while 302 (30.3%) had influenza B and 14 (1.4%) had both influenza A and B. Because coinfections were counted under both virus types, these categories were not mutually exclusive. Influenza A/H1N1 viruses were 426 (59.1%), while influenza A/H3N2 viruses were 274 (38.6%), and 10 (1.4%) influenza A viruses were not subtyped. Of influenza B viruses, the Victoria lineage was 72 (23.8%), and the remaining 230 (76.2%) of influenza B lineages were not determined, as illustrated in Figure 2. A number of influenza-positive samples, 163 (16.3%), were obtained from patients with influenza-like illness (ILI), while 835 (83.7%) were from patients with severe acute respiratory illness (SARI). Influenza virus detection was highest between June and November (Figure 1). The questionnaire survey was completed by 14 of the 19 (74%) key personnel involved in influenza surveillance at the KNH sentinel site, NIC, and CDC.
Evaluation of the influenza sentinel surveillance system (ISSS) attributes
The ISSS achieved an overall mean score of 2.5 out of 3 during the 2021–2022 evaluation period, reflecting moderate-to-good performance across the assessed attributes (Table 2)
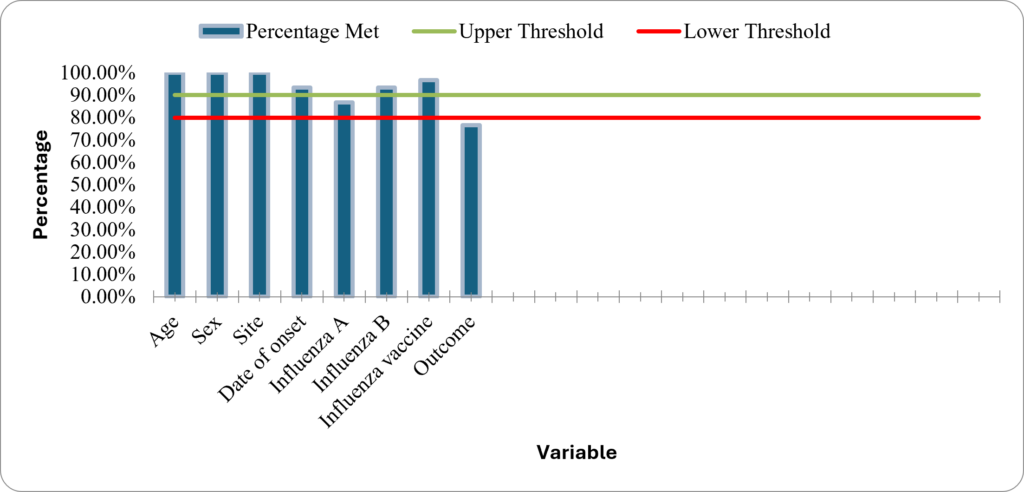
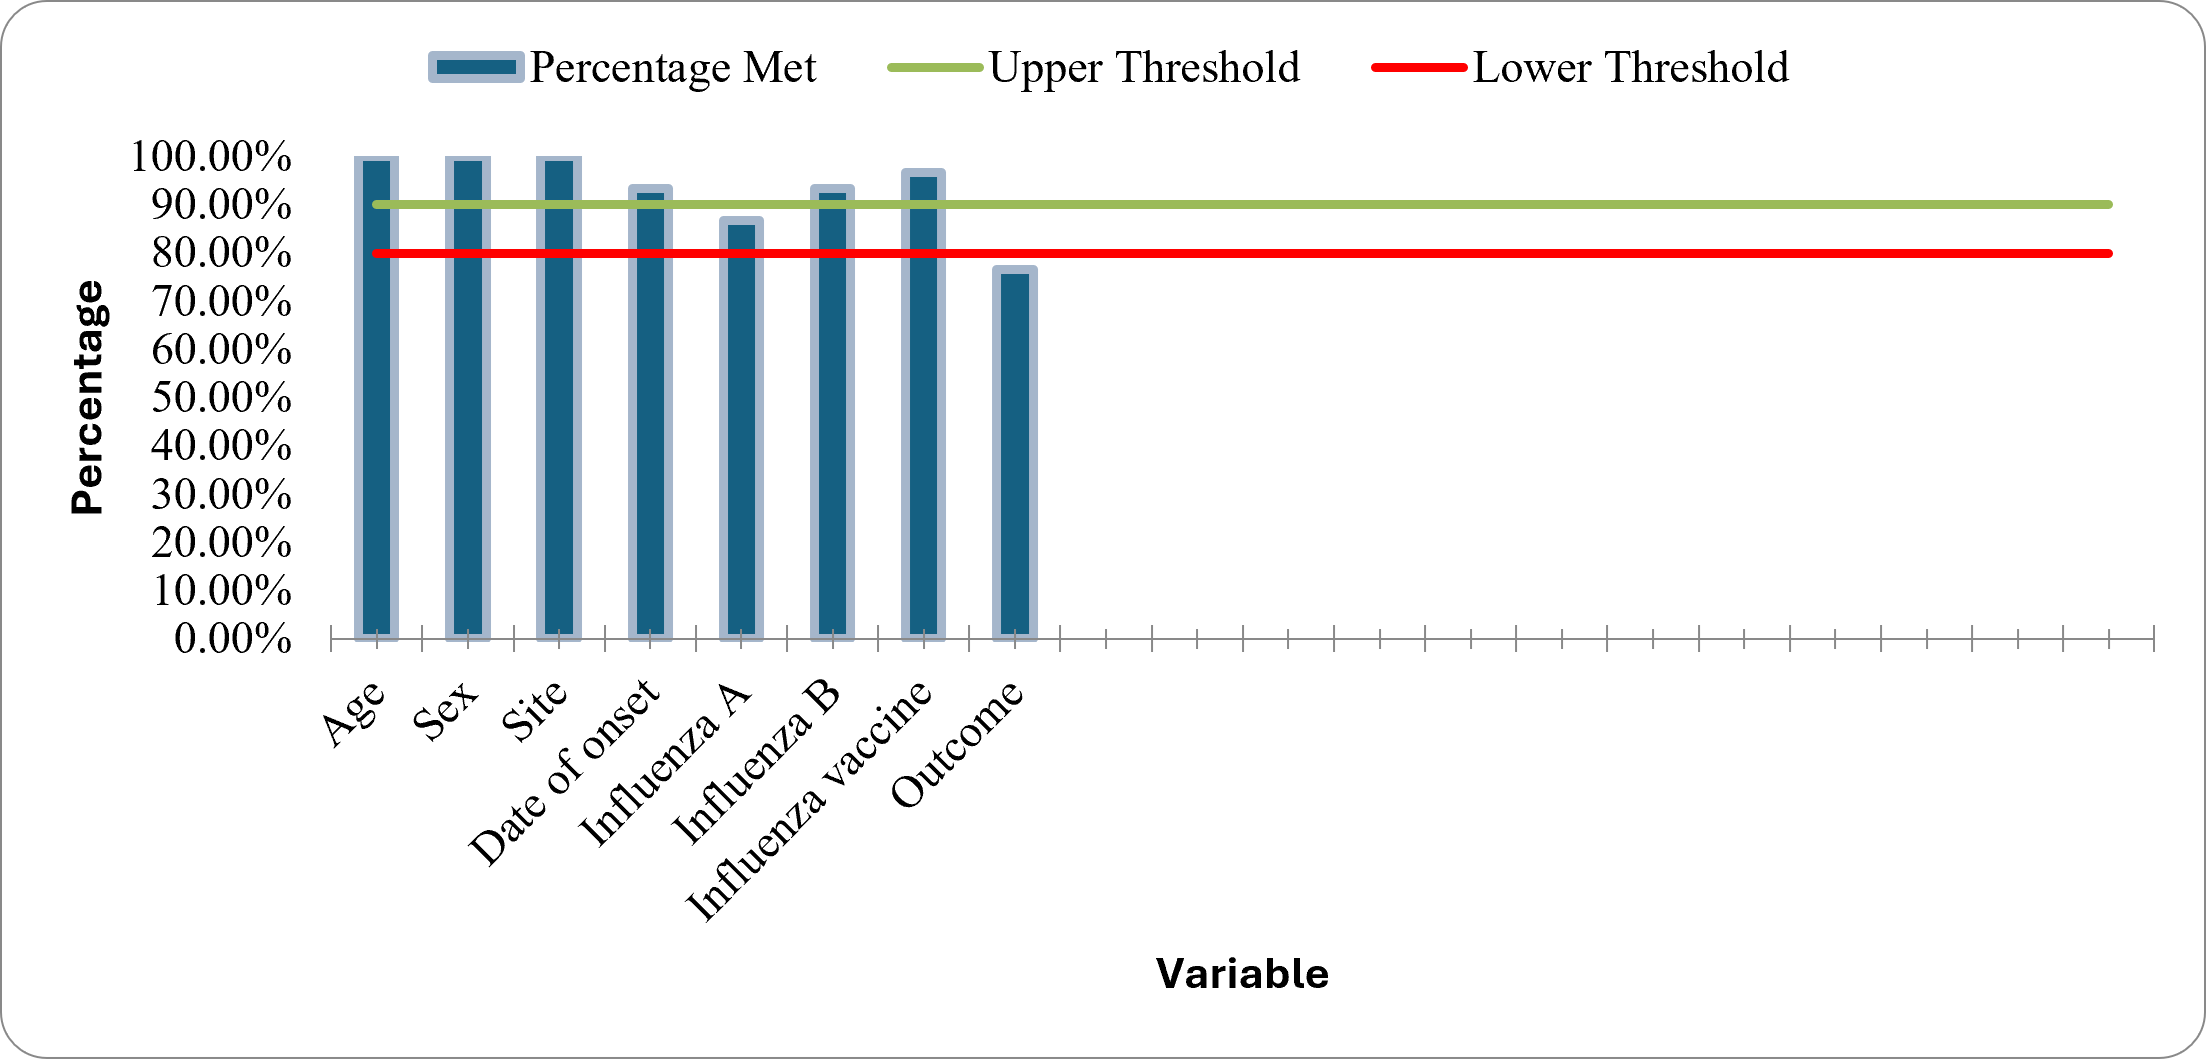
Data quality: Of the four indicators assessed, two demonstrated good performance, while the remaining two showed moderate performance. The evaluation focused on key variables within the data collection forms to assess completeness and consistency of recorded information, including age, sex, site, date of onset, lab result, and outcome. Six key variables met the upper threshold and scored 90% and above. One variable was below the lower threshold. The data quality and completeness attribute achieved a mean score of 2.8 out of 3, reflecting moderate-to-good performance as shown in Tables 2, 3 and Figure 3)
Stability: Three of the four evaluated indicators achieved good performance, while one showed moderate performance. The ISSS in Kenya is predominantly supported by international funding sources, which contribute over 90% of the system’s financial resources. The stability attribute had a mean score of 2.9, reflecting moderate-to-good performance (Tables 2 and 3).
Usefulness: Three of the six indicators assessed scored 3 (good performance), while three had moderately good performance. The mean score for usefulness was 2.8 (moderate to good performance). The usefulness of influenza data was strongly demonstrated by the availability of the weekly surveillance bulletins throughout the two-year review period. The respondents also reported that the ISSS contributed to the determination of the circulating strains of influenza, helped describe the disease burden of influenza, and played a significant role in the vaccine network as shown in Tables 2 and 3.
Representativeness: Of the two indicators evaluated, inclusion of all age groups, achieved good performance, whereas geographical coverage was weak. Sentinel surveillance sites were present in only 8/47 (17%) counties. The representativeness attribute had a mean score of 2.0, reflecting moderate performance (Tables 2 and 3). The system included all age groups ranging from 0 to 122 years for SARI/ILI cases. Seven of the 14 respondents (50%) also reported missed surveillance opportunites during weekends. (Data not shown)
Simplicity: Among the 10 indicators evaluated, one achieved good performance, while nine demonstrated moderate performance. Indicators assessing the ease of implementing surveillance activities from the perspective of surveillance personnel were rated as moderately performing. The simplicity attribute had a mean score of 2.7, reflecting moderate-to-good performance out of 3, as shown in Tables 2 and 3.
Timeliness: Of the five indicators assessed, four demonstrated moderate-to-good performance, while one showed moderate performance. The proportion of samples tested within one week of receipt was 5,451 (72.3%), corresponding to a score of 2 (moderate performance). For 57.1% (4/7) of surveillance personnel, the process from case identification to final sample packaging required more than 30 minutes. The overall mean score for timeliness was 2.6, indicating moderate-to-good performance (Tables 2 and 3).
Acceptability: Among the six indicators evaluated, one achieved good performance, while the remaining five demonstrated moderate-to-good performance. The acceptability attribute had a mean score of 2.7 out of 3, reflecting moderate-to-good performance (Tables 2 and 3).
Flexibility: The ISSS demonstrated the ability to adapt by monitoring trends in circulating influenza viruses and supporting testing for additional respiratory pathogens. During the evaluation period, all 7,538 influenza samples underwent concurrent SARS-CoV-2 testing. Of the three indicators assessed, one showed good performance, while two had moderate-to-good performance. The mean score for flexibility was 2.7, indicating moderate-to-good performance (Tables 2 and 3).
Positive Predictive Value (PPV): The PPV was obtained by dividing the total confirmed positive influenza cases by the total suspected cases: 998/7538 (13.2%), with a score of 1 (weak performance; Tables 2 and 3).
Data from ILI and SARI patients participating in the national sentinel surveillance system were analyzed to describe patterns of circulating influenza viruses in Kenya. Overall, influenza surveillance in Kenya performed moderately well during the 2021–2022 period, providing valuable data on circulating influenza viruses in the country. However, several key observations and areas for improvement were identified.
Children younger than five years accounted for most patients enrolled through the sentinel surveillance system, consistent with previous studies [9]. This distribution should be interpreted considering the surveillance design, including the restriction of surveillance at KNH to pediatric wards and the predominance of SARI cases. The predominance of children under five years in the surveillance dataset may partly reflect the structure of the sentinel surveillance system and healthcare-seeking patterns. A previous evaluation of Kenya’s SARI surveillance system reported that children under five may be overrepresented in facility-based surveillance because healthcare services for this age group are subsidized in public health facilities, potentially resulting in differential healthcare utilization [9].
The Kakuma sentinel site, situated within a refugee camp near international borders, reported the highest number of influenza-positive cases during the evaluation period. This geographical context likely contributed to increased disease transmission due to population mobility and density, as observed in a similar study [12]. However, these surveillance counts may not necessarily indicate a higher population-level influenza risk because differences in catchment population, healthcare-seeking patterns, enrollment intensity, and testing practices may not have been accounted for. Influenza A viruses were the predominant viral type detected among influenza-associated illnesses, aligning with previous research [13]. This underscores the importance of targeted vaccination strategies and surveillance efforts to monitor strain prevalence and evolution.
Vaccination status was uncommon among enrolled SARI and ILI cases. However, because the analysis did not assess vaccine eligibility, availability, awareness, access, or reasons for non-vaccination, these findings alone cannot establish the causes of low vaccination uptake. Further assessment is needed to identify barriers and inform appropriately targeted vaccination and risk-communication interventions. The surveillance system achieved an overall mean score of 2.5, reflecting moderate-to-good performance, with data quality, stability, and usefulness as strengths. However, challenges in representativeness, timeliness, and data integration with existing reporting tools were noted, necessitating targeted interventions to enhance system efficiency.
The surveillance system’s flexibility allowed for monitoring additional pathogens such as COVID-19, showcasing its adaptability to evolving public health threats. However, resource constraints limited systematic testing for non-influenza pathogens, highlighting the importance of sustained financial support and resource allocation.
While the selection of sentinel sites in strategic counties facilitated efficient surveillance operations, the system’s geographic representativeness was limited. Expanding surveillance coverage to additional regions could enhance the system’s ability to capture nationwide influenza trends but would require increased resources and logistical support.
Despite occasional data incompleteness, the surveillance system’s simplicity and acceptability likely contributed to overall data quality and completeness. Continued efforts to streamline data collection processes and enhance staff training could improve data accuracy and reliability.
The system’s continuous operation since its establishment in 2007 demonstrated its stability. This could be attributed to financial resources from partners such as the CDC. The demonstrated stability increases confidence in the system’s long-term continuity and its capacity to provide evidence for guiding public health actions
Limitations of the study
Data Completeness/Missing data elements. Despite efforts to ensure comprehensive data collection, occasional incompleteness in the recorded variables may have affected the accuracy and reliability of our analyses. Incomplete data could introduce biases or limit the scope of our findings.
Sampling Bias: Our evaluation focused on sentinel sites, which may not fully represent the broader population or capture influenza trends in underserved or remote regions. This sampling approach could introduce bias and affect the generalizability of our results.
The questionnaire component had few respondents and did not include personnel from all eight influenza sentinel surveillance sites. We purposively administered it to selected key personnel involved in coordinating and implementing influenza sentinel surveillance.
Measures taken to mitigate the limitations
We took several measures to minimize the potential effects of these limitations. We cleaned and reviewed routine surveillance data for completeness before analysis and excluded records with incomplete information on essential variables. We purposively selected questionnaire respondents from key personnel directly involved in influenza sentinel surveillance, and triangulated questionnaire findings with routine surveillance data and a review of surveillance documentation and procedures. Nevertheless, limitations related to geographical coverage, questionnaire respondent representation, and the facility-based surveillance design could not be fully eliminated and were considered when interpreting the findings.
The influenza sentinel surveillance system in Kenya demonstrated moderate-to-good performance, with an overall mean score of 2.5 based on the scoring framework used in this evaluation. The system generated useful information on circulating influenza viruses and demonstrated strengths in data quality, stability, and usefulness. However, gaps remained in geographical representativeness, completeness of selected variables, and timeliness of laboratory testing. Sentinel sites covered only 8 of Kenya’s 47 counties, indicating limited geographical coverage of the surveillance network.
To strengthen the system, sentinel site supervisors should conduct regular data reviews to improve data quality, while data managers should implement data validation rules to minimize erroneous entries, such as future dates. Laboratory personnel should be trained to improve the timeliness of sample receipt and testing. Expansion of sentinel surveillance to additional public and private health facilities could improve geographical coverage and reduce the likelihood of missing influenza cases. Integration of ILI surveillance into routine weekly IDSR reporting through MOH 505 could further strengthen influenza surveillance. Influenza prevention interventions, including vaccination, should prioritize high-risk groups, particularly young children and other populations vulnerable to severe disease, this should be consistent with national and international recommendations. Enhanced surveillance among SARI patients and continued assessment of sites such as Kakuma may also improve detection and understanding of influenza transmission in underserved populations.
What is already known about the topic
What this study adds
The authors of this work declare no competing interests.
Disclaimer
The findings and conclusions in this report are solely those of the authors and do not necessarily reflect the official stance of the U.S. Centers for Disease Control and Prevention (CDC) or the Kenya Ministry of Health.
Availability of data and materials
The datasets generated and/or analyzed during the evaluation are available from the corresponding author upon reasonable request, without undue reservation.
The authors sincerely thank the Kenya Field Epidemiology and Laboratory Training Program (FELTP) for their invaluable guidance and technical input. We also appreciate the Centers for Disease Control and Prevention-Kenya (CDC-Kenya) and the National Influenza Center for providing the influenza data used in this analysis. Additionally, we acknowledge the Division of Disease Surveillance and Response (DDSR) at the Ministry of Health for their unwavering technical support, which was instrumental in the success of this evaluation.
V.K: Conceptualization, data collection, analysis, methodology, visualization, writing original draft, reviewing and editing
S.K: Methodology, supervision and reviewing the original draft
L.C: Data collection and reviewing the original draft
R.K: Data collection and reviewing the original draft
M.N: Conceptualization, data analysis, methodology, supervision, writing the original draft, reviewing and editing
All authors contributed to the article and approved the submitted version.
| Table 1: Demographic characteristics of ISSS cases in Kenya, 2021–2022 | |||
|---|---|---|---|
| Characteristic | Type of case definition | ||
| Age group (Years) | ILI (n=899) | SARI (n=6639) | Total (N=7538) |
| n (%) | n (%) | n (%) | |
| 0 to <2 | 309 (34.4) | 4755 (71.5) | 5064 (67.2) |
| 2 to <5 | 248 (27.6) | 1274 (19.2) | 1522 (20.2) |
| 5 to <15 | 140 (15.6) | 353 (5.3) | 493 (6.5) |
| 15 to <50 | 166 (18.5) | 150 (2.3) | 316 (4.2) |
| 50 to <65 | 24 (2.7) | 48 (0.7) | 72 (0.9) |
| ≥65 | 12 (1.2) | 58 (0.9) | 70 (0.9) |
| Missing | 0 (0) | 1 (0.0) | 1 (0.0) |
| Median (IQR) | 9.9 (1.3-11.2) | 1.6 (0.5-2.1) | 2.0 (0.6-2.6) |
| Sex | |||
| Female | 385 (42.8) | 2846 (42.9) | 3231 (42.9) |
| Male | 514 (57.2) | 3793 (57.1) | 4307 (57.1) |
| Sentinel site | |||
| Dadaab | 32 (3.6) | 459 (6.9) | 491 (6.5) |
| Kakamega | 16 (1.8) | 232 (3.5) | 248 (3.3) |
| Kakuma | 248 (27.7) | 2414 (36.3) | 2662 (35.3) |
| KNH | 12 (1.3) | 1258 (18.9) | 1270 (16.8) |
| Marsabit | 281 (31.4) | 147 (2.2) | 428 (5.7) |
| Mombasa | 30 (3.3) | 527 (7.9) | 557 (7.4) |
| Nakuru | 8 (0.9) | 1107 (16.7) | 1115 (14.8) |
| Nyeri | 269 (30) | 498 (7.5) | 767 (10.2) |
| Influenza Virus Results (rRT-PCR) | |||
| Influenza Positive | 163 (18.1) | 835 (12.6) | 998 (13.2) |
| Influenza A Detected | 110 (67.5) | 600 (71.9) | 710 (71.1) |
| A/H1N1 | 52 (47.3) | 374 (62.3) | 426 (60.0) |
| A/H3N2 | 57 (51.8) | 217 (36.2) | 274 (38.6) |
| A(Unclassified) | 1 (0.9) | 9 (1.5) | 10 (1.0) |
| Influenza B Detected | 55 (33.7) | 247 (29.6) | 302 (30.3) |
| B/Victoria | 20 (36.7) | 52 (21.1) | 72 (23.8) |
| B(Unclassified) | 35 (63.6) | 195 (78.9) | 230 (76.2) |
| Influenza A & B | 2 (1.2) | 12 (1.4) | 14 (1.4) |
| Turn-Around-Time (TAT) | |||
| ≤ 7 Days | 571 (63.5) | 4880 (73.5) | 5,451 (72.3) |
| >7 Days | 151 (16.8) | 1182 (17.8) | 1333 (17.7) |
| Missing date | 177 (19.7) | 577 (8.7) | 754 (10.0) |
| Attribute | Number of evaluated indicators | Mean score | Performance {1-weak, 2-moderate, 3-Good} |
|---|---|---|---|
| Simplicity | 10 | 2.7 | Moderate to good |
| Timeliness | 5 | 2.6 | Moderate to good |
| Acceptability | 6 | 2.7 | Moderate to good |
| Flexibility | 3 | 2.7 | Moderate to good |
| Data quality and completeness | 4 | 2.8 | Moderate to good |
| Stability | 4 | 2.9 | Moderate to good |
| Representativeness | 2 | 2 | Moderate |
| Usefulness | 6 | 2.8 | Moderate to good |
| Positive predictive value | 1 | 1 | weak |
| Overall | 36 | 2.5 | Moderate to good |
| Table 3: Description of the surveillance system attributes performance. | ||||
|---|---|---|---|---|
| Attribute | Calculation/Data inputs | Data source | Indicator score | Attribute mean score 1(Weak performance) 2(Moderate performance) 3(Good performance) |
| Qualitative Attributes | ||||
| Usefulness | ||||
| The proportion of surveillance staff aware of the influenza system objectives | No. of surveillance staff in each category/Number of staff interviewed No. of surveillance staff in each category/Number of staff interviewed | Questionnaire survey among surveillance staff at the KNH sentinel site and NIC lab staff | 3 | 2.8 |
| Perception of surveillance staff on whether the program has informed decision-makers in policy-making | No. of surveillance staff in each category/Number of staff interviewed | 2.8 | ||
| Perception of surveillance staff on whether the influenza data has stimulated research opportunities | No. of surveillance staff in each category/Number of staff interviewed | NIC data focal person | 2.6 | |
| Perception of surveillance staff on whether the influenza data provides insights into the disease burden | No. of surveillance staff in each category/Number of staff interviewed | 2.6 | ||
| Perception of surveillance staff on whether the ISSS has helped in identifying previously undetected or missed cases of influenza | No. of weekly bulletin/Number of total weeks | 3 | ||
| Availability of influenza weekly bulletins for the period under review | 3 | |||
| Simplicity | ||||
| Perception of surveillance staff on identification of cases | No. of surveillance staff in each category/Number of staff interviewed | Questionnaire survey among surveillance staff at the KNH sentinel site and NIC lab staff | 2.9 | 2.7 |
| Perception of surveillance staff on obtaining consent | No. of surveillance staff in each category/Number of staff interviewed | 2.4 | ||
| Perception of surveillance staff on filling the case investigation forms | No. of surveillance staff in each category/Number of staff interviewed | 2.8 | ||
| Perception of surveillance staff on sample collection | No. of surveillance staff in each category/Number of staff interviewed | 2.8 | ||
| Perception of surveillance staff on sample packaging and sending of samples | No. of surveillance staff in each category/Number of staff interviewed | 2.9 | ||
| Perception of surveillance staff on sending samples | No. of surveillance staff in each category/Number of staff interviewed | 2.8 | ||
| Perception of surveillance staff on data flow | No. of surveillance staff in each category/Number of staff interviewed | 2.9 | ||
| Perception of surveillance staff on retrieval of data | No. of surveillance staff in each category/Number of staff interviewed | 2.2 | ||
| Perception of surveillance staff on whether there are unnecessary steps to be modified or eliminated | No. of laboratory staff in each category/Number of lab staff interviewed | 3 | ||
| Surveillance staff rating ease of understanding ISSS guidelines | No. of lab staff in each category/Number of lab staff interviewed | 2.7 | ||
| Flexibility | ||||
| The proportion of samples tested for pathogens other than influenza | No. of samples tested for pathogens other than influenza/Number of samples tested for influenza | 3 | 2.7 | |
| Perception of surveillance staff whether the existing ISSS easily adapts to any new guidelines | No. of surveillance staff in each category/Number of staff interviewed | 2.8 | ||
| Perception of surveillance staff whether human resource gaps affect the smooth operation of the ISSS. | No. of surveillance staff in each category/Number of staff interviewed | 2.4 | ||
| Acceptability | ||||
| Proportion surveillance staff that receives feedback on influenza test results | No. of surveillance staff in each category/Number of staff interviewed | Questionnaire survey among surveillance staff at the KNH sentinel site and NIC lab staff | 2.9 | 2.7 |
| Proportion surveillance staff that is satisfied with the influenza weekly bulletins | No. of surveillance staff in each category/Number of staff interviewed | 2.1 | ||
| Proportion surveillance staff that receives feedback on epi curve | No. of surveillance staff in each category/Number of staff interviewed | 2.8 | ||
| Proportion surveillance staff that is satisfied with influenza test results | No. of surveillance staff in each category/Number of staff interviewed | 2.9 | ||
| The proportion of surveillance staff that is satisfied with the influenza weekly bulletin | No. of surveillance staff in each category/Number of staff interviewed | 2.5 | ||
| Perception of surveillance staff on whether the system respects cultural norms, privacy, and confidentiality requirements | No. of surveillance staff in each category/Number of staff interviewed | 3 | ||
| Representativeness | ||||
| Geographical coverage | No. of surveillance staff in each category/Number of staff interviewed | Geographical distribution of sentinel sites | 1 | 2 |
| Inclusion of all age groups | Age distribution of cases ILI/SARI (median 1.13 Y, minimum 0 Y, and maximum 122 Y) | Case-based database | 3 | |
| Stability | ||||
| Frequency of lack of data forms | No. of surveillance staff in each category/Number of staff interviewed | Questionnaire survey among surveillance staff at the KNH sentinel site and NIC staff | 3 | 2.9 |
| Frequency of lack of sampling materials/kits | No. of surveillance staff in each category/Number of staff interviewed | 3 | ||
| Frequency of power supply outages | No. of surveillance staff in each category/Number of staff interviewed | 3 | ||
| Perception surveillance staff on whether the ISSS is reliable in reporting influenza cases | No. of surveillance staff in each category/Number of staff interviewed | 2.8 | ||
| Quantitative Attributes | ||||
| Data quality and completeness | ||||
| The proportion of ILI/SARI cases that meet the case definition | No. of ILI/SARI cases that meet the case definition/Total number of ILI/SARI cases | Case-based database | 3 | 2.8 |
| The proportion of sampled ILI/SARI cases with available laboratory results | No. of good quality samples received/Total number of samples received | Case-based database | 3 | |
| Perception of surveillance staff on whether training of ILI/SARI reporting tools is adequate | No. of ILI/SARI cases with available laboratory results/Number of sampled ILI/SARI cases | Laboratory logbook and case-based database | 3 | |
| Perception of surveillance staff on whether supervision done by higher levels on influenza reporting is adequate | No. of surveillance staff in each category/Number of staff interviewed | Questionnaire | 2.8 | |
| Data with missing (not filled) variables | No. of surveillance staff in each category/Number of staff interviewed | Questionnaire | 1.9 | |
| Data Completeness | Data audit tool | 2.9 | ||
| Timeliness | ||||
| Time to implement all steps of analysis of laboratory testing | No. of lab staff within each reported category (<30 min, 30-60 min, >60 min)/Number of lab staff interviewed | Case-based database | 2.7 | 2.6 |
| The proportion of samples tested within one week from receipt | No. of samples tested within one week from receipt/Number of samples tested | Case-based database | 2 | |
| Perception of surveillance officers on whether the transportation service complies with the pick-up of boxes/samples | No. of surveillance staff in each category/Number of staff interviewed | Questionnaire | 2.6 | |
| Positive predictive value | No. of positive / Total suspects (SARI/ILI) | Case-based data | 1 | 1 |