
Research | Open Access | Volume 9 (4): Article 168 | Published: 20 Oct 2026

Views: 36
Menu, Tables and Figures
| Table 1: Baseline sociodemographic and obstetric characteristics of pregnant women | ||
|---|---|---|
| Characteristics | n | % |
| Age group (years) | ||
| <20 | 46 | 22.1 |
| 20–24 | 48 | 23.1 |
| 25–29 | 48 | 23.1 |
| 30–35 | 41 | 19.7 |
| 35+ | 25 | 12.0 |
| Occupation | ||
| Farmer | 43 | 20.7 |
| Trader | 47 | 22.6 |
| Formally employed | 61 | 29.3 |
| Unemployed | 57 | 27.4 |
| Marital status | ||
| Married | 110 | 52.9 |
| Divorced or single | 98 | 47.1 |
| Education | ||
| Non formal | 45 | 21.6 |
| Primary | 53 | 25.5 |
| Secondary | 57 | 27.4 |
| Tertiary | 53 | 25.5 |
| Religion | ||
| Christian | 115 | 55.3 |
| Moslem | 93 | 44.7 |
| Residence | ||
| Rural | 106 | 51.0 |
| Urban | 102 | 49.0 |
| Family monthly income (UGX) | ||
| ≤100,000 | 60 | 28.8 |
| ≤250,000 | 55 | 26.4 |
| ≤500,000 | 56 | 26.9 |
| >500,000 | 37 | 17.8 |
| Trimester of pregnancy | ||
| First | 70 | 33.7 |
| Second | 66 | 31.7 |
| Third | 72 | 34.6 |
| Gravidity | ||
| Gravida 1 | 77 | 37.0 |
| Gravida 2 | 68 | 32.7 |
| Multigravida (≥3) | 63 | 30.3 |
| Trimester of first ANC visit | ||
| First | 73 | 35.1 |
| Second | 60 | 28.8 |
| Third | 75 | 36.1 |
| Number of ANC visits | ||
| 1–3 | 79 | 38.0 |
| 4–6 | 72 | 34.6 |
| 7+ | 57 | 27.4 |
| IPT start week | ||
| <14 weeks | 106 | 51.0 |
| >14 weeks | 102 | 49.0 |
| Knows about IPT | ||
| No | 114 | 54.8 |
| Yes | 94 | 45.2 |
| Sleeps under ITN | ||
| Yes | 90 | 43.3 |
| No | 118 | 56.7 |
| Frequency of sleeping under ITN | ||
| Not at all | 70 | 33.7 |
| Some night | 82 | 39.4 |
| All night | 56 | 26.9 |
| Checks ITN for holes | ||
| Yes | 114 | 54.8 |
| No | 94 | 45.2 |
| ITN condition | ||
| Good | 72 | 34.6 |
| Somehow | 64 | 30.8 |
| Not sure | 72 | 34.6 |
| Other prevention methods | ||
| Long cloth | 76 | 36.5 |
| Repellant | 60 | 28.8 |
| None | 72 | 34.6 |
| Source of malaria information | ||
| VHT | 46 | 22.1 |
| Health workers | 47 | 22.6 |
| Radio | 53 | 25.5 |
| Others | 62 | 29.8 |
| Knows malaria symptoms | ||
| No | 81 | 38.9 |
| Not sure | 56 | 26.9 |
| Yes | 71 | 34.1 |
| Knows malaria effects in pregnancy | ||
| No | 71 | 34.1 |
| Not sure | 55 | 26.4 |
| Yes | 82 | 39.4 |
| Distance to health facility | ||
| Far | 100 | 48.1 |
| Near | 108 | 51.9 |
| Main water source | ||
| Natural | 105 | 50.5 |
| Improved | 103 | 49.5 |
| Roof type | ||
| Grass thatch | 60 | 28.8 |
| Corrugated iron | 69 | 33.2 |
| Good iron sheet | 79 | 38.0 |
| Wall type | ||
| Mud | 94 | 45.2 |
| Cemented | 114 | 54.8 |
| Floor type | ||
| Mud | 106 | 51.0 |
| Cemented | 102 | 49.0 |
| Last indoor residual spraying | ||
| <2 years | 48 | 23.1 |
| >2 years | 87 | 41.8 |
| Not at all | 73 | 35.1 |
| Covers windows/doors with ITN | ||
| Yes | 105 | 50.5 |
| No | 103 | 49.5 |
Table 1: Baseline sociodemographic and obstetric characteristics of pregnant women
| Table 2: Bivariate associations (crude odds ratios) between risk factors and malaria RDT positivity | |||
|---|---|---|---|
| Characteristics | Total N | RDT positive n (%) | Crude OR (95% CI) |
| Age group | |||
| <20 years | 46 | 19 (41.3) | 1.00 (ref) |
| 20–24 years | 48 | 15 (31.3) | 0.64 (0.28–1.45) |
| 25–29 years | 48 | 18 (37.5) | 0.86 (0.38–1.92) |
| 30–35 years | 41 | 16 (39.0) | 0.91 (0.39–2.12) |
| 35+ years | 25 | 10 (40.0) | 0.95 (0.36–2.50) |
| Occupation | |||
| Farmer | 43 | 14 (32.6) | 1.00 (ref) |
| Trader | 47 | 19 (40.4) | 1.41 (0.60–3.31) |
| Formally employed | 61 | 25 (41.0) | 1.44 (0.64–3.24) |
| Unemployed | 57 | 20 (35.1) | 1.12 (0.49–2.58) |
| Marital status | |||
| Married | 110 | 41 (37.3) | 1.00 (ref) |
| Divorced or single | 98 | 37 (37.8) | 1.02 (0.59–1.77) |
| Education | |||
| Non formal | 45 | 16 (35.6) | 1.00 (ref) |
| Primary | 53 | 22 (41.5) | 1.29 (0.58–2.86) |
| Secondary | 57 | 20 (35.1) | 0.98 (0.44–2.18) |
| Tertiary | 53 | 20 (37.7) | 1.10 (0.49–2.45) |
| Residence | |||
| Rural | 106 | 38 (35.8) | 1.00 (ref) |
| Urban | 102 | 40 (39.2) | 1.16 (0.66–2.02) |
| ITN condition | |||
| Good | 72 | 25 (34.7) | 1.00 (ref) |
| Somehow | 64 | 22 (34.4) | 0.99 (0.49–1.98) |
| Not sure | 72 | 31 (43.1) | 1.43 (0.73–2.79) |
| Checks ITN for holes | |||
| Yes | 114 | 39 (34.2) | 1.00 (ref) |
| No | 94 | 39 (41.5) | 1.37 (0.78–2.40) |
| Last indoor residual spraying | |||
| <2 years | 48 | 15 (31.3) | 1.00 (ref) |
| >2 years | 87 | 34 (39.1) | 1.41 (0.68–2.95) |
| Not at all | 73 | 29 (39.7) | 1.45 (0.68–3.08) |
| Sleeps under ITN | |||
| Yes | 90 | 30 (33.3) | 1.00 (ref) |
| No | 118 | 48 (40.7) | 1.37 (0.78–2.42) |
Reference category for each variable is indicated by 1.00 (ref)
Table 2: Bivariate associations (crude odds ratios) between risk factors and malaria RDT positivity
| Table 3: Adjusted odds ratios for factors associated with malaria RDT positivity (multivariable logistic regression) | ||
|---|---|---|
| Variable | aOR (95% CI) | p-value |
| Age group (ref: <20 years) | ||
| 20–24 years | 0.37 (0.11–1.24) | 0.107 |
| 25–29 years | 0.47 (0.13–1.60) | 0.225 |
| 30–35 years | 0.29 (0.07–1.20) | 0.088 |
| 35+ years | 0.71 (0.18–2.83) | 0.628 |
| Occupation (ref: Farmer) | ||
| Formally employed | 1.47 (0.50–4.35) | 0.488 |
| Trader | 0.60 (0.16–2.22) | 0.445 |
| Unemployed | 0.81 (0.26–2.49) | 0.714 |
| Marital status (ref: Divorced or single) | ||
| Married | 0.95 (0.40–2.25) | 0.910 |
| Education (ref: Non formal) | ||
| Primary | 0.92 (0.29–2.89) | 0.886 |
| Secondary | 1.13 (0.34–3.67) | 0.845 |
| Tertiary | 0.84 (0.26–2.74) | 0.777 |
| Religion (ref: Christian) | ||
| Moslem | 0.74 (0.31–1.79) | 0.508 |
| Residence (ref: Rural) | ||
| Urban | 0.69 (0.29–1.63) | 0.394 |
| Family income (ref: ≤100k) | ||
| ≤250k | 0.13 (0.04–0.45) | 0.001 |
| ≤500k | 0.49 (0.17–1.42) | 0.189 |
| >500k | 0.19 (0.06–0.60) | 0.005 |
| Trimester (ref: First) | ||
| Second | 1.42 (0.52–3.88) | 0.496 |
| Third | 1.56 (0.55–4.38) | 0.399 |
| Gravidity (ref: Gravida1) | ||
| Gravida2 | 2.33 (0.86–6.33) | 0.097 |
| Multigravida | 1.38 (0.51–3.73) | 0.529 |
| Trimester of first ANC (ref: First) | ||
| Second | 0.44 (0.16–1.25) | 0.123 |
| Third | 0.40 (0.13–1.17) | 0.095 |
| Number of ANC visits (ref: 1–3) | ||
| 4–6 | 0.63 (0.24–1.65) | 0.348 |
| 7+ | 0.77 (0.28–2.14) | 0.617 |
| IPT start week (ref: <14) | ||
| >14 | 0.83 (0.37–1.86) | 0.652 |
| Knows about IPT (ref: No) | ||
| Yes | 1.76 (0.72–4.32) | 0.216 |
| Sleeps under ITN (ref: No) | ||
| Yes | 0.25 (0.11–0.60) | 0.002 |
| Frequency of sleeping under ITN (ref: All times) | ||
| Not at all | 1.19 (0.42–3.37) | 0.749 |
| Sometimes | 1.45 (0.53–3.95) | 0.749 |
| Checks ITN for holes (ref: No) | ||
| Yes | 5.43 (2.19–13.48) | <0.001 |
| ITN condition (ref: Good) | ||
| Not sure | 3.38 (1.28–8.90) | 0.014 |
| Somehow | 0.57 (0.20–1.59) | 0.279 |
| Other prevention methods (ref: Long cloth) | ||
| Repellant | 1.35 (0.55–3.32) | 0.519 |
| Source of malaria information (ref: Health workers) | ||
| Radio | 1.70 (0.64–4.52) | 0.286 |
| VHT | 0.98 (0.34–2.81) | 0.963 |
| Knows malaria symptoms (ref: No) | ||
| Not sure | 0.35 (0.13–0.94) | 0.037 |
| Yes | 0.61 (0.21–1.76) | 0.363 |
| Knows malaria effects (ref: No) | ||
| Not sure | 0.49 (0.18–1.28) | 0.143 |
| Yes | 2.25 (0.83–6.14) | 0.112 |
| Distance to health facility (ref: Far) | ||
| Near | 1.39 (0.59–3.29) | 0.454 |
| Main water source (ref: Improved) | ||
| Natural | 0.96 (0.37–2.47) | 0.933 |
| Roof type (ref: Corrugated iron) | ||
| Good iron | 1.66 (0.56–4.94) | 0.362 |
| Grass thatch | 1.12 (0.38–3.31) | 0.840 |
| Wall type (ref: Cemented) | ||
| Mud | 1.77 (0.71–4.40) | 0.218 |
| Floor type (ref: Cemented) | ||
| Mud | 0.61 (0.24–1.55) | 0.297 |
| Last indoor residual spraying (ref: <2 years) | ||
| >2 years | 0.81 (0.28–2.32) | 0.698 |
| Not at all | 3.04 (0.99–9.31) | 0.052 |
| Covers windows/doors with ITN (ref: No) | ||
| Yes | 1.26 (0.55–2.91) | 0.585 |
Reference categories are indicated in parentheses. aOR = adjusted odds ratio; CI = confidence interval.
Table 3: Adjusted odds ratios for factors associated with malaria RDT positivity (multivariable logistic regression)
| Table 4: Adjusted odds ratios for factors associated with malaria RDT positivity | |||
|---|---|---|---|
| Variable | Odds Ratio | 95% CI | p-value |
| Checks ITN for holes: Yes | 5.43 | 2.19–13.48 | <0.001 |
| ITN condition: Not sure | 3.38 | 1.28–8.90 | 0.014 |
| Last indoor residual spraying: Not at all | 3.04 | 0.99–9.31 | 0.052 |
| Gravidity: Gravida2 | 2.33 | 0.86–6.33 | 0.097 |
| Knows malaria effects in pregnancy: Yes | 2.25 | 0.83–6.14 | 0.112 |
| Wall type: Mud | 1.77 | 0.71–4.40 | 0.218 |
| Knows about IPT: Yes | 1.76 | 0.72–4.32 | 0.216 |
| Source of malaria information: Radio | 1.70 | 0.64–4.52 | 0.286 |
| Roof type: Good iron sheet | 1.66 | 0.56–4.94 | 0.362 |
| Trimester: Third | 1.56 | 0.55–4.38 | 0.399 |
| Occupation: Formally Employed | 1.47 | 0.50–4.35 | 0.488 |
| Frequency of sleeping under ITN: Sometimes | 1.45 | 0.53–3.95 | 0.466 |
| Trimester: Second | 1.42 | 0.52–3.88 | 0.496 |
| Distance to health facility: Near | 1.39 | 0.59–3.29 | 0.454 |
| Gravidity: Multigravida | 1.38 | 0.51–3.73 | 0.529 |
| Other prevention methods: Repellant | 1.35 | 0.55–3.32 | 0.519 |
| Covers windows/doors with ITN: Yes | 1.26 | 0.55–2.91 | 0.585 |
| Frequency of sleeping under ITN: Not at all | 1.19 | 0.42–3.37 | 0.749 |
| Education: Secondary | 1.13 | 0.34–3.67 | 0.845 |
| Roof type: Grass thatch | 1.12 | 0.38–3.31 | 0.840 |
| Source of malaria information: VHT | 0.98 | 0.34–2.81 | 0.963 |
| Main water source: Natural | 0.96 | 0.37–2.47 | 0.933 |
| Marital status: Married | 0.95 | 0.40–2.25 | 0.910 |
| Education: Primary | 0.92 | 0.29–2.89 | 0.886 |
| Education: Tertiary | 0.84 | 0.26–2.74 | 0.777 |
| IPT start week: >14 weeks | 0.83 | 0.37–1.86 | 0.652 |
| Occupation: Unemployed | 0.81 | 0.26–2.49 | 0.714 |
| Last indoor residual spraying: >2 years | 0.81 | 0.28–2.32 | 0.698 |
| Number of ANC visits: 7+ | 0.77 | 0.28–2.14 | 0.617 |
| Religion: Moslem | 0.74 | 0.31–1.79 | 0.508 |
| Age group: 35+ years | 0.71 | 0.18–2.83 | 0.628 |
| Residence: Urban | 0.69 | 0.29–1.63 | 0.394 |
| Number of ANC visits: 4–6 | 0.63 | 0.24–1.65 | 0.348 |
| Knows malaria symptoms: Yes | 0.61 | 0.21–1.76 | 0.363 |
| Floor type: Mud | 0.61 | 0.24–1.55 | 0.297 |
| Occupation: Trader | 0.60 | 0.16–2.22 | 0.445 |
| ITN condition: Somehow | 0.57 | 0.20–1.59 | 0.279 |
| Family income: ≤500k | 0.49 | 0.17–1.42 | 0.189 |
| Knows malaria effects in pregnancy: Not sure | 0.49 | 0.18–1.28 | 0.143 |
| Age group: 25–29 years | 0.47 | 0.13–1.60 | 0.225 |
| Trimester of first ANC: Second | 0.44 | 0.16–1.25 | 0.123 |
| Trimester of first ANC: Third | 0.40 | 0.13–1.17 | 0.095 |
| Age group: 20–24 years | 0.37 | 0.11–1.24 | 0.107 |
| Knows malaria symptoms: Not sure | 0.35 | 0.13–0.94 | 0.037 |
| Age group: 30–35 years | 0.29 | 0.07–1.20 | 0.088 |
| Sleeps under ITN: Yes | 0.25 | 0.11–0.60 | 0.002 |
| Family income: >500k | 0.19 | 0.06–0.60 | 0.005 |
| Family income: ≤250k | 0.13 | 0.04–0.45 | 0.001 |
Reference categories for each variable are omitted from the list. aOR = adjusted odds ratio; CI = confidence interval.
Table 4: Adjusted odds ratios for factors associated with malaria RDT positivity
Onyera Douglas1, Opoke Robert1, Mahipal Singh Kesawat2, Ddamulira Gabriel3, Caku Jimmy1, Anywar Godwin4,5, Masika Fred Bwayo1,3,&
1Department of Biology, Faculty of Science, Muni University, P.O. Box 725, Arua, Uganda,2Faculty of Agriculture, Sri Sri University, Cuttack 754006, Odisha, India, 3Department of Horticulture, National Crops Resources Research Institute (NaCRRI), National Agricultural Research Organization, P.O. Box 7084, Kampala, Uganda, 4Department of Plant Science, Microbiology and Biotechnology, Makerere University, P.O. Box 7062, Kampala, Uganda, 5Ethnopharmacology and Zoopharmacognosy, Bernhard Nocht Institute for Tropical Medicine, Hamburg, Germany
&Corresponding author: Masika Fred Bwayo, Department of Biology, Faculty of Science, Muni University, P.O. Box 725, Arua, Uganda, Email: masikafred2012@gmail.com ORCID: 0000-0001-8188-7982
Received: 04 Aug 2026, Accepted: 08 Oct 2026, Published: 20 Oct 2026
Domain: Infectious Disease Epidemiology
Keywords: Malaria, Pregnancy, Prevalence, Risk Factors, Insecticide-Treated Bed nets
©Onyera Douglas et al. Journal of Interventional Epidemiology and Public Health (ISSN: 2664-2824). This is an Open Access article distributed under the terms of the Creative Commons Attribution International 4.0 License (https://creativecommons.org/licenses/by/4.0/), which permits unrestricted use, distribution, and reproduction in any medium, provided the original work is properly cited.
Cite this article: Onyera Douglas et al. Malaria prevalence and associated factors among pregnant women in Arua City, Northwestern Uganda. Journal of Interventional Epidemiology and Public Health. 2026; 9(4):168. https://doi.org/10.37432/jieph-d-26-00289
Introduction: Malaria during pregnancy remains an important public health challenge in sub-Saharan Africa, including Uganda. In the West Nile sub-region, particularly Arua City, evidence on the prevalence of malaria and associated factors among pregnant women remains limited despite ongoing malaria-control interventions. We determined the prevalence of malaria and identified factors associated with malaria infection among pregnant women in Ayivu Division, Arua City, Northwestern Uganda.
Methods: A cross-sectional study was conducted among 208 pregnant women recruited from Oluko Solidale HC III, Pajulu HC III, and Aroi HC III. Data were collected using questionnaires and health-facility records, while malaria infection was determined using rapid diagnostic tests (RDTs). Descriptive statistics, chi-square tests, bivariate logistic regression, and multivariable logistic regression were performed in R. Associations were reported as crude and adjusted odds ratios with 95% confidence intervals, with statistical significance set at p < 0.05.
Results: Among the 208 pregnant women enrolled, 51.0% were rural residents, 52.9% were formally married, and 37.0% were primigravidae. Overall malaria prevalence by rapid diagnostic test was 37.5% (78/208). In multivariable logistic regression, women who reported checking their ITNs for holes had higher odds of malaria (aOR = 5.43, 95% CI: 2.19–13.48, p < 0.001), while uncertainty about ITN condition was also associated with increased odds (aOR = 3.38, 95% CI: 1.28–8.90, p = 0.014). Conversely, sleeping under an ITN was associated with substantially lower odds of malaria (aOR = 0.25, 95% CI: 0.11–0.60, p = 0.002). Some family-income categories also showed protective associations, although these findings should be interpreted cautiously because of possible sparse data and residual confounding.
Conclusions: Malaria prevalence among pregnant women in Arua City remained high despite existing control interventions. The findings emphasise the importance of consistent ITN use, maintaining nets in good condition, and timely replacement of damaged nets. Strengthening community awareness and integrated vector-management approaches may further reduce malaria exposure. However, associations involving net-checking behaviour and household income should be interpreted cautiously because the cross-sectional design does not establish causality and residual confounding may remain.
Malaria, caused by parasites of the genus Plasmodium (spp., referring to multiple species of Plasmodium), remains a major global health challenge, disproportionately affecting pregnant women and children under five years [1]. Globally, an estimated 125 million women are at risk of infection annually [2]. Sub-Saharan Africa suffers the greatest burden of malaria in pregnancy, with malaria-associated severe maternal anaemia estimated to contribute to approximately 10,000 maternal deaths annually [3, 4]. Malaria poses a particular threat during pregnancy, with prevalence rates reaching 29.5% in East and Southern Africa and 35.1% in West and Central Africa. In pregnant women, malaria can lead to serious maternal and fetal complications, including anaemia, low birth weight, stillbirth, spontaneous abortion, and neonatal mortality [5].
The burden is further compounded by the substantial maternal and neonatal consequences of malaria during pregnancy. In 2018, malaria infection was associated with more than 11 million hospitalizations among pregnant women in sub-Saharan Africa, including Uganda. More than 40% of affected women experienced adverse maternal outcomes, while over 875,000 neonates were born with low birth weight [6]. Together, these challenges highlight the need to strengthen malaria prevention and control during pregnancy, improve access to timely diagnosis and effective treatment, and promote targeted interventions in malaria-endemic regions. Addressing these challenges is essential for reducing malaria-related maternal and neonatal morbidity and mortality and improving maternal and child health outcomes.
Malaria continues to be a major health issue for pregnant women in Uganda, with reported prevalence rates varying widely from 13.1% to 50.0% [7]. The disease is hyperendemic, posing a risk to more than 90% of the population across 95% of the country’s districts [8]. The impact on maternal and neonatal health is profound, accounting for 60% of anaemia-related deaths, 65% of spontaneous abortions, approximately 40% of neonatal deaths, and 31.1% of low birth weight cases annually [9]. Nationwide, malaria is responsible for a substantial portion of healthcare encounters, accounting for 30-50% of outpatient visits, 15-20% of hospital admissions, and 9-14% of inpatient deaths [10]. Despite widespread implementation of control strategies such as intermittent preventive treatment with sulfadoxine-pyrimethamine (IPTp-SP), insecticide-treated nets (ITNs), prompt diagnosis and effective treatment [5, 11], malaria remains common among pregnant women. At Arua Regional Referral Hospital, for example, a prevalence of 26.1% was recently reported using rapid diagnostic testing [12].
Malaria also imposes substantial economic costs through lost productivity and household expenditure on treatment, transport, and related needs, estimated at USD 0.41-3.88 per person per month, with poorer households bearing a disproportionate burden [13-15]. Reducing malaria prevalence to below 5% is therefore important for limiting its health and social economic consequences [16]. However, evidence on the burden and determinants of malaria among pregnant women in Uganda’s West Nile region, remains limited, particularly at lower-level health facilities where much of routine antenatal care is provided. Moreover, the persistence of malaria despite established interventions suggests a need to understand the sociodemographic, socioeconomic, behavioural, and environmental factors that may sustain transmission in this setting. Addressing this evidence gap is important for identifying locally relevant risk factors and informing targeted malaria prevention among pregnant women. Therefore, this study, determined the prevalence of malaria and associated risk factors among pregnant women attending antenatal care at three health centres within Arua City. The findings provide locally relevant evidence to guide targeted malaria prevention and control interventions, strengthen antenatal care strategies, and support more effective allocation of resources to reduce malaria-related risks among pregnant women in the West Nile region.
Study setting
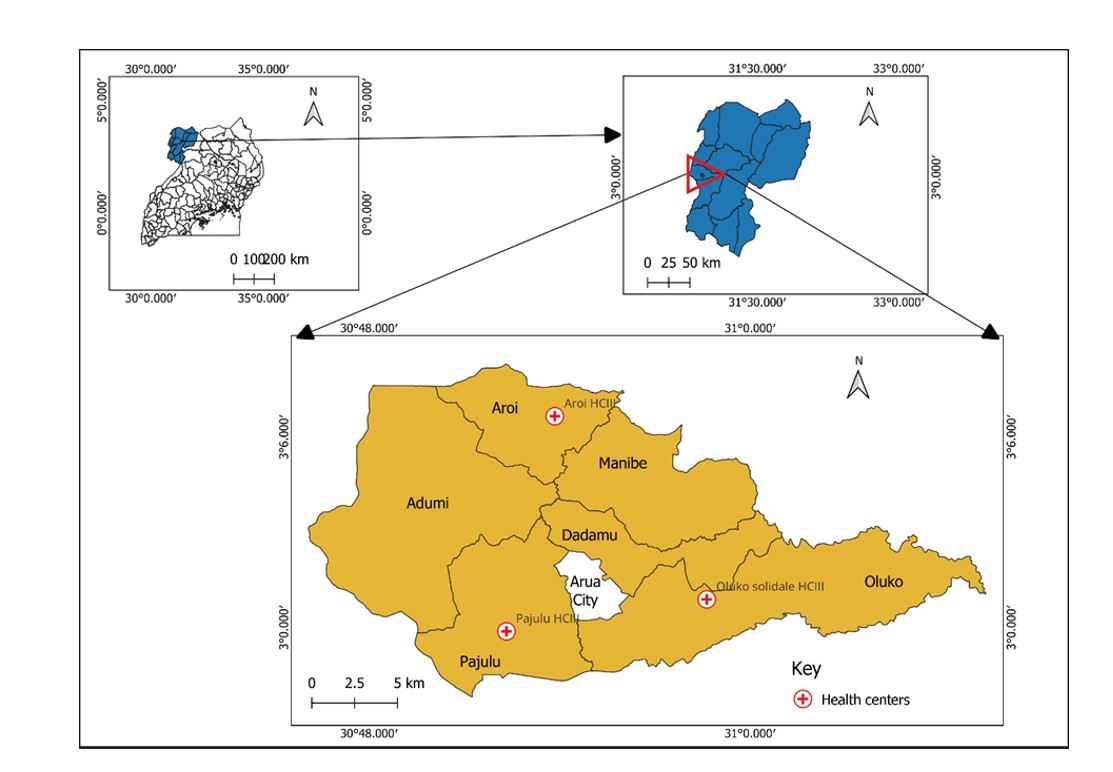
This study was carried out in Ayivu Division of Arua City, situated in the West Nile sub-region of Uganda. Arua City has a projected population of 384,656, comprising 53.8% females and 46.5% males [17]. Ayivu Division is positioned at 2°59′53″ N and 30°52′19″ E on the Eastern side of Arua City (Figure 1). Arua City is geographically surrounded by Arua District, which shares boundaries with the Democratic Republic of Congo to the west, Maracha to the north, Terego to the east, and Madi Okollo to the south. The area is ethnically diverse, dominated by the Lugbara community alongside Alur, Kakwa, Madi, and other groups. Christianity is the principal religion in Ayivu Division, whereas Islam is more prevalent in Arua Central Division.
Agriculture is the backbone of the local economy, centred on key crops such as tobacco, cassava, groundnuts, and beans, and complemented by livestock rearing, including goats, poultry, and beekeeping. The region’s tropical climate, with two rainy seasons of approximately 919 mm of rainfall annually and a mean temperature of 23.0 °C, fosters Anopheles mosquito breeding, the primary vectors of Plasmodium spp. Malaria incidence mirrors rainfall peaks, with most cases between December-February and May-July [12]. The city’s undulating terrain, River Enyau, and extensive vegetation, wetlands and croplands provide additional conducive habitats for malaria transmission.
Study design
A health facility-based quantitative cross-sectional survey design was used. Sociodemographic, socioeconomic, environmental, behavioural, and malaria-related data were collected from eligible pregnant women using a structured, pretested questionnaire. Malaria infection status was determined from records of women screened using rapid diagnostic tests (RDTs) during antenatal care between January 2022 and January 2023. Participants were selected using a multistage sampling procedure incorporating simple random sampling. The study approach was adapted from related cross-sectional studies [3, 18].
Inclusion and exclusion criteria
The study included pregnant women attending antenatal care (ANC) at the selected health facilities in Ayivu Division, Arua City, who underwent active case detection for malaria between January 2022 and January 2023. Eligible women had documented malaria screening results and were available and willing to participate in the study. The inclusion criteria were informed by approaches used in related malaria-in-pregnancy studies [1, 19]. Pregnant women who did not undergo malaria screening through active case detection during the study period, lacked documented malaria test results, or did not consent to participate were excluded from the study. Women who could not be reached during data collection were also excluded.
Sample size determination
The study sample size was estimated using the Kish [20] formula for cross-sectional studies. The formula was considered appropriate because the study sought to estimate malaria occurrence and associated factors among pregnant women at a defined point or period, requiring a sample sufficiently large to provide reliable estimates of population proportions at a specified level of precision. The sample size was calculated as follows:
\[
n = \frac{Z^2 \times p \times (1 – p)}{d^2}
\]
Where n is the desired sample size, Z is the standard deviation taken as 1.96 at a confidence interval of 95%, p is the previous malaria prevalence among pregnant mothers within the same population [12] = 26.1%, and d is the acceptable margin of error = 0.05. Therefore,
$$N = \frac{(1.96)^2 \times 0.261 \times (1 – 0.261)}{(0.05)^2} = 296 \text{ participants}$$
A total of 208 women completed the study, corresponding to 70.3% of the minimum calculated sample and 63.8% of the non-response-adjusted recruitment target. Several measures were used to maximise participation, including identifying eligible women from health-facility records, tracing selected participants within their communities with assistance from local community guides (LC1s), and providing clear information about the study before seeking voluntary participation. Nevertheless, some eligible women could not be reached or declined participation. The smaller achieved sample reduced statistical precision and may have introduced non-response bias; consequently, estimates for infrequent exposures and generalisation beyond the study population should be interpreted cautiously.
Sampling procedure and study variables
A two-stage sampling procedure was used, with simple random sampling incorporated as one of the stages rather than applied as a separate sampling approach [21]. In the first stage, Pajulu, Aroi, and Oluko Solidale Health Centres in Ayivu Division, Arua City, were selected because they provided ANC services and routinely screened pregnant women for malaria, making them appropriate sites for identifying the target population. In the second stage, records of pregnant women who attended ANC and underwent malaria screening during the study period were obtained from the selected health facilities to establish a sampling frame of eligible participants. Eligible pregnant women were selected from the sampling frame using simple random sampling, which gave each eligible woman an equal chance of selection and minimised selection bias. The randomly selected women were traced to their respective villages in Ayivu Division with the assistance of local community guides (LC1s) and invited to participate in the survey using a structured questionnaire. This final stage facilitated the recruitment of selected participants who were no longer present at the health facilities. Sociodemographic, socioeconomic, environmental, and behavioural factors were considered independent variables, while malaria infection status was the dependent variable, consistent with previous studies [3].
Data collection procedure
Primary data were collected from pregnant women using a structured questionnaire administered by trained research assistants, with support from local community guides (LC1s). Before the main data collection, the questionnaire was pre-tested among pregnant women outside the selected study sites to assess the clarity, relevance, and consistency of the questions. Necessary revisions were made based on the pre-test findings, and data obtained during the pre-test were excluded from the final study analysis. The questionnaires captured demographic information and malaria-related predictors, including use of insecticide-treated nets (ITNs), proximity to health centres, and timing of closing windows and doors, as adapted from previous studies [20, 22, 23, 24]. Secondary data were obtained from health centre databases of pregnant women actively screened for malaria at Pajulu, Aroi, and Oluko Solidale during the study period, and were used to estimate malaria prevalence as previously carried out by Desai et al. [3].
Data analysis
Data were analysed using R statistical software (version 4.5.2). Data cleaning, coding, management, and descriptive summaries were performed using the tidyverse package, while ggplot2 was used to generate graphical presentations. Before analysis, the data were checked for completeness, consistency, and appropriate coding of categorical variables. Participant characteristics were summarised using frequencies and percentages. Malaria prevalence was determined as the proportion of pregnant women with a positive rapid diagnostic test (RDT) result among women tested. Bivariate analyses were conducted to examine associations between each independent variable and malaria RDT status. Pearson’s chi-square test was used to assess associations between categorical variables and malaria infection, followed by bivariate logistic regression to estimate the strength and direction of these associations. Results were expressed as crude odds ratios (cORs) with 95% confidence intervals (CIs), with an appropriate category of each predictor designated as the reference group. Variables with p < 0.20 at the bivariate level were considered potential predictors and selected for inclusion in the multivariable analysis. This less restrictive threshold was used at the screening stage to minimise the exclusion of potentially important variables and confounders.
A multivariable logistic regression model was subsequently fitted using the glm function with a binomial distribution and logit link to assess factors independently associated with malaria infection while accounting for potential confounding. Associations from the final model were reported as adjusted odds ratios (aORs) with 95% CIs. An aOR greater than 1 indicated higher odds of malaria relative to the reference category, whereas an aOR below 1 indicated lower odds. Statistical significance in the multivariable analysis was determined at p < 0.05. All statistical tests were two-tailed, and the results were presented in tables and figures to show the magnitude, direction, and precision of the observed associations.
Ethical consideration
Ethical approval for the study was obtained from the Lacor Hospital Institutional Research and Ethics Committee, Gulu City, Uganda (Protocol No. LACOR-2023-277). The study was conducted in accordance with the ethical guidelines and regulations of the Uganda National Council for Science and Technology (UNCST). Before data collection, informed consent was obtained from all participating pregnant women or, where applicable, their legally authorized representatives. Participation was voluntary, and respondents were informed about the purpose of the study and their right to withdraw without consequence. Confidentiality and privacy were maintained throughout data collection, analysis, and reporting, with participants’ identifying information protected from unauthorized disclosure.
Study participants and baseline characteristics
A total of 208 pregnant women were interviewed during the study. Participants varied in their sociodemographic characteristics. Women aged 20-24 years and 25-29 years each accounted for 23.1%; 29.3% were formally employed, and 52.9% were married. Regarding education, 27.4% had secondary education and 25.5% had tertiary education. Rural residents comprised 51.0% of participants, and 28.8% reported a monthly family income of UGX 100,000 or less. Overall, 37.0% were primigravidae, and 38.0% had attended one to three antenatal care visits (Table 1).
Prevalence of malaria
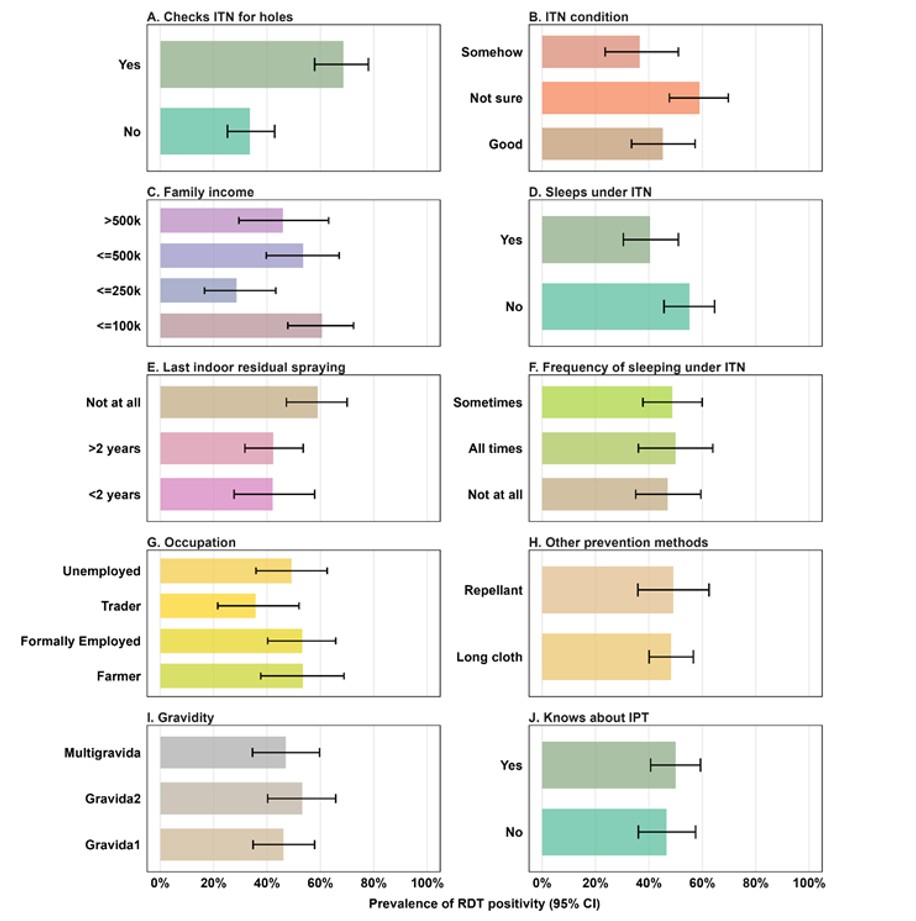
Overall malaria prevalence by rapid diagnostic test (RDT) was 37.5% (78 out of 208 women). Figure 2 displays the prevalence with 95% confidence intervals (CI) for the ten risk factors most strongly associated with malaria (ordered by statistical significance). The highest prevalence was observed among women who were unsure of their insecticide treated net (ITN) condition (43.1%), those who did not check their ITN for holes before sleeping (41.5%), those who were formally employed (41.0%), and those whose houses had never been sprayed with insecticide (indoor residual spraying, IRS) (39.7%) (Figure 2).
Bivariate associations
Overall malaria prevalence, as determined by rapid diagnostic test (RDT), was 37.5%. Although malaria prevalence varied across categories, the crude odds ratios for occupation, ITN condition, checking ITNs for holes, and timing of indoor residual spraying had 95% confidence intervals that included 1.00. These category-specific estimates therefore did not demonstrate statistically significant differences from their respective reference categories. The overall chi-square tests reported in Table 2 should be interpreted separately from the individual crude odds ratios. The highest prevalence was observed among women who were unsure of their insecticide treated net (ITN) condition (43.1%), those who did not check their ITN for holes before sleeping (41.5%), those who were formally employed (41.0%), and those whose houses had never been sprayed with insecticide (indoor residual spraying, IRS) (39.7%). For example, compared to farmers, traders (cOR = 1.41, 95% CI: 0.60-3.31) and formally employed women (cOR = 1.44, 95% CI: 0.64-3.24) had higher odds of malaria, while the unemployed had similar odds (cOR = 1.12, 95% CI: 0.49-2.58). Women who reported “not sure” about their ITN condition had higher odds compared to those with good ITNs (cOR = 1.43, 95% CI: 0.73-2.79). Those who did not check their ITN for holes had elevated odds (cOR = 1.37, 95% CI: 0.78-2.40). Relative to women whose houses were sprayed within the last two years, those whose houses were sprayed more than two years ago (cOR = 1.41, 95% CI: 0.68-2.95) and those never sprayed (cOR = 1.45, 95% CI: 0.68-3.08) had higher odds of infection.
Multivariable analysis
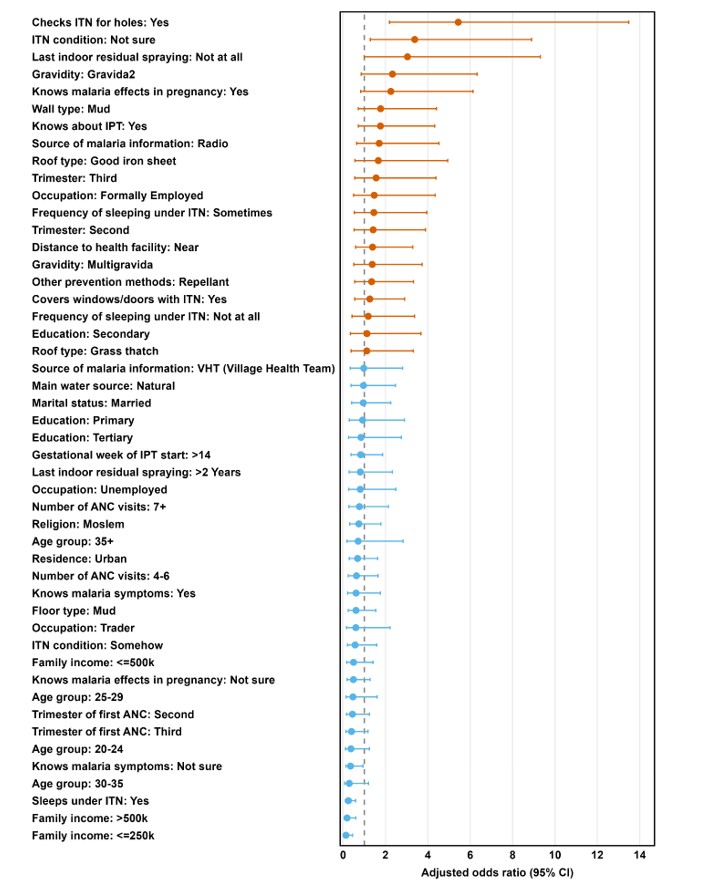
Variables meeting the prespecified screening criterion of p < 0.20 in the bivariate analysis were considered for inclusion in the multivariable logistic regression model. After adjustment, checking ITNs for holes was associated with higher odds of malaria compared with not checking them (aOR = 5.43, 95% CI: 2.19–13.48, p < 0.001). Women who were unsure about their ITN condition also had higher odds of malaria than those reporting nets in good condition (aOR = 3.38, 95% CI: 1.28–8.90, p = 0.014), while sleeping under an ITN was associated with lower odds (aOR = 0.25, 95% CI: 0.11–0.60, p = 0.002). Some family-income categories were also associated with lower odds, but these estimates should be interpreted cautiously because of possible sparse data and residual confounding. Figure 3 presents the direction, magnitude, and precision of the adjusted associations reported in Table 3.
This study assessed the prevalence and risk factors of malaria among pregnant women in Ayivu Division, Arua City. The overall malaria prevalence by rapid diagnostic test (RDT) was 37.5% (78/208), which is considerably higher than the 26.1% reported by Mangusho et al. [12] at Arua Regional Referral Hospital, as well as the 11.1% in Kole and Kyenjojo [24], the 15.5% in Mulago National Referral Hospital [25], and the national prevalence of 20.5% from the 2023 Uganda Demographic and Health Survey [24]. This high burden suggests that pregnant women in Arua City remain at substantial risk despite ongoing control measures.
The high prevalence observed may be attributed to poor adherence to existing malaria control interventions and increased abundance of malaria vectors under favourable environmental conditions in Uganda. According to the Ministry of Health [26], intermittent preventive treatment with sulfadoxine-pyrimethamine (IPTp-SP) and insecticide-treated nets (ITNs) are routinely provided. In practice, effective ITN use can reduce placental parasitemia by 23%, while receiving three or more doses of IPTp-SP can lower peripheral parasitemia by up to 56% [27]. In our study, however, only 43.3% of women reported sleeping under an ITN, and many either had nets in poor condition or were uncertain of their net’s status, underscoring a gap between intervention availability and effective utilisation. Occupation was not significantly associated with malaria in bivariate analysis. This differs from previous studies from Nigeria [28], where pregnant traders had a greater risk, and from Ethiopia [29], where occupation was a risk factor in Gechi District.
However, the wide confidence intervals and the lack of significance for other occupation categories warrant caution. ITN use and condition were significantly associated with malaria infection among pregnant women. Women who reported checking their ITNs for holes had higher odds of malaria than those who did not (p < 0.001). Although counterintuitive, this finding may reflect reverse causation rather than a direct effect of net-checking behaviour. Women who suspected malaria infection or perceived themselves to be at greater risk, particularly those living in high-risk areas, may have been more likely to inspect their nets for damage. Net checking should therefore be interpreted as a marker of risk awareness rather than a direct risk factor for malaria. Similarly, women who were unsure about the condition of their ITNs had higher odds of malaria than those with nets reported to be in good condition (p = 0.014), supporting evidence from Kenya that damaged ITNs are associated with increased malaria infection [30, 31]. Consequently, sleeping under an ITN was associated with lower odds of malaria (p = 0.002), consistent with reports from other parts of Uganda [24] and from Dembia District, Ethiopia, where ITN ownership reduced malaria by up to 90% [32]. ITNs work by repelling, killing, or sterilising mosquitoes, and when used correctly, can reduce placental parasitaemia caused by Plasmodium falciparum by 23% [26].
Family income showed a non-linear association with malaria, with both the ≤ 250,000 UGX and >500,000 UGX categories having lower odds than the reference group (≤100,000 UGX). The absence of a clear income-related gradient suggests that income alone may not explain malaria risk. Ecologically, malaria exposure is also shaped by where and how households live, including proximity to mosquito-breeding sites, housing quality, drainage, vegetation, population mobility, and access to preventive measures. Thus, the apparent protective association in the lower-income category may reflect differences in these environmental and household exposures, sparse data, or residual confounding rather than a direct protective effect of low income. Conversely, higher-income households may have better housing, preventive measures, and access to healthcare, which could reduce exposure. Previous studies have nevertheless associated poverty with increased malaria risk and limited access to prevention and treatment [33-35]. Gravida 2 showed increased but non-significant odds of malaria (p = 0.097), consistent with reports from Ethiopia [36, 37], whereas Mangusho et al. [12] reported greater risk during first pregnancies, potentially reflecting differences in acquired immunity.
Changes in maternal immunity during pregnancy may influence susceptibility to malaria, particularly during early gestation [38, 39]. However, Last indoor residual spraying (IRS) was not significantly associated with malaria infection after adjustment, indicating that its independent protective effect could not be established in this study. This may reflect differences in spraying coverage and timing, residual insecticide effectiveness, mosquito exposure outside sprayed households, or limited statistical power. Our findings agree with studies in other parts of Uganda [40] and Ghana [41] that IRS reduces malaria risk. However, a study from neighbouring Lira and Kole districts found no significant impact of IRS on vector densities in non-IRS households [42]. Nonetheless, the West Nile sub-region has experienced a significant reduction in malaria transmission since 2022 [43], supporting continued IRS use. Longitudinal, ecological and genetic studies of Anopheles mosquitoes are needed to understand the entomological impact of IRS in northern Uganda.
Several expected risk factors, including age, education, religion, residence, number of ANC visits, IPT knowledge, source of information, knowledge of symptoms/effects, distance to facility, water source, roof/wall/floor type, and covering windows/doors, were not significantly associated in bivariate or multivariable analyses. This may reflect the relatively small sample size or the fact that malaria risk in this population is driven more by behavioural factors (ITN use, checking nets) than by structural determinants.
To achieve a malaria-free Uganda, a paradigm shift from single-sector to multi-sectoral strategies is paramount, engaging stakeholders from health, environment, agriculture, education, finance, industry, and local communities. Furthermore, a comprehensive Integrated Vector Management (IVM) system must be strengthened, incorporating evidence-based decision-making, multi-sector collaboration, advocacy, social mobilization, legislation, and capacity building [44].
Study limitations
This study offers valuable insights, though certain considerations should be noted. First, the achieved sample was below the planned recruitment target, which reduced precision and may have introduced non-response bias if participants differed systematically from eligible women who could not be reached or declined participation. Second, the cross-sectional design is well-suited for identifying associations, but it does not allow causal inference. Third, ITN use, net-checking behaviour, and related practices were self-reported, which reflects participants’ perspectives, though it may be influenced by recall or social desirability bias. Fourth, rapid diagnostic tests may underestimate malaria prevalence in pregnancy because placental sequestration can reduce parasite detection in peripheral blood, although RDTs remain practical and widely used in field settings [45]. Fifth, although parasite density, species, and molecular diagnostics (e.g., PCR) were not assessed, the study nonetheless provides actionable local evidence using feasible tools. Taken together, these findings contribute an important context for strengthening malaria control interventions in Arua City.
This study found a high prevalence of malaria (37.5%) among pregnant women attending antenatal care in Arua City, exceeding previous local and national estimates. The most important associated factors were checking ITNs for holes, which may indicate reverse causation or net damage, being unsure of ITN condition, and not sleeping under an ITN. Occupation, gravidity, and indoor residual spraying were not independently significant after adjustment. These findings support strengthening ITN distribution, promoting consistent and correct mosquito net use, and ensuring timely replacement of damaged nets. Community mobilisation, regular net inspection, and targeted health education for pregnant women and their families are critical. Health facilities should integrate routine ITN checks and replacement into antenatal care. Multi sectoral approaches, including integrated vector management and addressing socio economic barriers, will be essential to reduce malaria burden in this high risk population. Future larger longitudinal studies with longer follow-up are recommended to clarify the role of occupation, income, and gravidity, and to assess the impact of behavioural interventions on ITN use and malaria incidence.
What is already known about the topic
What this study adds
Conceptualization: Douglas Onyera, Fred Bwayo Masika
Methodology: Douglas Onyera, Robert Opoke, Kesawat Singh Mahipal, Godwin Anywar, Caku Jimmy, Fred Bwayo Masika
Data Curation: Fred Bwayo Masika
Formal Analysis: Douglas Onyera, Fred Bwayo Masika
Investigation: Gabriel Ddamulira, Caku Jimmy, Fred Bwayo Masika
Project Administration: Godwin Anywar
Software: Fred Bwayo Masika
Validation: Robert Opoke, Gabriel Ddamulira, Godwin Anywar, Caku Jimmy, Fred Bwayo Masika
Visualization: Kesawat Singh Mahipal, Gabriel Ddamulira, Godwin Anywar, Caku Jimmy, Fred Bwayo Masika
Supervision: Kesawat Singh Mahipal, Gabriel Ddamulira, Fred Bwayo Masika
Writing – Original Draft: Douglas Onyera, Robert Opoke, Kesawat Singh Mahipal, Gabriel Ddamulira, Godwin Anywar, Caku Jimmy, Fred Bwayo Masika
Writing – Review & Editing: Douglas Onyera, Robert Opoke, Kesawat Singh Mahipal, Gabriel Ddamulira, Godwin Anywar, Caku Jimmy, Fred Bwayo Masika
| Table 1: Baseline sociodemographic and obstetric characteristics of pregnant women | ||
|---|---|---|
| Characteristics | n | % |
| Age group (years) | ||
| <20 | 46 | 22.1 |
| 20–24 | 48 | 23.1 |
| 25–29 | 48 | 23.1 |
| 30–35 | 41 | 19.7 |
| 35+ | 25 | 12.0 |
| Occupation | ||
| Farmer | 43 | 20.7 |
| Trader | 47 | 22.6 |
| Formally employed | 61 | 29.3 |
| Unemployed | 57 | 27.4 |
| Marital status | ||
| Married | 110 | 52.9 |
| Divorced or single | 98 | 47.1 |
| Education | ||
| Non formal | 45 | 21.6 |
| Primary | 53 | 25.5 |
| Secondary | 57 | 27.4 |
| Tertiary | 53 | 25.5 |
| Religion | ||
| Christian | 115 | 55.3 |
| Moslem | 93 | 44.7 |
| Residence | ||
| Rural | 106 | 51.0 |
| Urban | 102 | 49.0 |
| Family monthly income (UGX) | ||
| ≤100,000 | 60 | 28.8 |
| ≤250,000 | 55 | 26.4 |
| ≤500,000 | 56 | 26.9 |
| >500,000 | 37 | 17.8 |
| Trimester of pregnancy | ||
| First | 70 | 33.7 |
| Second | 66 | 31.7 |
| Third | 72 | 34.6 |
| Gravidity | ||
| Gravida 1 | 77 | 37.0 |
| Gravida 2 | 68 | 32.7 |
| Multigravida (≥3) | 63 | 30.3 |
| Trimester of first ANC visit | ||
| First | 73 | 35.1 |
| Second | 60 | 28.8 |
| Third | 75 | 36.1 |
| Number of ANC visits | ||
| 1–3 | 79 | 38.0 |
| 4–6 | 72 | 34.6 |
| 7+ | 57 | 27.4 |
| IPT start week | ||
| <14 weeks | 106 | 51.0 |
| >14 weeks | 102 | 49.0 |
| Knows about IPT | ||
| No | 114 | 54.8 |
| Yes | 94 | 45.2 |
| Sleeps under ITN | ||
| Yes | 90 | 43.3 |
| No | 118 | 56.7 |
| Frequency of sleeping under ITN | ||
| Not at all | 70 | 33.7 |
| Some night | 82 | 39.4 |
| All night | 56 | 26.9 |
| Checks ITN for holes | ||
| Yes | 114 | 54.8 |
| No | 94 | 45.2 |
| ITN condition | ||
| Good | 72 | 34.6 |
| Somehow | 64 | 30.8 |
| Not sure | 72 | 34.6 |
| Other prevention methods | ||
| Long cloth | 76 | 36.5 |
| Repellant | 60 | 28.8 |
| None | 72 | 34.6 |
| Source of malaria information | ||
| VHT | 46 | 22.1 |
| Health workers | 47 | 22.6 |
| Radio | 53 | 25.5 |
| Others | 62 | 29.8 |
| Knows malaria symptoms | ||
| No | 81 | 38.9 |
| Not sure | 56 | 26.9 |
| Yes | 71 | 34.1 |
| Knows malaria effects in pregnancy | ||
| No | 71 | 34.1 |
| Not sure | 55 | 26.4 |
| Yes | 82 | 39.4 |
| Distance to health facility | ||
| Far | 100 | 48.1 |
| Near | 108 | 51.9 |
| Main water source | ||
| Natural | 105 | 50.5 |
| Improved | 103 | 49.5 |
| Roof type | ||
| Grass thatch | 60 | 28.8 |
| Corrugated iron | 69 | 33.2 |
| Good iron sheet | 79 | 38.0 |
| Wall type | ||
| Mud | 94 | 45.2 |
| Cemented | 114 | 54.8 |
| Floor type | ||
| Mud | 106 | 51.0 |
| Cemented | 102 | 49.0 |
| Last indoor residual spraying | ||
| <2 years | 48 | 23.1 |
| >2 years | 87 | 41.8 |
| Not at all | 73 | 35.1 |
| Covers windows/doors with ITN | ||
| Yes | 105 | 50.5 |
| No | 103 | 49.5 |
| Table 2: Bivariate associations (crude odds ratios) between risk factors and malaria RDT positivity | |||
|---|---|---|---|
| Characteristics | Total N | RDT positive n (%) | Crude OR (95% CI) |
| Age group | |||
| <20 years | 46 | 19 (41.3) | 1.00 (ref) |
| 20–24 years | 48 | 15 (31.3) | 0.64 (0.28–1.45) |
| 25–29 years | 48 | 18 (37.5) | 0.86 (0.38–1.92) |
| 30–35 years | 41 | 16 (39.0) | 0.91 (0.39–2.12) |
| 35+ years | 25 | 10 (40.0) | 0.95 (0.36–2.50) |
| Occupation | |||
| Farmer | 43 | 14 (32.6) | 1.00 (ref) |
| Trader | 47 | 19 (40.4) | 1.41 (0.60–3.31) |
| Formally employed | 61 | 25 (41.0) | 1.44 (0.64–3.24) |
| Unemployed | 57 | 20 (35.1) | 1.12 (0.49–2.58) |
| Marital status | |||
| Married | 110 | 41 (37.3) | 1.00 (ref) |
| Divorced or single | 98 | 37 (37.8) | 1.02 (0.59–1.77) |
| Education | |||
| Non formal | 45 | 16 (35.6) | 1.00 (ref) |
| Primary | 53 | 22 (41.5) | 1.29 (0.58–2.86) |
| Secondary | 57 | 20 (35.1) | 0.98 (0.44–2.18) |
| Tertiary | 53 | 20 (37.7) | 1.10 (0.49–2.45) |
| Residence | |||
| Rural | 106 | 38 (35.8) | 1.00 (ref) |
| Urban | 102 | 40 (39.2) | 1.16 (0.66–2.02) |
| ITN condition | |||
| Good | 72 | 25 (34.7) | 1.00 (ref) |
| Somehow | 64 | 22 (34.4) | 0.99 (0.49–1.98) |
| Not sure | 72 | 31 (43.1) | 1.43 (0.73–2.79) |
| Checks ITN for holes | |||
| Yes | 114 | 39 (34.2) | 1.00 (ref) |
| No | 94 | 39 (41.5) | 1.37 (0.78–2.40) |
| Last indoor residual spraying | |||
| <2 years | 48 | 15 (31.3) | 1.00 (ref) |
| >2 years | 87 | 34 (39.1) | 1.41 (0.68–2.95) |
| Not at all | 73 | 29 (39.7) | 1.45 (0.68–3.08) |
| Sleeps under ITN | |||
| Yes | 90 | 30 (33.3) | 1.00 (ref) |
| No | 118 | 48 (40.7) | 1.37 (0.78–2.42) |
| Table 3: Adjusted odds ratios for factors associated with malaria RDT positivity (multivariable logistic regression) | ||
|---|---|---|
| Variable | aOR (95% CI) | p-value |
| Age group (ref: <20 years) | ||
| 20–24 years | 0.37 (0.11–1.24) | 0.107 |
| 25–29 years | 0.47 (0.13–1.60) | 0.225 |
| 30–35 years | 0.29 (0.07–1.20) | 0.088 |
| 35+ years | 0.71 (0.18–2.83) | 0.628 |
| Occupation (ref: Farmer) | ||
| Formally employed | 1.47 (0.50–4.35) | 0.488 |
| Trader | 0.60 (0.16–2.22) | 0.445 |
| Unemployed | 0.81 (0.26–2.49) | 0.714 |
| Marital status (ref: Divorced or single) | ||
| Married | 0.95 (0.40–2.25) | 0.910 |
| Education (ref: Non formal) | ||
| Primary | 0.92 (0.29–2.89) | 0.886 |
| Secondary | 1.13 (0.34–3.67) | 0.845 |
| Tertiary | 0.84 (0.26–2.74) | 0.777 |
| Religion (ref: Christian) | ||
| Moslem | 0.74 (0.31–1.79) | 0.508 |
| Residence (ref: Rural) | ||
| Urban | 0.69 (0.29–1.63) | 0.394 |
| Family income (ref: ≤100k) | ||
| ≤250k | 0.13 (0.04–0.45) | 0.001 |
| ≤500k | 0.49 (0.17–1.42) | 0.189 |
| >500k | 0.19 (0.06–0.60) | 0.005 |
| Trimester (ref: First) | ||
| Second | 1.42 (0.52–3.88) | 0.496 |
| Third | 1.56 (0.55–4.38) | 0.399 |
| Gravidity (ref: Gravida1) | ||
| Gravida2 | 2.33 (0.86–6.33) | 0.097 |
| Multigravida | 1.38 (0.51–3.73) | 0.529 |
| Trimester of first ANC (ref: First) | ||
| Second | 0.44 (0.16–1.25) | 0.123 |
| Third | 0.40 (0.13–1.17) | 0.095 |
| Number of ANC visits (ref: 1–3) | ||
| 4–6 | 0.63 (0.24–1.65) | 0.348 |
| 7+ | 0.77 (0.28–2.14) | 0.617 |
| IPT start week (ref: <14) | ||
| >14 | 0.83 (0.37–1.86) | 0.652 |
| Knows about IPT (ref: No) | ||
| Yes | 1.76 (0.72–4.32) | 0.216 |
| Sleeps under ITN (ref: No) | ||
| Yes | 0.25 (0.11–0.60) | 0.002 |
| Frequency of sleeping under ITN (ref: All times) | ||
| Not at all | 1.19 (0.42–3.37) | 0.749 |
| Sometimes | 1.45 (0.53–3.95) | 0.749 |
| Checks ITN for holes (ref: No) | ||
| Yes | 5.43 (2.19–13.48) | <0.001 |
| ITN condition (ref: Good) | ||
| Not sure | 3.38 (1.28–8.90) | 0.014 |
| Somehow | 0.57 (0.20–1.59) | 0.279 |
| Other prevention methods (ref: Long cloth) | ||
| Repellant | 1.35 (0.55–3.32) | 0.519 |
| Source of malaria information (ref: Health workers) | ||
| Radio | 1.70 (0.64–4.52) | 0.286 |
| VHT | 0.98 (0.34–2.81) | 0.963 |
| Knows malaria symptoms (ref: No) | ||
| Not sure | 0.35 (0.13–0.94) | 0.037 |
| Yes | 0.61 (0.21–1.76) | 0.363 |
| Knows malaria effects (ref: No) | ||
| Not sure | 0.49 (0.18–1.28) | 0.143 |
| Yes | 2.25 (0.83–6.14) | 0.112 |
| Distance to health facility (ref: Far) | ||
| Near | 1.39 (0.59–3.29) | 0.454 |
| Main water source (ref: Improved) | ||
| Natural | 0.96 (0.37–2.47) | 0.933 |
| Roof type (ref: Corrugated iron) | ||
| Good iron | 1.66 (0.56–4.94) | 0.362 |
| Grass thatch | 1.12 (0.38–3.31) | 0.840 |
| Wall type (ref: Cemented) | ||
| Mud | 1.77 (0.71–4.40) | 0.218 |
| Floor type (ref: Cemented) | ||
| Mud | 0.61 (0.24–1.55) | 0.297 |
| Last indoor residual spraying (ref: <2 years) | ||
| >2 years | 0.81 (0.28–2.32) | 0.698 |
| Not at all | 3.04 (0.99–9.31) | 0.052 |
| Covers windows/doors with ITN (ref: No) | ||
| Yes | 1.26 (0.55–2.91) | 0.585 |
Reference categories are indicated in parentheses. aOR = adjusted odds ratio; CI = confidence interval.
| Table 4: Adjusted odds ratios for factors associated with malaria RDT positivity | |||
|---|---|---|---|
| Variable | Odds Ratio | 95% CI | p-value |
| Checks ITN for holes: Yes | 5.43 | 2.19–13.48 | <0.001 |
| ITN condition: Not sure | 3.38 | 1.28–8.90 | 0.014 |
| Last indoor residual spraying: Not at all | 3.04 | 0.99–9.31 | 0.052 |
| Gravidity: Gravida2 | 2.33 | 0.86–6.33 | 0.097 |
| Knows malaria effects in pregnancy: Yes | 2.25 | 0.83–6.14 | 0.112 |
| Wall type: Mud | 1.77 | 0.71–4.40 | 0.218 |
| Knows about IPT: Yes | 1.76 | 0.72–4.32 | 0.216 |
| Source of malaria information: Radio | 1.70 | 0.64–4.52 | 0.286 |
| Roof type: Good iron sheet | 1.66 | 0.56–4.94 | 0.362 |
| Trimester: Third | 1.56 | 0.55–4.38 | 0.399 |
| Occupation: Formally Employed | 1.47 | 0.50–4.35 | 0.488 |
| Frequency of sleeping under ITN: Sometimes | 1.45 | 0.53–3.95 | 0.466 |
| Trimester: Second | 1.42 | 0.52–3.88 | 0.496 |
| Distance to health facility: Near | 1.39 | 0.59–3.29 | 0.454 |
| Gravidity: Multigravida | 1.38 | 0.51–3.73 | 0.529 |
| Other prevention methods: Repellant | 1.35 | 0.55–3.32 | 0.519 |
| Covers windows/doors with ITN: Yes | 1.26 | 0.55–2.91 | 0.585 |
| Frequency of sleeping under ITN: Not at all | 1.19 | 0.42–3.37 | 0.749 |
| Education: Secondary | 1.13 | 0.34–3.67 | 0.845 |
| Roof type: Grass thatch | 1.12 | 0.38–3.31 | 0.840 |
| Source of malaria information: VHT | 0.98 | 0.34–2.81 | 0.963 |
| Main water source: Natural | 0.96 | 0.37–2.47 | 0.933 |
| Marital status: Married | 0.95 | 0.40–2.25 | 0.910 |
| Education: Primary | 0.92 | 0.29–2.89 | 0.886 |
| Education: Tertiary | 0.84 | 0.26–2.74 | 0.777 |
| IPT start week: >14 weeks | 0.83 | 0.37–1.86 | 0.652 |
| Occupation: Unemployed | 0.81 | 0.26–2.49 | 0.714 |
| Last indoor residual spraying: >2 years | 0.81 | 0.28–2.32 | 0.698 |
| Number of ANC visits: 7+ | 0.77 | 0.28–2.14 | 0.617 |
| Religion: Moslem | 0.74 | 0.31–1.79 | 0.508 |
| Age group: 35+ years | 0.71 | 0.18–2.83 | 0.628 |
| Residence: Urban | 0.69 | 0.29–1.63 | 0.394 |
| Number of ANC visits: 4–6 | 0.63 | 0.24–1.65 | 0.348 |
| Knows malaria symptoms: Yes | 0.61 | 0.21–1.76 | 0.363 |
| Floor type: Mud | 0.61 | 0.24–1.55 | 0.297 |
| Occupation: Trader | 0.60 | 0.16–2.22 | 0.445 |
| ITN condition: Somehow | 0.57 | 0.20–1.59 | 0.279 |
| Family income: ≤500k | 0.49 | 0.17–1.42 | 0.189 |
| Knows malaria effects in pregnancy: Not sure | 0.49 | 0.18–1.28 | 0.143 |
| Age group: 25–29 years | 0.47 | 0.13–1.60 | 0.225 |
| Trimester of first ANC: Second | 0.44 | 0.16–1.25 | 0.123 |
| Trimester of first ANC: Third | 0.40 | 0.13–1.17 | 0.095 |
| Age group: 20–24 years | 0.37 | 0.11–1.24 | 0.107 |
| Knows malaria symptoms: Not sure | 0.35 | 0.13–0.94 | 0.037 |
| Age group: 30–35 years | 0.29 | 0.07–1.20 | 0.088 |
| Sleeps under ITN: Yes | 0.25 | 0.11–0.60 | 0.002 |
| Family income: >500k | 0.19 | 0.06–0.60 | 0.005 |
| Family income: ≤250k | 0.13 | 0.04–0.45 | 0.001 |
Reference categories for each variable are omitted from the list. aOR = adjusted odds ratio; CI = confidence interval.