
Research | Open Access | Volume 9 (4): Article 174 | Published: 30 Oct 2026

Views: 499
Menu, Tables and Figures
| Variable | Overall (N=411) | Hypertension: Yes (n=263) | Hypertension: No (n=148) | p value | |||
|---|---|---|---|---|---|---|---|
| n | (%) | n | (%) | n | (%) | ||
| Age⁋ (Years) | 0.006 | ||||||
| <40 | 263 | (64.0) | 154 | (58.6) | 109 | (73.7) | |
| 40 – 60 | 121 | (29.4) | 87 | (33.1) | 34 | (23.0) | |
| >60 | 27 | (6.6) | 22 | (8.4) | 5 | (3.3) | |
| Sex | 0.976 | ||||||
| Female | 242 | (58.9) | 155 | (58.9) | 87 | (58.8) | |
| Male | 169 | (41.1) | 108 | (41.1) | 61 | (41.2) | |
| Education level | 0.65 | ||||||
| None | 71 | (17.3) | 46 | (17.5) | 25 | (16.9) | |
| Primary | 173 | (42.1) | 116 | (44.1) | 57 | (38.5) | |
| Secondary | 120 | (29.2) | 73 | (27.8) | 47 | (31.8) | |
| Tertiary | 47 | (11.4) | 28 | (10.7) | 19 | (12.8) | |
| Income level* | 0.112 | ||||||
| Low Income (≤ 100K) | 159 | (38.7) | 100 | (38.0) | 59 | (39.9) | |
| Lower Middle Income (100K–200K) | 108 | (26.3) | 64 | (24.3) | 44 | (29.7) | |
| Upper Middle Income (200K–300K) | 60 | (14.6) | 37 | (14.1) | 23 | (15.5) | |
| High Income (300K–500K) | 65 | (15.8) | 51 | (19.4) | 14 | (9.5) | |
| Very High Income (> 500K) | 19 | (4.6) | 11 | (4.2) | 8 | (5.4) | |
| BMI category | 0.159 | ||||||
| Underweight (< 18.5) | 14 | (3.4) | 9 | (3.4) | 5 | (3.4) | |
| Normal weight (18.5–24.9) | 173 | (42.1) | 100 | (38.0) | 73 | (49.3) | |
| Overweight (25–29.9) | 134 | (32.6) | 91 | (34.6) | 43 | (29.1) | |
| Obese (≥ 30) | 90 | (21.9) | 63 | (24.0) | 27 | (18.2) | |
| Currently take alcohol | 0.019 | ||||||
| No | 221 | (53.8) | 130 | (49.4) | 91 | (61.5) | |
| Yes | 190 | (46.2) | 133 | (50.6) | 57 | (38.5) | |
| Currently smoking | 0.403 | ||||||
| No | 377 | (91.7) | 239 | (90.9) | 138 | (93.2) | |
| Yes | 34 | (8.3) | 24 | (9.1) | 10 | (6.8) | |
| Adding salt to food on table | 0.214 | ||||||
| No | 175 | (42.6) | 106 | (40.3) | 69 | (46.6) | |
| Yes | 236 | (57.4) | 157 | (59.7) | 79 | (53.4) | |
| Physical exercise | 0.099 | ||||||
| No | 129 | (31.4) | 90 | (34.2) | 39 | (26.4) | |
| Yes | 282 | (68.6) | 173 | (65.8) | 109 | (73.7) | |
| Taking fruits (at least once a week) | 0.04 | ||||||
| No | 134 | (32.6) | 95 | (36.1) | 39 | (26.4) | |
| Yes | 277 | (67.4) | 168 | (63.9) | 109 | (73.7) | |
| Taking vegetables (at least once a week) | 0.015 | ||||||
| No | 49 | (11.9) | 39 | (14.8) | 10 | (6.8) | |
| Yes | 362 | (88.1) | 224 | (85.2) | 138 | (93.2) | |
| Resting heart rate (beats per minute) | 0.039 | ||||||
| 60–100 | 363 | (88.3) | 226 | (85.9) | 137 | (92.6) | |
| <60 | 12 | (2.9) | 7 | (2.7) | 5 | (3.4) | |
| >100 | 36 | (8.8) | 30 | (11.4) | 6 | (4.1) | |
Footnotes: *1K = 1,000 Ugandan shillings (1 USD = 3,650 UGx); ⁋ Median age = 34 (IQR: 28–45) years.
| Variable | Crude analysis | Adjusted analysis | ||||
|---|---|---|---|---|---|---|
| cPR | 95% CI | p value | aPR | 95% CI | p value | |
| Age (Years) | ||||||
| <40 | Ref | Ref | ||||
| 40–60 | 1.81 | (1.14–2.89) | 0.013 | 1.29 | (1.11–1.50) | 0.001 |
| >60 | 3.11 | (1.14–8.74) | 0.026 | 1.5 | (1.25–1.85) | <0.001 |
| Sex | ||||||
| Female | Ref | Ref | ||||
| Male | 0.99 | (0.66–1.50) | 0.976 | 0.99 | (0.85–1.55) | 0.876 |
| Education level | ||||||
| None | Ref | |||||
| Primary | 1.11 | (0.61–1.98) | 0.734 | – | – | – |
| Secondary or Tertiary | 0.83 | (0.47–1.48) | 0.532 | – | – | – |
| BMI category | ||||||
| Underweight (<18.5) | Ref | |||||
| Normal weight (18.5–24.9) | 0.76 | (0.24–2.47) | 0.637 | – | – | – |
| Overweight (25–29.9) | 1.18 | (0.37–3.72) | 0.783 | – | – | – |
| Obese (≥30) | 1.3 | (0.40–4.23) | 0.667 | – | – | – |
| Currently take alcohol | ||||||
| No | Ref | Ref | ||||
| Yes | 1.63 | (1.08–2.46) | 0.019 | 1.23 | (1.06–1.42) | 0.007 |
| Physical exercise | ||||||
| No | Ref | Ref | ||||
| Yes | 0.69 | (0.44–1.07) | 0.1 | 0.91 | (0.78–1.06) | 0.207 |
| Taking fruits (at least once in a week) | ||||||
| No | Ref | Ref | ||||
| Yes | 0.63 | (0.41–0.99) | 0.043 | 0.9 | (0.77–1.05) | 0.189 |
| Taking vegetables (at least once in a week) | ||||||
| No | Ref | Ref | ||||
| Yes | 0.42 | (0.20–0.86) | 0.018 | 0.78 | (0.65–0.94) | 0.01 |
| Resting heart rate (beats per minute) | ||||||
| 60–100 | Ref | Ref | ||||
| <60 | 0.85 | (0.26–2.73) | 0.783 | 0.91 | (0.56–1.46) | 0.688 |
| >100 | 3.03 | (1.23–7.47) | 0.016 | 1.36 | (1.15–1.60) | 0.005 |
Abbreviations: BMI: Body mass index; cPR: Crude prevalence ratio; aPR: Adjusted prevalence ratio; CI: Confidence interval; Ref: Reference category.
Richard Migisha1,2, Charity Mutesi1,&, Derrick Asiimwe2, Aggrey Byaruhanga3, Abraham Muhwezi4, Prichard Denzel Kavuma5, Sarah Achiro5, Abel Wilson Walekhwa6,7, Alex Riolexus Ario1
1Uganda Public Health Fellowship Program, Uganda National Institute of Public Health, Kampala, Uganda, 2Department of Physiology, Mbarara University of Science and Technology, Mbarara, Uganda, 3Ministry of Health, Kampala, Uganda, 4Department of Community Health, Mbarara University of Science and Technology, Mbarara, Uganda, 5Korea Foundation for International Healthcare (KOFIH) Country Office, Kampala, Uganda, 6Disease Dynamics Unit, Department of Veterinary Medicine, Cambridge Veterinary School, Cambridge, UK, 7IDEMU Mathematical Modelling Unit, Department of Epidemiology and Biostatistics, Makerere University School of Public Health, Kampala, Uganda
&Corresponding author: Charity Mutesi, Uganda Public Health Fellowship Program, Uganda National Institute of Public Health, Kampala, Uganda, Email: charitymutesi@uniph.go.ug, ORCID: https://orcid.org/0009-0003-5986-2211
Received: 01 Sep 2025, Accepted: 29 Oct 2026, Published: 30 Oct 2026
Domain: Non-Communicable Disease Epidemiology
Keywords: Hypertension, prevalence, urban health, slums, Uganda
©Richard Migisha et al. Journal of Interventional Epidemiology and Public Health (ISSN: 2664-2824). This is an Open Access article distributed under the terms of the Creative Commons Attribution International 4.0 License (https://creativecommons.org/licenses/by/4.0/), which permits unrestricted use, distribution, and reproduction in any medium, provided the original work is properly cited.
Cite this article: Richard Migisha et al., Prevalence of hypertension and associated factors among slum residents in Mbarara City, Uganda, 2024. Journal of Interventional Epidemiology and Public Health. 2026; 9(4):174. https://doi.org/10.37432/jieph-d-25-00180
Introduction: Hypertension, a primary cause of cardiovascular diseases and premature death, is highly prevalent in urban slums due to poverty, limited healthcare access, and unhealthy lifestyles. Data on hypertension from Ugandan slums remain limited. We estimated the prevalence of hypertension and examined associated factors among adult slum residents in Mbarara City, southwestern Uganda.
Methods: We conducted a cross-sectional study in two densely populated slums during November–December 2024. Adults aged ≥18 years were selected using systematic random sampling. Blood pressure (BP) was measured using automated sphygmomanometers, and sociodemographic and lifestyle data were collected via structured questionnaires. Hypertension was classified per American College of Cardiology/American Heart Association guidelines: stage 1 for systolic BP 130-139 mmHg or diastolic BP 80-89 mmHg, and stage 2 for systolic BP ≥140 mmHg or diastolic BP ≥90 mmHg. Multivariable modified Poisson regression identified factors associated with hypertension.
Results: Of 411 participants, 64% (263/411; 95% CI: 59.2-68.5%) had hypertension, and among those classified as hypertensive, 32/263 (12.2%) reported a prior diagnosis. Prevalence was higher among adults aged 40-60 years (aPR: 1.29, 95% CI:1.11–1.50) and >60 years (aPR: 1.50, 95% CI:1.25–1.85) compared to those <40 years. Alcohol consumption (aPR: 1.23, 95% CI:1.06-1.42) and resting heart rate above 100 beats per minute (aPR: 1.36, 95% CI:1.15-1.60) were associated with higher hypertension prevalence, whereas regular vegetable intake was associated with lower prevalence (aPR: 0.78, 95% CI:0.65-0.94).
Conclusion: Hypertension prevalence was high in Mbarara City slums, and few participants classified as hypertensive reported a prior diagnosis. Older age, alcohol consumption, and elevated resting heart rate were associated with higher hypertension prevalence, whereas weekly vegetable consumption was associated with lower prevalence. Public health strategies should strengthen hypertension detection, linkage to care, and evidence-based cardiovascular risk-reduction interventions in urban slum populations.
Hypertension remains a primary cause of cardiovascular diseases and early death, impacting almost a third of the global adult population [1]. It stands as a main contributing factor for heart disease, stroke, plus renal failure; in 2023, it was responsible for an estimated 10 million deaths worldwide [1, 2]. Hypertension, characterized by persistently elevated blood pressure defined as having a systolic blood pressure (BP) of 140 mmHg or higher and/or diastolic BP of 90 mmHg or more, is a common occurrence in low- and middle-income countries (LMICs), where medical services are often limited to manage the condition effectively [3]. Alarmingly, nearly half of adults with hypertension remain undiagnosed, and only a small proportion (<25%) achieve adequate control, exacerbating the global burden of cardiovascular diseases [2, 4].
In Africa, hypertension is one of the most prevalent conditions, with estimates showing that between 34% and 75% of the adult population is affected [5, 6]. This rising burden is fueled by factors such as lifestyle changes, increasing obesity rates, and inadequate healthcare infrastructure, all exacerbated by rapid urbanization [7, 8]. Urban areas in Africa consistently report higher prevalence rates of hypertension compared to rural areas [8].
In Uganda, hypertension is the most prevalent non-communicable disease [9]. Approximately 24% of the Ugandan population lives in urban areas or cities [10]. Uganda is experiencing rapid growth in urban slums, which are associated with increased hypertension risk factors. The unique socio-economic challenges faced by slum dwellers— including poverty, inadequate access to healthcare, poor diet, and high stress — predispose them to higher hypertension risk [11, 12]. However, comprehensive data on hypertension prevalence and associated factors among slum populations in Uganda remain limited. This gap in local evidence is critical to address, as it limits the development of effective measures to reduce the health impacts in slum communities. We therefore estimated the prevalence of hypertension and examined associated factors among slum residents in Mbarara City, southwestern Uganda.
Design and setting
This cross-sectional survey was carried out in Mbarara City, southwestern Uganda, during November and December 2024. Mbarara City lies in the southwestern part of Uganda, around 280 kilometres from Kampala. Mbarara City has 12 slum settlements, and the study focused on the two most densely populated slum areas: Biafra and Kizungu slums. These areas were selected for their high population density, low socioeconomic status, and limited healthcare access, which are key factors contributing to the prevalence of hypertension. These slum communities are characterised by a combination of traditional lifestyles, including agricultural activities, alongside urban migration for work, leading to a blend of rural and urban living conditions. The residents of these slums often rely on community-based healthcare services, including Village Health Teams (VHTs), for health education, preventive care, and basic treatment, though hypertension screening is not consistently available in these areas. Most residents work in informal sectors such as street vending, casual labour, and small-scale farming.
Study population, sample size, and sampling
We incorporated participants who were aged 18 years and older who had stayed in the selected slum areas for ≥6 months. Women who were pregnant and individuals who had acute illnesses, like malaria, were not included due to the potential impact on blood pressure (BP) measurements.
Sample size was determined using the single population proportion formula, with 5% absolute precision, a 95% confidence level, and a design effect of 1. We assumed a hypertension prevalence of 42% based on a previous study [13]. The sample size was calculated as 374, using the Epi Info (version 7.1.4.0, CDC Atlanta, USA) statistical calculator. To adjust for a 10% non-response rate, the sample size was increased to 411 participants. Systematic random sampling was used to select participants from the two slums. We estimated a total of 1,000 households per slum. In each slum community, the sampling interval was approximately 5 (1,000 households / 206 sample size from each slum community = 4.85). In each of the households selected, one adult participant was selected to participate. A listing exercise was conducted with the help of village leaders to compile a list of eligible individuals aged 18 years or older, which was then used for the sampling process.
Data collection and variables under study
We collected data with a structured questionnaire and BP measurement devices. The questionnaire captured variables such as age, alcohol intake, smoking habits, exercise patterns, and dietary habits. It also captured clinical factors, including family history of hypertension and diabetes, as well as resting heart rate. BP was measured using automatic devices that were calibrated before the study. Measurements were taken in a sitting posture with the participant’s arm aligned with heart level and feet together, using an automatic blood pressure monitor (Omron HEM 705 LP, Omron Healthcare, Inc., Bannockburn, IL, USA). We ensured that the participant had rested for at least five minutes before the measurement. Body mass index (BMI) was determined using stadiometers for height and calibrated weighing scales for weight. Body weight and height were recorded to the closest 0.1 kg and 0.1 cm, respectively, with participants wearing light clothing with barefoot. BMI was computed as body mass in kilograms divided by the square of height in meters.
Before data collection, research assistants received training on administering the questionnaire, using the BP-measuring devices, and following ethical guidelines. For clarity and reliability of the tools, the data collection instruments were pretested in a neighbouring slum area, Kiswahili. This slum was chosen because of its demographic and socio-economic characteristics similar to those of the study population. BP measurements were taken while participants were seated comfortably for at least five minutes before the first measurement was taken. Two readings were recorded at five-minute intervals. The mean of the two measurements was used to establish the final blood pressure.
Hypertension was defined in alignment with the ACC/AHA 2017 guidelines for blood pressure classification [14]. Accordingly, hypertension was classified as Stage 1 (systolic blood pressure [SBP] of 130–139 mmHg or diastolic blood pressure [DBP] of 80–89 mmHg) or Stage 2 (SBP ≥140 mmHg or DBP ≥90 mmHg). Normal blood pressure was defined as SBP <120 mmHg and DBP <80 mmHg, while elevated BP was defined as SBP 120–129 mmHg and DBP <80 mmHg. Participants with Stage 1 or Stage 2 hypertension were classified as hypertensive, and those with normal or elevated blood pressure were non-hypertensive.
Data management and data analysis
Data was entered into Kobo Collect and after exported to STATA version 15 (STATA Corp, Texas, USA) for analysis. Descriptive statistics such as frequencies, proportions, and means were used to summarise sociodemographic and health characteristics of the participants. The prevalence of hypertension was calculated as the proportion of participants who met the ACC/AHA 2017 criteria for hypertension. Bivariable analyses, including chi-square tests, were used to assess associations between hypertension and candidate variables. Multivariable analysis used modified Poisson regression to estimate adjusted prevalence ratios for factors associated with hypertension. Considering the widespread occurrence of hypertension, we used a modified Poisson regression with robust standard errors to prevent overestimation of effect sizes produced by logistic regression [15]. Variables with p<0.20 in bivariable analyses, together with sex because of its biological relevance, were considered for multivariable analysis. The final model included age, sex, current alcohol consumption, physical exercise, fruit intake, vegetable intake, and resting heart rate. All 411 participants had complete data for variables in the final model; therefore, no imputation was performed. Analyses were unweighted, and no additional adjustment for clustering by study community was applied. Results were reported as adjusted prevalence ratios (aPRs) with 95% confidence intervals (CIs), with statistical significance set at p<0.05.
Ethics consideration
We obtained ethical approval from the Makerere University School of Public Health Research Ethics Committee (MaKSPH), Reference number SPH-2024-671. Furthermore, we sought approval from the Uganda National Council of Science and Technology (UNCST), Reference number HS5420ES. Written informed consent was secured from all participants before data collection. Participants were informed of their right to withdraw from the study at any time without facing any repercussions. For participants with hypertension, appropriate referrals were made to nearby public health facilities for further care. All study procedures were carried out in line with the ethical principles of the Declaration of Helsinki.
We enrolled 411 participants, who had a median age of 34 years (IQR: 28–45). The majority were aged <40 years (64%) and female (58.9%). Most participants had attained primary (42.1%) or secondary education (29.2%), while 17.3% had not attained any formal education. Income distribution was skewed toward lower income brackets, with 38.7% earning ≤100,000 Ugandan shillings (27 USD) per month (Table 1).
Regarding lifestyle behaviours, alcohol consumption was reported by 46.2% of participants, while smoking was less common (8.3%). Over half of the participants (57.4%) added salt to their food at the table, and 31.4% reported being physically inactive. However, the majority consumed fruits (67.4%) and vegetables (88.1%) at least once a week. A family history of high blood pressure was reported by 43.3% of participants. Approximately one-third (32.6%) of the participants were overweight (Table 1).
Hypertension prevalence was significantly higher in older age groups (p=0.006). Participants with hypertension were more likely to consume alcohol (50.6%) compared to non-hypertensive participants (38.5%; p=0.019). Participants with hypertension were also less likely to consume fruits (63.9% vs. 73.7%; p=0.04) and vegetables (85.2% vs. 93.2%; p=0.015). Additionally, hypertensive participants were more likely to have an elevated resting heart rate of >100 bpm (11.4% vs. 4.1%; p = 0.039). Other factors, such as sex and education level attained, did not show significant differences between hypertensive and non-hypertensive participants (Table 1).
Prevalence of hypertension
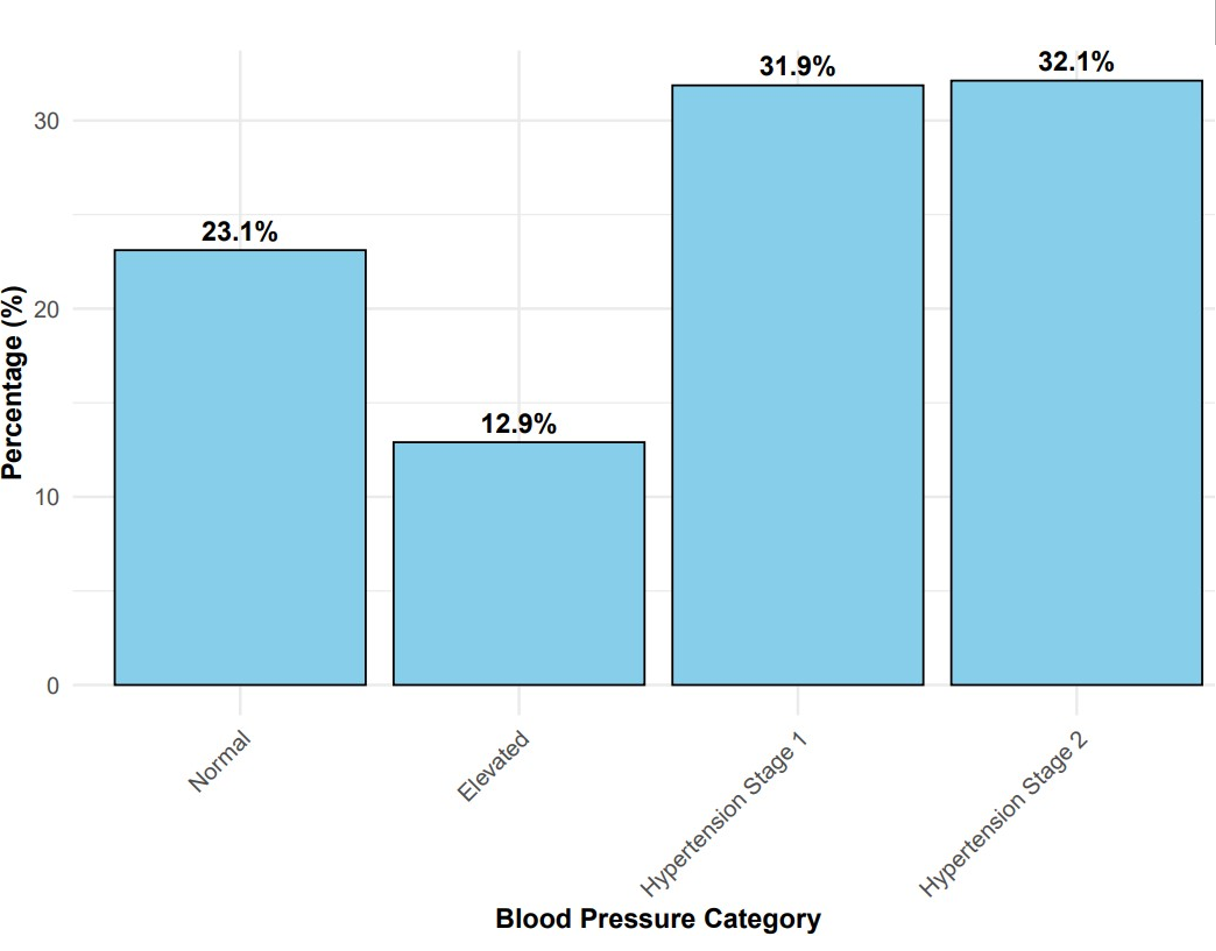
Of 411 participants, 263 (64.0%; 95% CI: 59.2-68.5%) were classified as hypertensive. Of the total sample, 131 (31.9%) were classified as Stage 1 hypertension, and 132 (32.1%) were classified as Stage 2 hypertension; 23.1% of the participants had normal BP, 12.9% had elevated BP, and 76.9% had either elevated or hypertensive blood pressure (Figure 1). Among participants classified as hypertensive, 32/263 (12.2%) reported a prior diagnosis, whereas 231/263 (87.8%) did not report a previous diagnosis.
Factors associated with hypertension
Age, alcohol consumption, vegetable intake, and resting heart rate were significantly associated with hypertension at multivariable analysis (Table 2). Participants aged 40–60 years had a 1.29 times higher prevalence of hypertension (aPR: 1.29, 95% CI: 1.11–1.50, p=0.001) compared to those under 40 years, and those aged >60 years had a 1.5 times higher prevalence (aPR: 1.50, 95% CI: 1.25–1.85, p<0.001). Alcohol consumers had a 1.23 times higher prevalence of hypertension (aPR: 1.23, 95% CI: 1.06–1.42, p=0.007) compared to non-alcohol consumers. Weekly vegetable consumption was associated with 22% lower hypertension prevalence (aPR: 0.78, 95% CI: 0.65–0.94, p=0.01). Additionally, participants with a resting heart rate >100 beats per minute had a 1.36 times higher prevalence of hypertension (aPR: 1.36, 95% CI: 1.15–1.60, p=0.005) compared to those with a resting heart rate between 60 and 100 beats per minute. Other variables, including sex, education level, income, smoking, and physical activity, did not show significant associations with hypertension (p >0.05) (Table 2).
Nearly two-thirds of the slum dwellers surveyed in Mbarara City, southwestern Uganda, were classified as hypertensive. The prevalence of hypertension was significantly higher among older adults, particularly those aged 40 years and older. Current alcohol consumption was associated with higher hypertension prevalence, whereas weekly vegetable consumption was associated with lower prevalence. Elevated resting heart rate was also associated with higher hypertension prevalence. Given the cross-sectional design, these associations do not establish temporal sequence or causation.
This study found a hypertension prevalence of 64% among adult slum dwellers in southwestern Uganda, which is notably higher than the global estimate of 31% for adults aged 18 and older [1] There are regional variations in hypertension, with low- and middle-income countries (LMICs) often reporting higher rates due to lifestyle changes, limited access to healthcare, and delayed diagnosis [3]. Across India, the total prevalence of hypertension among slum residents has been documented to vary between 22% and 42% [13, 16, 17]. Similarly, studies in sub-Saharan Africa have documented hypertension prevalence estimates in adult urban populations ranging from 15.5% to 59.2% [8, 12,18]. However, most of these studies, conducted before 2024, used higher thresholds for blood pressure (140/90 mmHg) to define hypertension. A more recent study in Mbarara City, Uganda, which employed the ACC/AHA 2017 guidelines, similar to our study, found a prevalence of 52% among the general adult urban population [19]. The higher prevalence in our study compared to those conducted in the general adult populations may be due to increased risk factors such as obesity and alcohol consumption. For instance, more than half of the participants in the current study were overweight or alcohol consumers. Furthermore, slum dwellers are particularly affected by hypertension due to low physical activity, poor living conditions, and limited access to healthcare [20]. Our study applied the ACC/AHA 2017 classification, which uses a lower hypertension threshold of 130/80 mmHg than the 140/90 mmHg threshold used in the International Society of Hypertension (ISH) 2020 recommendations. The reduced cutoff of the ACC/AHA 2017 guidelines allows for earlier identification of individuals at risk [21].
Our study revealed an association of higher prevalence of hypertension with increasing age. This association has been observed in similar cross-sectional studies conducted among adult slum dwellers elsewhere [16, 17]. This age-related trend can be attributed to biological factors, including age-related endothelial dysfunction, increased systemic vascular resistance, arterial stiffening, and reduced elasticity, which predispose individuals to hypertension [22]. As urbanization increases in developing countries, slum dwellers may face a double burden of hypertension and aging, with socioeconomically disadvantaged elderly individuals often unable to afford healthcare [23]. To address these challenges, there is a need to design elderly-friendly interventions within cities and slums in developing countries [24, 25]. These interventions may include regular, targeted hypertension screenings for older slum dwellers, as early detection can help manage the condition before it leads to adverse cardiovascular complications. Community-based health programs could prioritize older adults for routine BP checks. Additionally, promoting regular, moderate-intensity physical activity, such as walking or light exercises, could help counteract the age-related decline in vascular health among the elderly, as reported elsewhere [26-28].
Slum dwellers who were alcohol consumers exhibited a higher prevalence of hypertension than non-alcohol consumers. Our study aligns with findings based on a systematic review of studies among slum dwellers [12]. Alcohol drinking is documented as one of the factors associated with cardiovascular disease, influencing blood pressure through various mechanisms, including high oxidative stress, low nitric oxide bioavailability, and altered vasoconstrictive responses [29]. Chronic alcohol use also raises cortisol levels, contributing to sustained increases in systemic vascular resistance. Additionally, it causes dose-dependent BP increases through sympathetic nervous system stimulation, enhanced renin-angiotensin-aldosterone system (RAAS) activity, and endothelial dysfunction [29]. Given the high prevalence of alcohol consumption in slum settings, a wide range of multisectoral interventions may be required, including behaviour change and communication initiatives, and possibly alcohol legislation, to minimise alcohol consumption [30].
Regular vegetable consumption was associated with lower hypertension prevalence in our study. This finding aligns with extensive evidence from dietary, epidemiological studies, and systematic reviews [31-33]. Vegetables are central to heart-healthy diets due to their nutrient profile, including high levels of potassium, magnesium, fibre, and antioxidants, all of which are essential for regulating BP [34]. Given the increased burden of hypertension in this setting and the observed inverse association between vegetable consumption and hypertension, promoting healthy food choices within slums is crucial. However, in slum settings, access to healthy foods, including vegetables, is limited by factors such as affordability and availability. To effectively promote hypertension prevention, multifaceted strategies should address these barriers, improving food access and affordability while fostering community-based nutrition education.
Participants with elevated resting heart rates (RHR) showed an elevated prevalence of hypertension compared to those with normal RHR, in line with prior studies [35-38]. This observation is congruent with previous studies linking elevated RHR with increased hypertension risk and its related adverse outcomes, underscoring the importance of RHR as a key physiological marker of cardiovascular health [39]. High RHR is associated with increased sympathetic nervous system activity, which contributes to vasoconstriction, elevated heart output, and higher peripheral vascular resistance, all of which promote hypertension [40]. Additionally, persistent tachycardia can worsen arterial stiffness and endothelial dysfunction, principal processes contributing to the development of hypertension [41]. Given our findings, RHR could be monitored as a key marker for early hypertension detection, especially in vulnerable populations like slum dwellers. Interventions focusing on reducing RHR, such as regular physical exercise and stress management, could help mitigate hypertension risk. However, further research on RHR-targeted interventions in high-risk groups is warranted.
Limitations
Our study had several limitations. First, the cross-sectional design precluded establishing temporal sequence or causal relationships between hypertension and the associated factors identified. Second, the sampling was confined to two specific slum areas in Mbarara City, which, while densely populated and socioeconomically disadvantaged, may not fully represent all slum populations across Uganda. This restricts the external validity of the findings to other settings. Third, reliance on self-reported lifestyle data, including alcohol use, tobacco use, physical activity, and dietary practices, may have introduced recall or social desirability bias. Fourth, BP classification was based on two measurements obtained at one visit rather than repeated assessments on separate days; transient elevation, including white-coat effects, may therefore have inflated the prevalence estimate [42]. Finally, the 12.2% prior-diagnosis proportion was calculated among participants classified as hypertensive at the survey and should not be interpreted as population-level hypertension awareness, because previously diagnosed individuals whose BP was below the survey threshold would not be included in that denominator.
This study found a high prevalence of hypertension among adult slum residents in Mbarara City. Older age, current alcohol consumption, and elevated resting heart rate were associated with higher hypertension prevalence, whereas weekly vegetable consumption was associated with lower prevalence. Because of the cross-sectional design, these associations should not be interpreted as causal. The findings support strengthening community-based blood-pressure assessment, linkage to confirmatory clinical evaluation and care, and established cardiovascular risk-reduction strategies in urban slum communities.
What is already known about the topic
What this study adds
The authors express their gratitude to the study participants, along with the local leaders and health personnel in Mbarara City, for their assistance during data collection.
Availability of data and materials
The datasets used and/or analyzed during the current study are available from the corresponding author on reasonable request.
List of abbreviations
ACC/AHA – American College of Cardiology / American Heart Association
aPR – Adjusted Prevalence Ratio
BMI – Body Mass Index
DBP – Diastolic Blood Pressure
IQR – Interquartile Range
RAAS – Renin-Angiotensin-Aldosterone System
RHR – Resting Heart Rate
SBP – Systolic Blood Pressure
WHO – World Health Organization
Conceptualization: Richard Migisha, Charity Mutesi, Derrick Asiimwe, Abel Wilson Walekhwa, Aggrey Byaruhanga, Abraham Muhwezi, Alex Riolexus Ario, Prichard Denzel Kavuma, and Sarah Achiro
Methodology: Derrick Asiimwe and Abraham Muhwezi
Data Curation: Richard Migisha
Formal Analysis: Richard Migisha and Derrick Asiimwe
Investigation: Richard Migisha and Derrick Asiimwe
Project Administration: Richard Migisha
Validation: Richard Migisha, Charity Mutesi, Derrick Asiimwe, Aggrey Byaruhanga, Abraham Muhwezi, Prichard Denzel Kavuma, Sarah Achiro, Abel Wilson Walekhwa, Alex Riolexus Ario
Visualization: Richard Migisha, Charity Mutesi, Derrick Asiimwe, Abel Wilson Walekhwa, Aggrey Byaruhanga, Abraham Muhwezi, Alex Riolexus Ario, Prichard Denzel Kavuma, and Sarah Achiro
Writing – Original Draft: Richard Migisha and Derrick Asiimwe
Writing – Review & Editing: Richard Migisha and Derrick Asiimwe
| Variable | Overall (N=411) | Hypertension: Yes (n=263) | Hypertension: No (n=148) | p value | |||
|---|---|---|---|---|---|---|---|
| n | (%) | n | (%) | n | (%) | ||
| Age⁋ (Years) | 0.006 | ||||||
| <40 | 263 | (64.0) | 154 | (58.6) | 109 | (73.7) | |
| 40 – 60 | 121 | (29.4) | 87 | (33.1) | 34 | (23.0) | |
| >60 | 27 | (6.6) | 22 | (8.4) | 5 | (3.3) | |
| Sex | 0.976 | ||||||
| Female | 242 | (58.9) | 155 | (58.9) | 87 | (58.8) | |
| Male | 169 | (41.1) | 108 | (41.1) | 61 | (41.2) | |
| Education level | 0.65 | ||||||
| None | 71 | (17.3) | 46 | (17.5) | 25 | (16.9) | |
| Primary | 173 | (42.1) | 116 | (44.1) | 57 | (38.5) | |
| Secondary | 120 | (29.2) | 73 | (27.8) | 47 | (31.8) | |
| Tertiary | 47 | (11.4) | 28 | (10.7) | 19 | (12.8) | |
| Income level* | 0.112 | ||||||
| Low Income (≤ 100K) | 159 | (38.7) | 100 | (38.0) | 59 | (39.9) | |
| Lower Middle Income (100K–200K) | 108 | (26.3) | 64 | (24.3) | 44 | (29.7) | |
| Upper Middle Income (200K–300K) | 60 | (14.6) | 37 | (14.1) | 23 | (15.5) | |
| High Income (300K–500K) | 65 | (15.8) | 51 | (19.4) | 14 | (9.5) | |
| Very High Income (> 500K) | 19 | (4.6) | 11 | (4.2) | 8 | (5.4) | |
| BMI category | 0.159 | ||||||
| Underweight (< 18.5) | 14 | (3.4) | 9 | (3.4) | 5 | (3.4) | |
| Normal weight (18.5–24.9) | 173 | (42.1) | 100 | (38.0) | 73 | (49.3) | |
| Overweight (25–29.9) | 134 | (32.6) | 91 | (34.6) | 43 | (29.1) | |
| Obese (≥ 30) | 90 | (21.9) | 63 | (24.0) | 27 | (18.2) | |
| Currently take alcohol | 0.019 | ||||||
| No | 221 | (53.8) | 130 | (49.4) | 91 | (61.5) | |
| Yes | 190 | (46.2) | 133 | (50.6) | 57 | (38.5) | |
| Currently smoking | 0.403 | ||||||
| No | 377 | (91.7) | 239 | (90.9) | 138 | (93.2) | |
| Yes | 34 | (8.3) | 24 | (9.1) | 10 | (6.8) | |
| Adding salt to food on table | 0.214 | ||||||
| No | 175 | (42.6) | 106 | (40.3) | 69 | (46.6) | |
| Yes | 236 | (57.4) | 157 | (59.7) | 79 | (53.4) | |
| Physical exercise | 0.099 | ||||||
| No | 129 | (31.4) | 90 | (34.2) | 39 | (26.4) | |
| Yes | 282 | (68.6) | 173 | (65.8) | 109 | (73.7) | |
| Taking fruits (at least once a week) | 0.04 | ||||||
| No | 134 | (32.6) | 95 | (36.1) | 39 | (26.4) | |
| Yes | 277 | (67.4) | 168 | (63.9) | 109 | (73.7) | |
| Taking vegetables (at least once a week) | 0.015 | ||||||
| No | 49 | (11.9) | 39 | (14.8) | 10 | (6.8) | |
| Yes | 362 | (88.1) | 224 | (85.2) | 138 | (93.2) | |
| Resting heart rate (beats per minute) | 0.039 | ||||||
| 60–100 | 363 | (88.3) | 226 | (85.9) | 137 | (92.6) | |
| <60 | 12 | (2.9) | 7 | (2.7) | 5 | (3.4) | |
| >100 | 36 | (8.8) | 30 | (11.4) | 6 | (4.1) | |
Footnotes: *1K = 1,000 Ugandan shillings (1 USD = 3,650 UGx); ⁋ Median age = 34 (IQR: 28–45) years.
| Variable | Crude analysis | Adjusted analysis | ||||
|---|---|---|---|---|---|---|
| cPR | 95% CI | p value | aPR | 95% CI | p value | |
| Age (Years) | ||||||
| <40 | Ref | Ref | ||||
| 40–60 | 1.81 | (1.14–2.89) | 0.013 | 1.29 | (1.11–1.50) | 0.001 |
| >60 | 3.11 | (1.14–8.74) | 0.026 | 1.5 | (1.25–1.85) | <0.001 |
| Sex | ||||||
| Female | Ref | Ref | ||||
| Male | 0.99 | (0.66–1.50) | 0.976 | 0.99 | (0.85–1.55) | 0.876 |
| Education level | ||||||
| None | Ref | |||||
| Primary | 1.11 | (0.61–1.98) | 0.734 | – | – | – |
| Secondary or Tertiary | 0.83 | (0.47–1.48) | 0.532 | – | – | – |
| BMI category | ||||||
| Underweight (<18.5) | Ref | |||||
| Normal weight (18.5–24.9) | 0.76 | (0.24–2.47) | 0.637 | – | – | – |
| Overweight (25–29.9) | 1.18 | (0.37–3.72) | 0.783 | – | – | – |
| Obese (≥30) | 1.3 | (0.40–4.23) | 0.667 | – | – | – |
| Currently take alcohol | ||||||
| No | Ref | Ref | ||||
| Yes | 1.63 | (1.08–2.46) | 0.019 | 1.23 | (1.06–1.42) | 0.007 |
| Physical exercise | ||||||
| No | Ref | Ref | ||||
| Yes | 0.69 | (0.44–1.07) | 0.1 | 0.91 | (0.78–1.06) | 0.207 |
| Taking fruits (at least once in a week) | ||||||
| No | Ref | Ref | ||||
| Yes | 0.63 | (0.41–0.99) | 0.043 | 0.9 | (0.77–1.05) | 0.189 |
| Taking vegetables (at least once in a week) | ||||||
| No | Ref | Ref | ||||
| Yes | 0.42 | (0.20–0.86) | 0.018 | 0.78 | (0.65–0.94) | 0.01 |
| Resting heart rate (beats per minute) | ||||||
| 60–100 | Ref | Ref | ||||
| <60 | 0.85 | (0.26–2.73) | 0.783 | 0.91 | (0.56–1.46) | 0.688 |
| >100 | 3.03 | (1.23–7.47) | 0.016 | 1.36 | (1.15–1.60) | 0.005 |
Abbreviations: BMI: Body mass index; cPR: Crude prevalence ratio; aPR: Adjusted prevalence ratio; CI: Confidence interval; Ref: Reference category.