
Short communication | Open Access | Volume 9 (4): Article 188 | Published: 11 Nov 2026

Views: 52
Menu, Tables and Figures
| Table 1: Treatment gap and aggregate generation-to-treatment ratio in India, 2019–2023 | ||
| Year | Treatment Gap (tonnes/day) | Aggregate generation-to-treatment ratio (%) |
|---|---|---|
| 2019 | 75 | 87.9 |
| 2020 | 66 | 91.5 |
| 2021 | 43 | 94.4 |
| 2022 | 60 | 91.5 |
| 2023 | 49 | 93.4 |
| Abbreviations: BMW, Biomedical Waste; HCFs, Healthcare facilities; CBWTFs, Common Biomedical Waste Treatment Facilities. | ||
| Table 2: Number of healthcare facilities and Common Biomedical Waste Treatment Facilities in India, 2019–2023 | ||
| Year | Number of HCFs | Number of CBWTFs |
|---|---|---|
| 2019 | 322,425 | 202 |
| 2020 | 352,014 | 208 |
| 2021 | 375,256 | 215 |
| 2022 | 393,939 | 218 |
| 2023 | 435,257 | 234 |
| Abbreviations: HCFs, Healthcare facilities; CBWTFs, Common Biomedical Waste Treatment Facilities. | ||
Navjot Singh1,&, Sumreen Bhatia2
1Department of Community Medicine, Guru Gobind Singh Medical College and Hospital, Faridkot, Punjab, India, 2Research Officer (Hospital Management), University Centre of Excellence and Research, Baba Farid University of Health Sciences, Faridkot, Punjab, India
&Corresponding author: Navjot Singh, Department of Community Medicine, Guru Gobind Singh Medical College and Hospital, Faridkot, Punjab, India, Email: navjotsandhu.24@gmail.com
Received: 01 Jun 2026, Accepted: 10 Nov 2026, Published: 11 Nov 2026
Domain: Environmental Health
Keywords: Biomedical waste, healthcare waste, waste management, treatment gap, environmental health, public health surveillance, India
©Navjot Singh et al. Journal of Interventional Epidemiology and Public Health (ISSN: 2664-2824). This is an Open Access article distributed under the terms of the Creative Commons Attribution International 4.0 License (https://creativecommons.org/licenses/by/4.0/), which permits unrestricted use, distribution, and reproduction in any medium, provided the original work is properly cited.
Cite this article: Navjot Singh et al., Biomedical waste generation, treatment, and persistent generation–treatment gaps in India: A national analysis, 2019–2023. Journal of Interventional Epidemiology and Public Health. 2026; 9(4):188. https://doi.org/10.37432/jieph-d-26-00169
Introduction: Biomedical waste (BMW) management is an important public health and environmental concern, particularly in developing countries experiencing rapid expansion of healthcare services. Although India has established regulatory mechanisms for biomedical waste management, monitoring trends in waste generation, treatment and the difference between reported generation and treatment remains important. This study assessed national trends in biomedical waste generation, treatment, the aggregate generation-to-treatment ratio, and generation–treatment gaps in India from 2019 to 2023.
Methods: A secondary data analysis was conducted using biomedical waste management data reported by the Central Pollution Control Board (CPCB), Government of India, for the years 2019–2023. Data on biomedical waste generation, treatment, the aggregate generation-to-treatment ratio, treatment gaps, healthcare facilities (HCFs), and Common Biomedical Waste Treatment Facilities (CBWTFs) were extracted and analysed using descriptive statistics and temporal trend comparisons. The aggregate generation-to-treatment ratio was calculated as the proportion of reported biomedical waste treated relative to the total quantity generated, expressed as a percentage.
Results: Biomedical waste generation increased from 619 tonnes/day in 2019 to 743 tonnes/day in 2023, representing a 20.0% increase. The quantity of waste treated increased from 544 tonnes/day to 694 tonnes/day during the same period, corresponding to a 27.6% increase. The aggregate generation-to-treatment ratio increased from 87.9% in 2019 to 93.4% in 2023, reaching its highest value of 94.4% in 2021. The reported number of healthcare facilities increased from 322,425 to 435,257, while the number of CBWTFs increased from 202 to 234. Despite these changes, a generation–treatment gap ranging from 43 to 75 tonnes/day persisted throughout the study period.
Conclusion: Biomedical waste generation and the quantity treated increased in India between 2019 and 2023, accompanied by an increase in the aggregate generation-to-treatment ratio and in the reported numbers of healthcare facilities and CBWTFs. However, a persistent difference between reported waste generation and treatment was observed across all years. Strengthening waste segregation, regulatory monitoring and implementation of biomedical waste management practices remains important. Further investigation using disaggregated data is required to understand the factors contributing to the observed generation–treatment differences and assess treatment capacity and facility utilisation.
Biomedical waste (BMW) generation in India has increased substantially in recent years, driven by the expansion of healthcare services and increased use of disposable medical products [1]. While the Biomedical Waste Management Rules, 2016 mandate scientific handling, segregation, and disposal of waste, disparities persist between waste generation and treatment capacity across regions [2]. Reports from the Central Pollution Control Board (CPCB) indicate fluctuations in biomedical waste generation and treatment, along with variation in the utilization of Common Biomedical Waste Treatment Facilities (CBWTFs), raising concerns regarding system efficiency and adequacy of existing infrastructure [3–7].
However, annual totals alone do not show how changes in waste generation relate to the aggregate generation-to-treatment ratio, the difference between reported waste generation and treatment, and changes in the number of healthcare facilities (HCFs) and Common Biomedical Waste Treatment Facilities (CBWTFs). Examining these indicators together can provide a more integrated description of national trends, although it cannot establish the causes of any treatment gap.
This study analysed national trends in BMW generation, treatment, the aggregate generation-to-treatment ratio, and the generation–treatment gap in India from 2019 to 2023. It also examined changes in HCF and CBWTF numbers and calculated waste generation per facility as a complementary indicator of workload relative to the reported number of facilities.
Study design and setting
A descriptive secondary data analysis was conducted using publicly available national-level biomedical waste management data from India. India’s biomedical waste management system is regulated under the Bio-Medical Waste Management Rules, 2016, notified under the Environment (Protection) Act, 1986. The rules apply to healthcare facilities (HCFs), including hospitals, clinics, laboratories, blood banks and other establishments generating biomedical waste. Every healthcare facility handling biomedical waste is required to obtain authorisation from the concerned State Pollution Control Board (SPCB) or Pollution Control Committee (PCC), irrespective of the quantity generated. These authorities are responsible for granting authorisation and monitoring compliance with the rules. Within healthcare facilities, biomedical waste must be segregated at the point of generation into colour-coded bags or containers according to its category (yellow, red, white and blue), and must not be mixed with general waste. The healthcare facility is responsible for segregation, collection, internal transportation and temporary storage. Segregated waste is subsequently collected and transported in designated vehicles to an authorised Common Biomedical Waste Treatment Facility (CBWTF), where it undergoes category-specific treatment and disposal. Treatment methods include incineration, autoclaving, microwaving and chemical disinfection, depending on the waste category. Where a common treatment facility is unavailable within the prescribed distance, healthcare facilities may establish authorised on-site treatment facilities. The SPCBs/PCCs compile information on biomedical waste generation and management and submit annual reports to the Central Pollution Control Board (CPCB), which consolidates the information at the national level.
Study period and data source
Data were obtained from annual reports on biomedical waste management published by the Central Pollution Control Board (CPCB), Government of India, for the period 2019–2023. Data were obtained from the publicly available annual reports on biomedical waste management published by the Central Pollution Control Board (CPCB), a statutory body under the Ministry of Environment, Forest and Climate Change (MoEFCC), Government of India. The analysis used the CPCB annual reports for the years 2019, 2020, 2021, 2022 and 2023, available on the CPCB website. These reports present national-level aggregate information compiled from annual returns submitted by healthcare facilities and Common Biomedical Waste Treatment Facility (CBWTF) operators to the respective State Pollution Control Boards (SPCBs) and Pollution Control Committees (PCCs), which subsequently compile and submit the information to CPCB. The required national-level indicators were manually extracted from the relevant tables in these reports and entered into a structured spreadsheet for analysis. No separate raw national-level dataset was downloaded or accessed.
Outcome measures and study variables
The primary outcome variables included biomedical waste generated (tonnes/day), biomedical waste treated (tonnes/day), aggregate generation-to-treatment ratio (%), and treatment gap (tonnes/day). Additional variables included the number of healthcare facilities (HCFs) and Common Biomedical Waste Treatment Facilities (CBWTFs), used as descriptive indicators of healthcare and waste-treatment infrastructure. The aggregate generation-to-treatment ratio was calculated as the proportion of reported biomedical waste treated relative to the quantity generated and expressed as a percentage. This indicator represents the proportion of reported BMW generation accounted for by treatment and does not directly measure the technical or operational efficiency of treatment facilities.
$$\text{Aggregate generation-to-treatment ratio (\%)} = \frac{\textit{Biomedical waste treated}}{\textit{Biomedical waste generated}} \times 100$$
The treatment gap was defined as the difference between biomedical waste generated and treated (tonnes/day).
Statistical analysis
Data extracted from CPCB annual reports were compiled and analyzed using Microsoft Excel 2021 (Microsoft Corporation, Redmond, WA, USA). Descriptive statistics were used to summarize biomedical waste generation, treatment, aggregate generation-to-treatment ratio, treatment gaps, healthcare facilities (HCFs), and Common Biomedical Waste Treatment Facilities (CBWTFs). Percentage changes between 2019 and 2023 were calculated to assess temporal changes in key indicators. Temporal trends were assessed by comparing annual changes in biomedical waste generation, treatment, aggregate generation-to-treatment ratio, treatment gaps, and infrastructure indicators over the study period. BMW generation per CBWTF (tonnes/day/CBWTF) and BMW generation per HCF (tonnes/day/HCF) were calculated for each study year as descriptive indicators of reported waste generation relative to the number of facilities.
Ethical considerations
The study was based entirely on publicly available secondary data without any individual identifiers; therefore, ethical approval was not required.
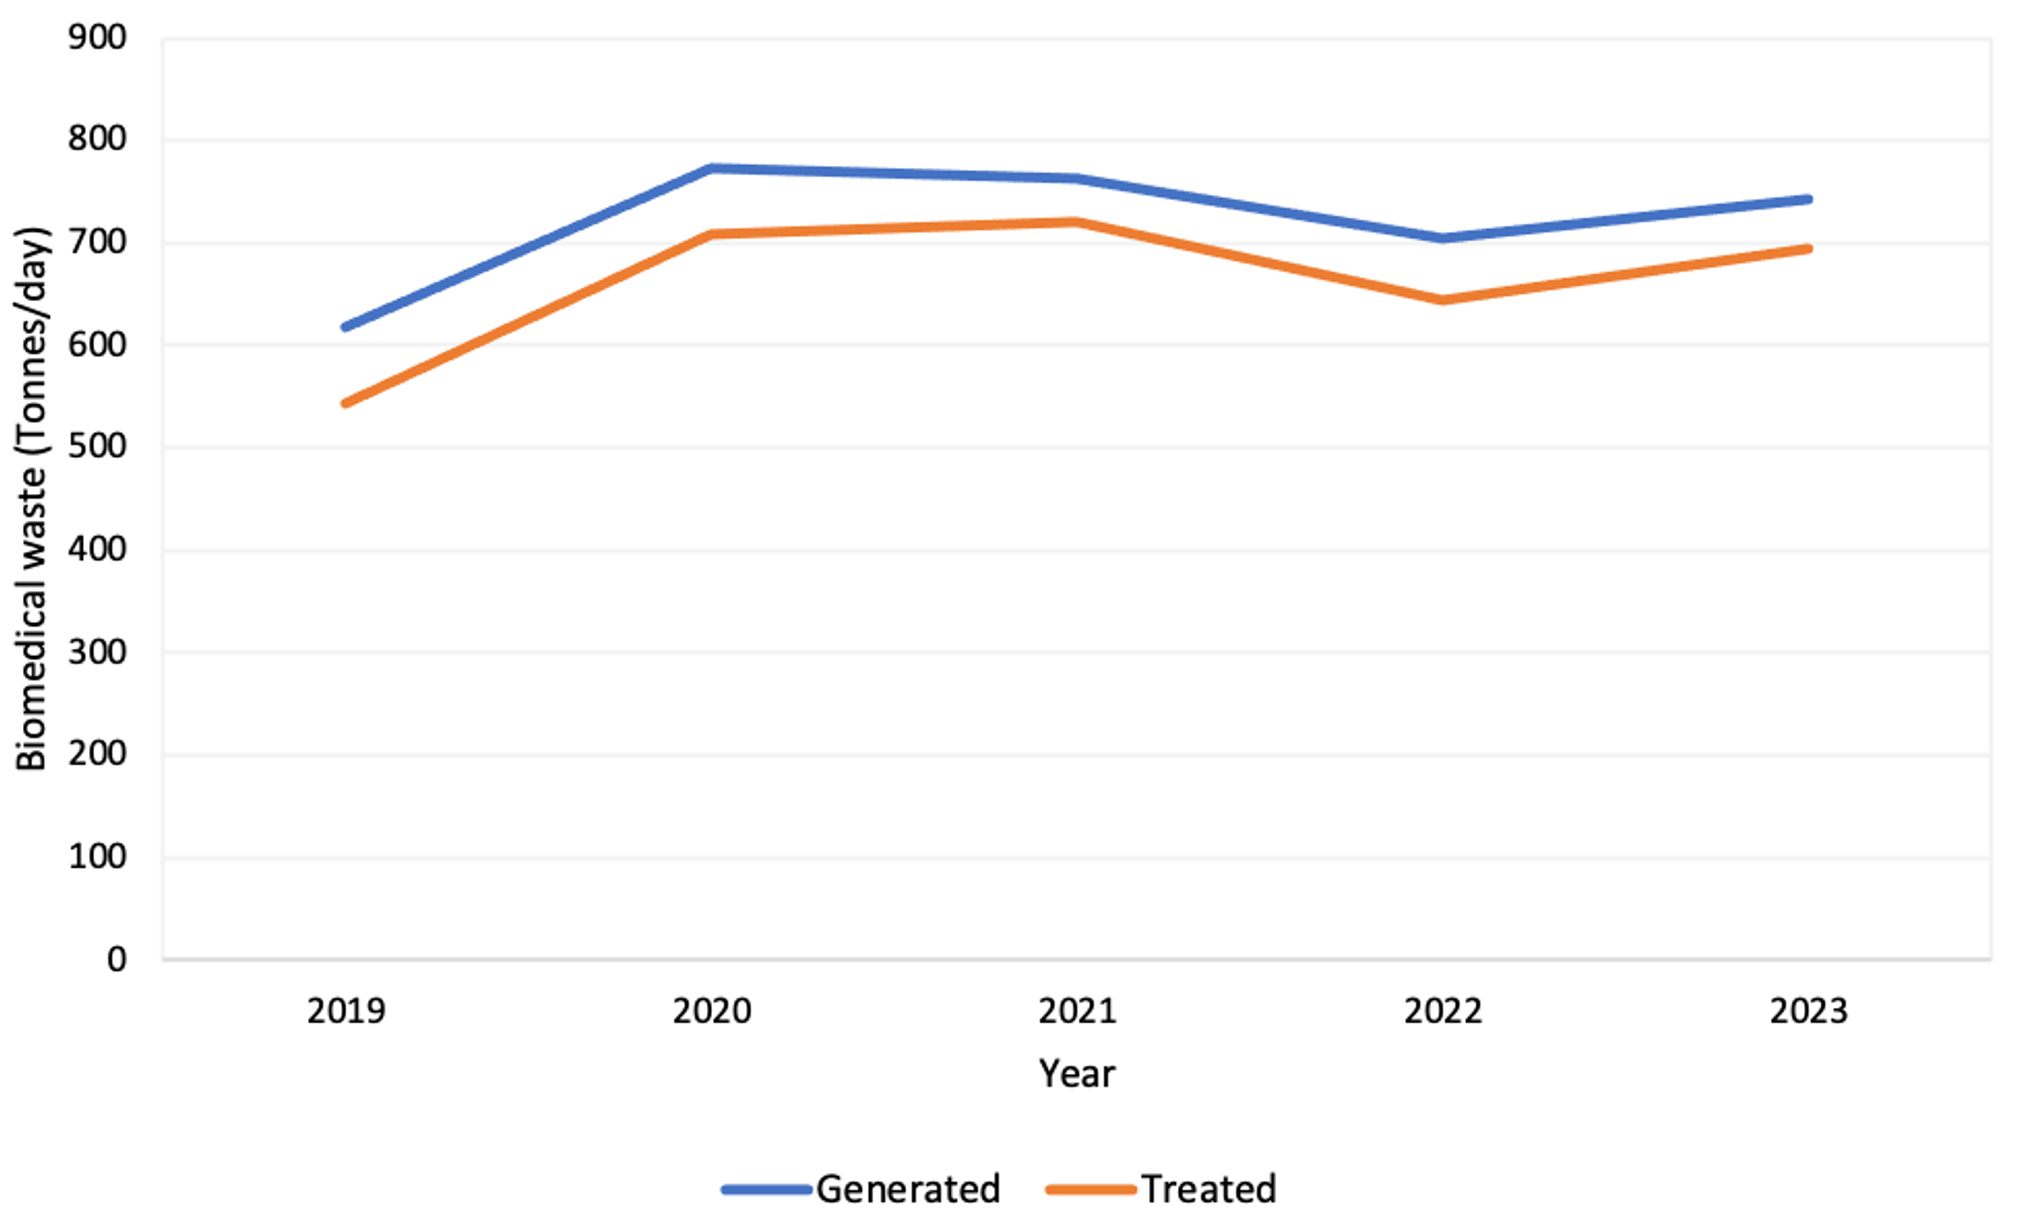
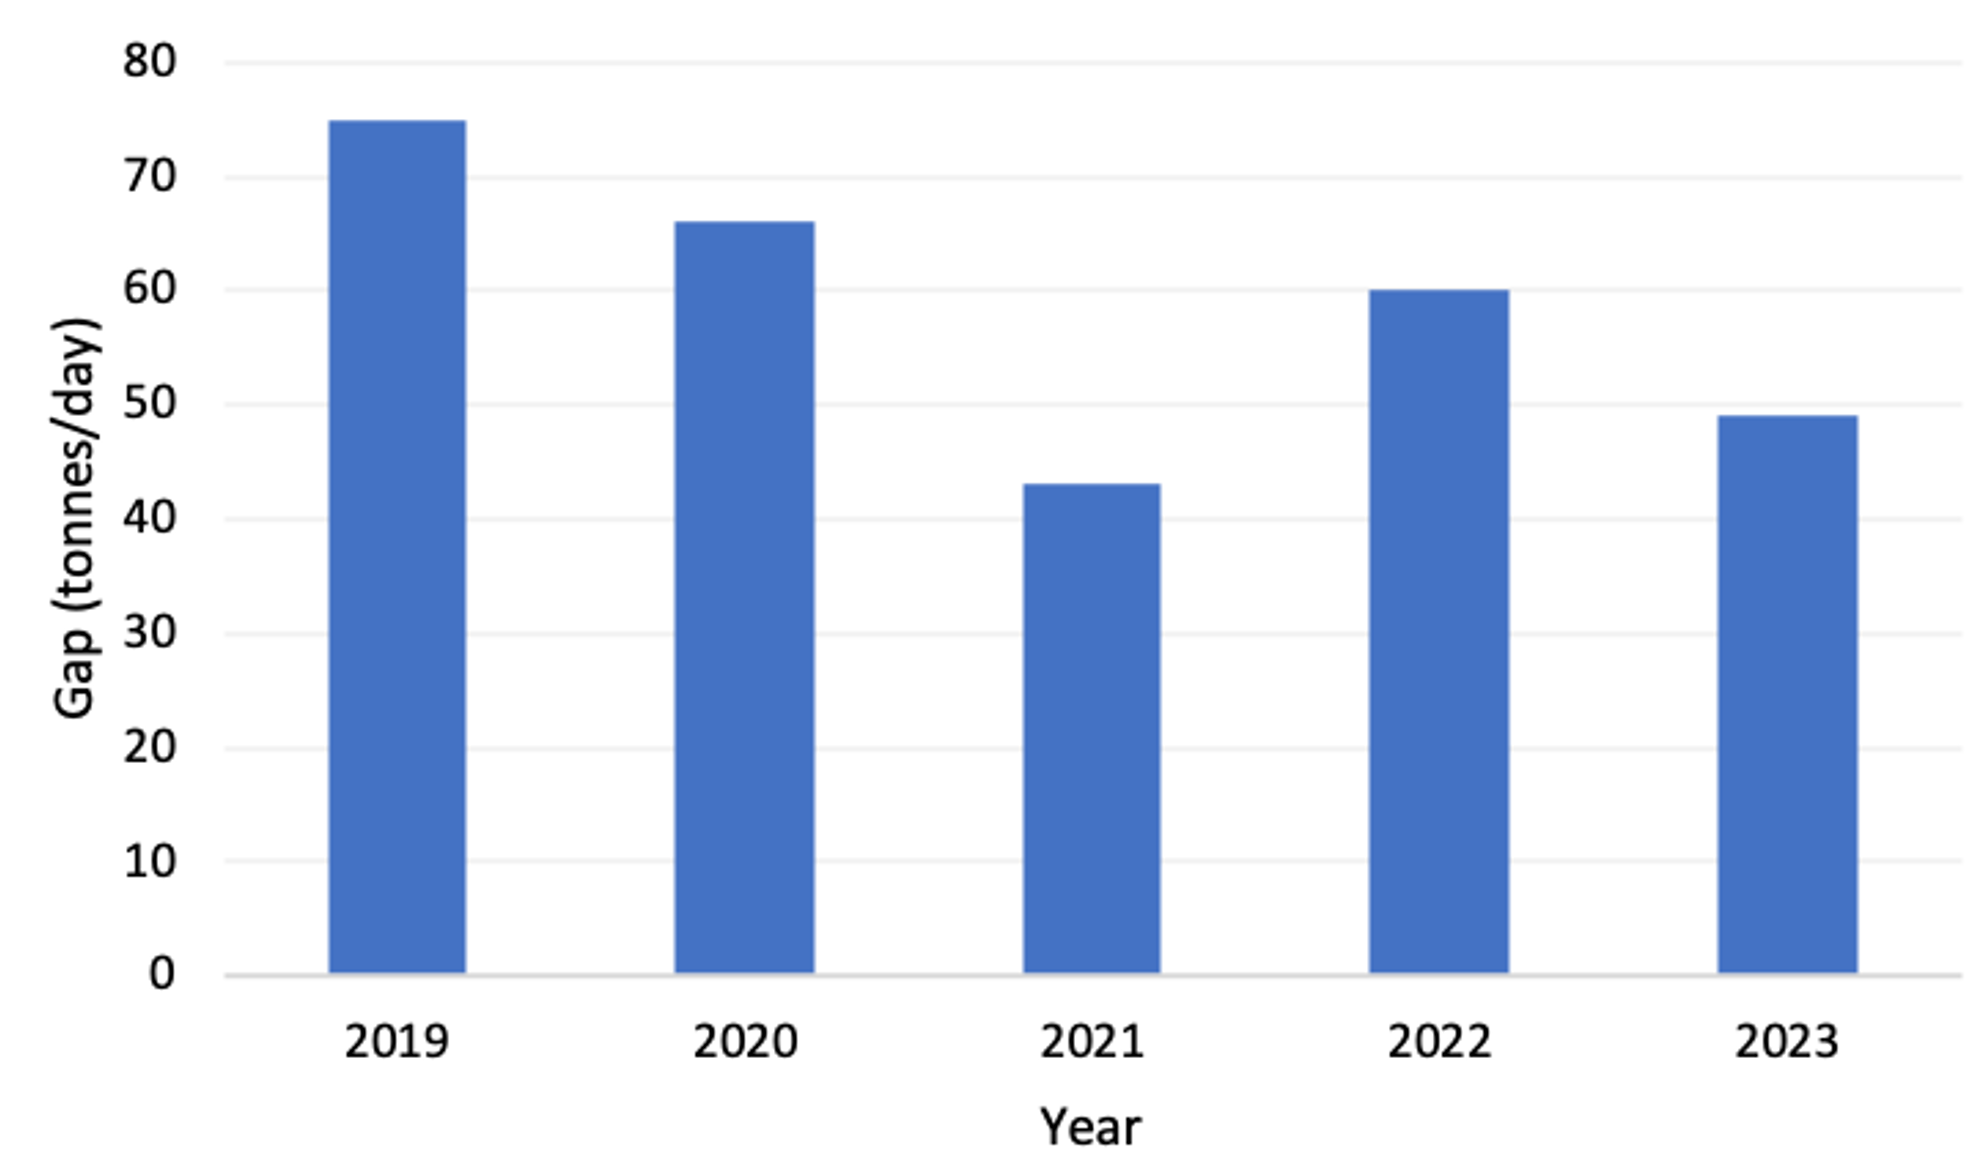
Biomedical waste (BMW) generation increased from 619 tonnes/day in 2019 to a peak of 774 tonnes/day in 2020, before declining to 705 tonnes/day in 2022 and increasing again to 743 tonnes/day in 2023. The quantity of BMW treated increased from 544 tonnes/day in 2019 to 721 tonnes/day in 2021, declined to 645 tonnes/day in 2022, and increased to 694 tonnes/day in 2023 (Figure 1). The aggregate generation-to-treatment ratio was 87.9% in 2019, increased to 91.5% in 2020, reached a peak of 94.4% in 2021, was 91.5% in 2022, and was 93.4% in 2023. The difference between reported BMW generation and treatment was 75 tonnes/day in 2019, 66 tonnes/day in 2020, 43 tonnes/day in 2021, 60 tonnes/day in 2022, and 49 tonnes/day in 2023 (Table 1, Figure 2).
The number of healthcare facilities (HCFs) increased from 322,425 in 2019 to 435,257 in 2023, while the number of Common Biomedical Waste Treatment Facilities (CBWTFs) increased from 202 to 234 during the same period (Table 2). BMW generation per CBWTF was 3.06 tonnes/day in 2019, peaked at 3.72 tonnes/day in 2020, and was 3.18 tonnes/day in 2023. BMW generation per HCF decreased from 0.00192 tonnes/day in 2019 to 0.00171 tonnes/day in 2023.
The present study demonstrated an overall increase in biomedical waste (BMW) generation in India between 2019 and 2023, although the annual trend showed fluctuations, with a peak of 774 tonnes/day in 2020, followed by a decline to 705 tonnes/day in 2022 and a subsequent rise to 743 tonnes/day in 2023. These fluctuations occurred during and following the COVID-19 pandemic. This trend was accompanied by an increase in the aggregate generation-to-treatment ratio and in the reported numbers of healthcare facilities and Common Biomedical Waste Treatment Facilities (CBWTFs). However, a persistent difference between reported BMW generation and treatment was observed across all years. The facility-based indicators described changes in reported waste generation relative to the number of healthcare and treatment facilities.
The observed increase in biomedical waste generation is consistent with global concerns regarding increased healthcare waste during the COVID-19 pandemic. Previous studies have highlighted the increased use of personal protective equipment, testing materials, and disposable medical supplies, which placed additional pressure on existing waste management systems [1,8,9]. Globally, healthcare waste generation varies widely, ranging from 0.14 to 6.10 kg/bed/day, reflecting substantial differences in healthcare waste generation across countries [10].
The findings of the present study are consistent with concerns reported in the international literature regarding challenges in biomedical waste management, particularly in relation to segregation, infrastructure, treatment practices and regulatory implementation [9,10]. However, the specific factors contributing to the treatment gaps observed in the present study could not be established from the national aggregate data analysed. The increase in the aggregate generation-to-treatment ratio observed in this study indicates that a higher proportion of reported biomedical waste was treated relative to the quantity generated over the study period. However, the increased healthcare waste burden during public health emergencies has highlighted challenges in maintaining sustainable waste management systems [1,8,9].
An additional finding of the present study was the change in facility-based indicators over time. Biomedical waste generated per Common Biomedical Waste Treatment Facility (CBWTF) was 3.06 tonnes/day in 2019, peaked at 3.72 tonnes/day in 2020, and was 3.18 tonnes/day in 2023. Biomedical waste generated per healthcare facility decreased from 0.00192 tonnes/day in 2019 to 0.00171 tonnes/day in 2023. These ratios describe reported waste generation relative to the number of facilities but do not provide sufficient information to establish whether treatment capacity matched demand or to measure actual facility utilization.
Although the reported number of healthcare facilities increased nationally during the study period, national aggregate figures do not reflect their geographical distribution or the equity of access to biomedical waste management services. CPCB annual reports provide state- and union territory-wise information on healthcare facilities, including bedded and non-bedded facilities, their authorisation status, and utilisation of Common Biomedical Waste Treatment Facilities (CBWTFs) [3–7]. These data could support further assessment of regional variations in healthcare facility distribution and reported biomedical waste management indicators. However, the present national-level analysis did not examine these state-level differences or assess rural–urban and public–private ownership disparities. Further disaggregated analyses are therefore required to identify geographical and institutional gaps and guide targeted policy interventions.
Despite the increase in the aggregate generation-to-treatment ratio, the present study identified a persistent gap between biomedical waste generation and treatment across all years. Previous studies have identified uneven distribution of treatment facilities, operational inefficiencies, and limited access to Common Biomedical Waste Treatment Facilities as possible factors affecting biomedical waste management [10]. CPCB reports have also highlighted regional disparities in biomedical waste management within India [3–7]. Improper segregation and mixing of hazardous and non-hazardous healthcare waste have been identified in the literature as important challenges in biomedical waste management. The World Health Organization estimates that approximately 85% of healthcare waste is non-hazardous, while the remaining 15% is hazardous. Inadequate segregation may result in otherwise general waste being mixed with hazardous waste, increasing the quantity requiring specialised handling and treatment [11]. However, segregation practices were not assessed in the present study, and their contribution to the observed generation–treatment differences could not be determined.
An important implication of this study is that increases in the reported numbers of healthcare facilities and CBWTFs should be considered alongside the aggregate generation-to-treatment ratio and the difference between reported BMW generation and treatment. The extent to which infrastructure availability, facility utilization, and operational management contribute to the observed treatment gaps could not be established in this study. Further investigation of these factors, alongside strengthening monitoring systems and compliance with segregation protocols, may help inform improvements in biomedical waste management.
From a policy perspective, these findings highlight the need to complement infrastructure expansion with stronger implementation of biomedical waste management regulations. Measures such as improving segregation at source, enhancing digital tracking systems, ensuring appropriate authorisation of healthcare facilities, and strengthening monitoring and enforcement mechanisms may help improve biomedical waste management. International comparisons of biomedical waste management policies also highlight the importance of regulatory frameworks and appropriate waste management practices in strengthening healthcare waste management systems [12]. This study relied on published national aggregate data from CPCB annual reports, and the completeness and accuracy of the underlying data could not be independently verified. The difference between reported BMW generation and treatment does not establish the fate of the difference or identify its causes. Similarly, facility counts and waste generation per facility are descriptive indicators and do not directly measure treatment capacity or actual facility utilisation. These limitations should be considered when interpreting the findings and their implications for biomedical waste management in India.
Biomedical waste generation in India increased substantially between 2019 and 2023, accompanied by an increase in the aggregate generation-to-treatment ratio and increases in the reported numbers of healthcare facilities and biomedical waste treatment facilities. Despite these advances, persistent gaps between waste generation and treatment were observed throughout the study period, highlighting limitations in interpreting overall system performance. The findings highlight the importance of monitoring the aggregate generation-to-treatment ratio alongside the difference between reported biomedical waste generation and treatment. Strengthening waste segregation, regulatory monitoring, and implementation of biomedical waste management practices remains important for improving the safety and sustainability of biomedical waste management systems in India. Further research should explore state-level variations and investigate whether treatment capacity, facility utilisation, or operational and regulatory factors contribute to the observed generation–treatment differences.
What is already known about the topic
What this study adds
The authors acknowledge the Central Pollution Control Board (CPCB), Government of India, for making biomedical waste management data publicly available.
Data availability
The datasets analyzed during the current study are publicly available in the annual Biomedical Waste Management Reports published by the Central Pollution Control Board (CPCB), Government of India.
Conceptualization: Navjot Singh and Sumreen Bhatia
Methodology: Navjot Singh and Sumreen Bhatia
Data Curation: Navjot Singh and Sumreen Bhatia
Formal Analysis: Navjot Singh and Sumreen Bhatia
Project Administration: Navjot Singh and Sumreen Bhatia
Validation: Navjot Singh and Sumreen Bhatia
Visualization: Navjot Singh and Sumreen Bhatia
Writing – Original Draft: Navjot Singh and Sumreen Bhatia
Writing – Review & Editing: Navjot Singh and Sumreen Bhatia
| Table 1: Treatment gap and aggregate generation-to-treatment ratio in India, 2019–2023 | ||
| Year | Treatment Gap (tonnes/day) | Aggregate generation-to-treatment ratio (%) |
|---|---|---|
| 2019 | 75 | 87.9 |
| 2020 | 66 | 91.5 |
| 2021 | 43 | 94.4 |
| 2022 | 60 | 91.5 |
| 2023 | 49 | 93.4 |
| Abbreviations: BMW, Biomedical Waste; HCFs, Healthcare facilities; CBWTFs, Common Biomedical Waste Treatment Facilities. | ||
| Table 2: Number of healthcare facilities and Common Biomedical Waste Treatment Facilities in India, 2019–2023 | ||
| Year | Number of HCFs | Number of CBWTFs |
|---|---|---|
| 2019 | 322,425 | 202 |
| 2020 | 352,014 | 208 |
| 2021 | 375,256 | 215 |
| 2022 | 393,939 | 218 |
| 2023 | 435,257 | 234 |
| Abbreviations: HCFs, Healthcare facilities; CBWTFs, Common Biomedical Waste Treatment Facilities. | ||