
Systematic Review | Open Access | Volume 9 (4): Article 189 | Published: 12 Nov 2026

Views: 101
Menu, Tables and Figures
| Author (Year) | Location | Study Design | Population | Sample Size (N) | Physical Activity Tool | NCD Outcome | Main Finding |
|---|---|---|---|---|---|---|---|
| Oguoma et al. (2016) [5] | – | Cross-sectional | Apparently healthy adults (≥ 18 years) | 422 | WHO Global Physical Activity Questionnaire (GPAQ) | Metabolic syndrome, prediabetes, diabetes | Prediabetes (OR = 1.69) and diabetes (OR = 1.91) were associated with physical inactivity; no significant association was found with metabolic syndrome. |
| Idris et al. (2024) [6] | Kaduna (Northwest) | Cross-sectional | Female traders aged ≥ 18 years | 79 | Self-reported activity based on WHO adult physical activity recommendations | Obesity based on BMI ≥ 30 kg/m² | Inactive women had higher, but non-significant, odds of obesity (OR = 1.90; p = 0.206). |
| Ogunyemi et al. (2023) [7] | Osun (Southwest) | Cross-sectional | University staff | 500 | IPAQ-SF | Cardiovascular disease (CVD) risk | Physical inactivity (37.6%) and CVD risk (61.0%) were common. Older age, female sex, work-related stress, and obesity were significantly associated with higher CVD risk. |
| Anthony et al. (2019) [8] | FCT (North-Central) | Descriptive cross-sectional | Adults from rural communities | 420 | Interviewer-administered questionnaire | Hypertension | Hypertension prevalence was 38.3%, and physical inactivity was associated with hypertension. |
| Olufayo et al. (2023) [9] | Ibadan (Southwest) | Cross-sectional | First-year university students | 546 | Interviewer-administered questionnaire | CVD risk factors | Physical inactivity prevalence was 94.5%; clustering of ≥2 CVD risk factors occurred in 23.4% |
| Odukoya et al. (2024) [10] | Lagos (Southwest) | Cross-sectional | Adults with diabetes | 357 | Interviewer-administered questionnaire | Diabetes/CVD risk factors | Inadequate physical activity was 56%; 40.3% had ≥3 coexisting CVD risk factors |
| Adetayo et al. (2026) [11] | Abuja (North-Central) | Comparative cross-sectional | Adults from rural and urban communities | 1,868 | WHO STEPS-based questionnaire | Elevated BP, diabetes, overweight/obesity | Physical inactivity was 76.9% in rural and 70.4% in urban participants. Elevated BP was 37.2% vs 44.3%, diabetes was 5.4% vs 3.2% and obesity was 5.7% vs 8.0% respectively |
| Olawuyi & Adeoye (2018) [12] | Ibadan (Southwest) | Cross-sectional | Civil Servants | 606 | WHO STEPwise approach | Obesity, raised BP, raised blood sugar | Low PA prevalence was 62.2%; obesity 57.3%, raised BP 33.1%, and raised blood sugar 7.1%. |
| Effiwatt et al. (2026) [13] | Calabar (South-South) | Cross-sectional | Commercial Drivers | 380 | Adapted WHO STEPS | Hypertension; predicted 10-year CVD Risk | Hypertension prevalence was ~40%; older age, high BMI, longer driving duration, and elevated fasting glucose were associated with hypertension |
| Dele-Ojo et al. (2021) [14] | Ado-Ekiti (Southwest) | Cross-sectional | University staff | 223 | – | Hypertension, diabetes, obesity | Physical inactivity was 83%; hypertension 35.4%, diabetes 12.1%, and obesity 23.3%. |
| Buremoh et al. (2020) [15] | Ibadan (Southwest) | Cross-sectional | Nurses | 196 | Structured questionnaire; exercise frequency | Overweight/obesity | 32% exercised moderately <once/week ; obesity was associated with frequent fried food intake and family history of CVD |
| Oladoyinbo et al. (2019) [16] | Abeokuta (Southwest) | Descriptive cross-sectional | Traders | 350 | Validated semi-structured questionnaire | Overweight/obesity | 41.4% had low PA; overweight 24.0%, obesity 3.7%. No significant association between PA and BMI. |
| Olaitan & Oladejana (2026) [17] | Ondo West (Southwest) | Cross-sectional | Commercial drivers | 300 | Interviewer-administered questionnaire; brisk walking assessed | Elevated blood pressure (EBP) | Elevated blood pressure prevalence was 29.3%; brisk walking was associated with elevated blood pressure (AOR = 1.96; 95% CI: 1.09–3.51; p = 0.023). |
| Chigbu et al. (2020) [18] | Enugu (South-South) | Cross-sectional | Adults | 6,628 | Structured interviewer-administered questionnaire | Obesity/overweight | Physical inactivity was associated with higher odds of obesity (AOR = 1.43; 95% CI: 1.19–1.71) and overweight (AOR 1.23; 95% CI: 1.09–1.39) |
| Adeniyi et al. (2016) [19] | Ibadan (Southwest) | Cross-sectional | Patients with type 2 diabetes and their adult children. | 315 | International Physical Activity Questionnaire (IPAQ) | Type 2 diabetes | Physical inactivity was higher among diabetic parents (50.3%) than their adult children (28.5%) |
| Ogwumike et al. (2016) [20] | – | Cross-sectional survey | Postmenopausal Women | 310 | IPAQ | Overall obesity and abdominal obesity | Obesity was significantly associated with lower physical activity; PA was associated with overall obesity but not abdominal obesity. |
| Adeniyi et al. (2010) [21] | Ibadan and Kano (Southwest and Northwest) | Cross-sectional comparative | T2D patients and matched non-diabetic adults | 496 | IPAQ | T2D | T2D patients were less sedentary (27.4%) than nondiabetic participants (37.5%); PA levels differed significantly (p < 0.001). |
| Oseni et al. (2024) [22] | Edo (South-South) | Descriptive cross-sectional | Adults with hypertension and/or diabetes | 394 | Semi-structured questionnaire | 10-year cardiovascular disease risk (Framingham Risk Score) | Physical inactivity was significantly associated with high 10-year CVD risk (OR = 2.45; 95% CI 1.53–3.92). |
| Idowu et al. (2013) [23] | Ekiti (Southwest) | Cross-sectional | Patients with hypertension | 212 | IPAQ | Hypertension | Physical inactivity prevalence was 56.1% among patients with hypertension. |
| Onwuakagba et al. (2023) [24] | Anambra (South-East) | Cross-sectional community survey | Adults with previous stroke | 310 | – | Stroke risk using Modified Framingham Stroke Risk Score (MFSRS) | Physical inactivity prevalence was 43.2%; 16% had moderate to high predicted stroke risk |
| Maduka & Ojimah (2020) [25] | Rivers (South-South) | Descriptive cross-sectional | Judiciary staff | 226 | Adapted WHO STEPS instrument | CVD risk | Physical inactivity prevalence was 39.8% and was associated with predicted moderate CVD risk (OR = 4.17; 95% CI: 1.92–9.10). |
| Showande & Odukoya (2020) [26] | Ibadan (Southwest) | Cross-sectional | Motor vehicle drivers | 152 | IPAQ-Short Form | Hypertension, diabetes, obesity | Physical inactivity prevalence was 52.6%; inactivity differed significantly across CVD risk-factor clusters (p = 0.020). |
| Oladimeji et al. (2014) [27] | Kaduna (Northwest) | Cross-sectional | Civil servants | 801 | WHO STEPS/CDC BRFSS based structured questionnaire | Hypertension, obesity | Physical inactivity was 91%; overweight/obesity was more prevalent among inactive participants, while no significant association with hypertension was found. |
| Adeyanju et al. (2023) [28] | Rivers (South-South) | Cross-sectional analytical study | Staff of two multinational companies | 296 | Semi-structured questionnaire | Obesity | Physical inactivity was 58.1%; regular exercise was associated with lower odds of obesity. |
| Amadi et al. (2018) [29] | Lagos (Southwest) | Cross-sectional | Drivers | 293 | – | Hypertension, diabetes, obesity and CVD risk factors | Physical inactivity prevalence was 50.9%; hypertension, diabetes, and obesity prevalences were 39.7%, 13.9%, and 21.1%, respectively. |
| Ogunmola et al. (2013) [30] | Ekiti (Southwest) | Descriptive cross-sectional | Community-dwelling adults aged ≥40 years | 104 | Modified Health Insurance Plan (HIP) physical activity measure | Hypertension, diabetes mellitus, and obesity | Physical inactivity prevalence was 29.8%. Hypertension, diabetes and obesity prevalence were 66.4%, 4.8% and 14.4%, respectively. |
| Odugbemi et al. (2012) [31] | Lagos (Southwest) | Descriptive cross-sectional | Adult traders | 400 | Structured questionnaire | Hypertension, diabetes mellitus, and obesity | Physical inactivity prevalence was 92%; hypertension, diabetes mellitus, and obesity prevalence were 34.8%, 0.8%, and 12.3%, respectively. |
Note. AOR = adjusted odds ratio; BMI = body mass index; BP = blood pressure; BRFSS = Behavioral Risk Factor Surveillance System; CI = confidence interval; CVD = cardiovascular disease; EBP = elevated blood pressure; GPAQ = Global Physical Activity Questionnaire; HIP = Health Insurance Plan; IPAQ = International Physical Activity Questionnaire; IPAQ-SF = International Physical Activity Questionnaire–Short Form; MFSRS = Modified Framingham Stroke Risk Score; NCD = non-communicable disease; OR = odds ratio; PA = physical activity; T2D = type 2 diabetes; WHO STEPS = WHO STEPwise approach to noncommunicable disease risk-factor surveillance.
Table 1: Characteristics of included studies
| Study | NCD outcome | Exposure/comparator | Effect measure | Effect estimate (95% CI) | p-value | Finding |
|---|---|---|---|---|---|---|
| Chigbu et al. (2020) [18] | Obesity | Physically inactive vs physically active | AOR | 1.43 (1.19–1.71) | <0.001 | Physical inactivity was significantly associated with higher odds of obesity. |
| Idris et al. (2024) [6] | Obesity | Physically inactive vs physically active | OR | 1.90 (0.70–5.20) | 0.206 | Physical inactivity was associated with higher odds of obesity, although the association was not statistically significant. |
| Oseni et al. (2024) [22] | High 10-year CVD risk | Physically inactive vs physically active | OR | 2.45 (1.53–3.92) | <0.01 | Physically inactive participants had significantly higher odds of elevated CVD risk. |
| Maduka & Ojimah (2020) [25] | Moderate CVD risk | Physically inactive vs physically active | OR | 4.17 (1.92–9.10) | <0.001 | Physical inactivity was significantly associated with higher odds of moderate CVD risk. |
| Adeyanju et al. (2023) [28] | Overweight/obesity | None/rare exercise vs sometimes/always | AOR | 0.70 (0.43–1.12) | 0.315 | Regular exercise was associated with lower adjusted odds of elevated BMI, but the association was not statistically significant. |
| Oguoma et al. (2016) [5] | Diabetes mellitus | Physically inactive vs physically active | OR | 1.91 (0.65–5.63) | >0.05 | Physical inactivity was associated with higher odds of diabetes, but the association was not statistically significant. |
| Multiple included studies | Hypertension | – | – | – | – | Physical inactivity was reported among hypertensive populations, but sufficiently comparable effect estimates for the physical inactivity–hypertension association were unavailable. |
Note. AOR = adjusted odds ratio; CI = confidence interval; CVD = cardiovascular disease; OR = odds ratio.
Table 2: Association between physical inactivity and non-communicable disease outcomes among included studies
| NCD outcome | Studies pooled | Pooled OR (95% CI) | I² | Q | Heterogeneity p-value |
|---|---|---|---|---|---|
| Obesity | 2 | 1.44 (1.20–1.72) | 0% | 0.31 | 0.581 |
| CVD risk | 2 | 2.91 (1.79–4.74) | 24% | 1.31 | 0.252 |
| Hypertension | Narrative synthesis only | – | – | – | – |
| Diabetes mellitus | Narrative synthesis only | OR = 1.91 (0.65–5.63) | – | – | – |
Note. CI = confidence interval; CVD = cardiovascular disease; I² = I-squared statistic; OR = odds ratio; Q = Cochran’s Q statistic. Each pooled estimate is based on 2 studies; hypertension and diabetes mellitus were synthesised narratively.
Table 3: Pooled effect estimates for the association between physical inactivity and non-communicable disease outcomes in Nigeria
| Study | Q1 | Q2 | Q3 | Q4 | Q5 | Q6 | Q7 | Overall judgement |
|---|---|---|---|---|---|---|---|---|
| Chigbu et al. (2020) [18] | Y | Y | Y | Y | Y | Y | Y | Low risk |
| Idris et al. (2024) [6] | Y | Y | U | Y | Y | N | Y | Some concerns |
| Oseni et al. (2024) [22] | Y | Y | Y | Y | Y | Y | Y | Low risk |
| Maduka & Ojimah (2020) [25] | Y | Y | Y | U | Y | Y | Y | Some concerns |
| Adeyanju et al. (2023) [28] | Y | Y | U | Y | Y | Y | Y | Some concerns |
| Oguoma et al. (2016) [5] | Y | Y | Y | Y | Y | U | Y | Some concerns |
| Anthony et al. (2019) [8] | Y | Y | U | Y | Y | Y | Y | Some concerns |
| Ogunyemi et al. (2023) [7] | Y | Y | Y | Y | Y | Y | Y | Low risk |
| Olufayo et al. (2023) [9] | Y | Y | U | Y | U | U | Y | Some concerns |
| Odukoya et al. (2024) [10] | Y | Y | Y | Y | Y | Y | Y | Low risk |
| Adetayo et al. (2026) [11] | Y | Y | Y | U | Y | Y | Y | Some concerns |
| Olawuyi & Adeoye (2018) [12] | Y | Y | Y | Y | Y | Y | Y | Low risk |
| Effiwatt et al. (2026) [13] | Y | Y | Y | U | Y | Y | Y | Some concerns |
| Dele-Ojo et al. (2021) [14] | Y | U | U | U | U | U | Y | Some concerns |
| Buremoh et al. (2020) [15] | Y | Y | U | Y | Y | U | Y | Some concerns |
| Oladoyinbo et al. (2019) [16] | Y | Y | U | Y | U | U | Y | Some concerns |
| Olaitan & Oladejana (2026) [17] | Y | Y | U | Y | Y | Y | Y | Some concerns |
| Ogwumike et al. (2016) [20] | Y | Y | Y | Y | Y | Y | Y | Low risk |
| Adeniyi et al. (2010) [21] | Y | Y | Y | Y | U | U | Y | Some concerns |
| Adeniyi et al. (2016) [19] | Y | Y | Y | Y | U | U | Y | Some concerns |
| Idowu et al. (2013) [23] | Y | Y | Y | Y | U | N | Y | Some concerns |
| Onwuakagba et al. (2023) [24] | Y | Y | U | Y | Y | U | Y | Some concerns |
| Showande & Odukoya (2020) [26] | Y | Y | Y | Y | Y | U | Y | Some concerns |
| Oladimeji et al. (2014) [27] | Y | Y | Y | Y | Y | Y | Y | Low risk |
| Amadi et al. (2018) [29] | Y | Y | U | Y | Y | Y | Y | Some concerns |
| Ogunmola et al. (2013) [30] | Y | Y | Y | Y | Y | Y | Y | Low risk |
| Odugbemi et al. (2012) [31] | Y | Y | U | Y | U | U | Y | Some concerns |
Note. Q1–Q7 = appraisal questions 1–7; Y = yes; N = no; U = unclear.
Table 4: Risk-of-bias assessment of included studies using the Joanna Briggs Institute Critical Appraisal Tool
Tochukwu Chinenye Mercy1,&, Aminah Opeyemi Tiamiyu1, Timothy Winner Abosede1, Rahmat Tijani1, Ibrahim Attah Tijani1, Polycarp Dauda Madaki2
1Ahmadu Bello University, Zaria, Kaduna State, Nigeria, 2Department of Veterinary Tropical Diseases, University of Pretoria, South Africa
&Corresponding author: Tochukwu Chinenye Mercy, Ahmadu Bello University, Zaria, Kaduna State, Nigeria, Email: mercychinenye91@gmail.com ORCID: https://orcid.org/0009-0008-1478-4041
Received: 30 Aug 2025, Accepted: 05 Nov 2026, Published: 12 Nov 2026
Domain: Non-Communicable Disease Epidemiology
Keywords: physical inactivity, non-communicable diseases, obesity, cardiovascular disease risk, Nigeria
©Tochukwu Chinenye Mercy et al. Journal of Interventional Epidemiology and Public Health (ISSN: 2664-2824). This is an Open Access article distributed under the terms of the Creative Commons Attribution International 4.0 License (https://creativecommons.org/licenses/by/4.0/), which permits unrestricted use, distribution, and reproduction in any medium, provided the original work is properly cited.
Cite this article: Tochukwu Chinenye Mercy et al. Association between physical inactivity and major non-communicable diseases among adults in Nigeria: A systematic review and meta-analysis. Journal of Interventional Epidemiology and Public Health. 2026; 9(4):189. https://doi.org/10.37432/jieph-d-26-00346
Introduction: Physical inactivity is a modifiable risk factor for non-communicable diseases (NCDs), but evidence on its association with NCD outcomes among Nigerian adults remains inconsistent. This review synthesized available evidence.
Methods: The review was registered with PROSPERO (CRD420261367263) and conducted according to PRISMA 2020. PubMed/MEDLINE, Scopus, Web of Science, African Journals Online, and Google Scholar were searched for studies published from January 2010 to the date. Eligible studies examined physical inactivity and NCD outcomes in Nigerian adults ≥18 years. Risk of bias was assessed using the Joanna Briggs Institute Critical Appraisal Tool. Odds ratios (ORs) were pooled using a DerSimonian–Laird random-effects model when at least two comparable estimates were reported. Heterogeneity was assessed using Cochran’s Q and I².
Results: Of 603 records, 27 cross-sectional studies were included. Two studies each contributed to meta-analyses of obesity and cardiovascular disease (CVD) risk. Physical inactivity was associated with higher odds of obesity (pooled OR=1.44, 95% CI: 1.20–1.72; I²=0%) and elevated CVD risk (pooled OR=2.91, 95% CI: 1.79–4.74; I²=24%). The obesity estimate was exploratory because one study reported an adjusted and the other an unadjusted estimate. Hypertension and diabetes were synthesized narratively; one study reported OR=1.91 (95% CI: 0.65–5.63) for diabetes. Evidence was insufficient for stroke and cancer.
Conclusion: Physical inactivity was associated with obesity and elevated CVD risk among Nigerian adults. However, all included studies were cross-sectional, preventing assessment of temporality and leaving reverse causality possible. The small number of studies and differences in effect-estimate adjustment limit certainty. Prospective studies using standardized measures are needed.
Non-communicable diseases (NCDs) are chronic disorders arising from interactions among genetic, physiological, environmental, and behavioural factors. They remain a major public health concern, particularly in low- and middle-income countries (LMICs), and are the leading cause of death worldwide. In 2021, NCDs caused approximately 43 million deaths, accounting for almost 75% of deaths unrelated to the COVID-19 pandemic. More than four-fifths of these deaths occurred in LMICs, including 18 million premature deaths among people younger than 70 years. Modifiable behavioural risk factors, including physical inactivity, tobacco use, unhealthy diets, harmful alcohol use, and air pollution, contribute substantially to the NCD burden. Given the considerable health and socioeconomic impacts of these diseases, strengthening prevention through early detection, screening, treatment, and the promotion of healthy lifestyles remains a global public health priority [1].
Physical inactivity refers to engaging in insufficient physical activity to meet recommended levels for health [2]. In this review, physical inactivity and insufficient physical activity were treated as exposure categories as defined by the individual studies. The included studies used different instruments and criteria, including the International Physical Activity Questionnaire (IPAQ), Global Physical Activity Questionnaire (GPAQ), WHO STEPS-based questionnaires, and study-specific measures.
Physical inactivity is an important modifiable risk factor for premature mortality and several NCDs. Available estimates attribute 7.6% of cardiovascular disease deaths and 7.2% of all deaths worldwide to insufficient physical activity. Physical inactivity is also associated with the burden of several chronic conditions; reported population attributable fractions range from 8.1% for dementia to 1.6% for hypertension. These estimates highlight the importance of promoting regular physical activity as a strategy for reducing the global burden of NCDs [3].
Physical inactivity has become an important public health concern in Nigeria. A previous systematic review and meta-analysis estimated that more than half of Nigerian adults were physically inactive, with higher prevalence among women than men and in urban than rural populations. It also reported an increase in physical inactivity between 1995 and 2020, indicating a growing public health burden [4]. Although previous research has documented the prevalence of physical inactivity in Nigeria, evidence on its association with major NCDs among Nigerian adults remains inconsistent across populations, settings, and outcomes. Consequently, the magnitude and consistency of these associations remain unclear, limiting the use of this evidence in policy and practice.
The research question was: What is the association between physical inactivity and major non-communicable diseases among adults in Nigeria? This systematic review and meta-analysis aimed to identify, critically appraise, and synthesise available evidence on the association between physical inactivity and major NCDs among Nigerian adults. Specifically, it assessed the methodological quality of included studies, examined heterogeneity, estimated pooled measures of association where appropriate, and identified evidence gaps to inform future research and public health policy.
Protocol and reporting guideline
This systematic review and meta-analysis was conducted and reported in accordance with the Preferred Reporting Items for Systematic Reviews and Meta-Analyses (PRISMA) 2020 guideline. The methods for study identification, screening, eligibility assessment, data extraction, risk-of-bias assessment, and quantitative synthesis were established before the final synthesis. To reduce the risk of outcome-selection and reporting bias, the protocol was registered prospectively with the International Prospective Register of Systematic Reviews (PROSPERO; CRD420261367263).
PECO framework
Population: Adults aged 18 years and above residing in Nigeria. Eligible studies were required to provide data from populations living within Nigeria and could include community-dwelling adults, occupational groups, patients attending health facilities, and other adult population groups. Studies conducted in urban, peri-urban, or rural settings were eligible.
Exposure: Physical inactivity or insufficient physical activity, defined according to the criteria used in each individual study. Studies were not reclassified using a single universal threshold because the original studies used different instruments, definitions, and classification thresholds. The reported definition and assessment method for physical inactivity were extracted for each study. Differences in exposure definitions were considered when assessing comparability, and outcomes with substantially different exposure definitions were synthesized narratively rather than pooled.
Comparator: Adults meeting recommended physical activity levels or those classified as physically active.
Outcome: The review considered major NCD outcomes reported in the eligible studies, including overweight/obesity, hypertension or elevated blood pressure, diabetes mellitus, cardiovascular disease or predicted cardiovascular disease risk, stroke or predicted stroke risk, cancer, and chronic respiratory diseases. Outcome definitions and measurement methods were retained as reported by the individual studies and were extracted during data collection. Examples included body mass index-based definitions for overweight/obesity, study-defined blood pressure criteria for hypertension or elevated blood pressure, and validated risk scores such as the Framingham Risk Score for predicted CVD risk and the Modified Framingham Stroke Risk Score for predicted stroke risk. Differences in outcome definitions and measurement methods were considered when determining whether estimates were sufficiently comparable for quantitative synthesis.
Inclusion criteria
Studies were qualified if they: included Nigerian citizens who were at least eighteen years old; examined physical inactivity as the exposure and documented one or more main non-communicable disease outcomes; used observational research designs, such as cohort, cross-sectional, or case-control studies; reported effect estimates or supplied adequate data to generate measures of association; and were published in English-language peer-reviewed journals between January 2010 and the database’s completion date.
Exclusion criteria
Studies were disqualified if they were carried out outside of Nigeria or did not provide Nigerian data that could be extracted; were letters, research procedures, case reports, case series, conference abstracts, reviews, editorials, and commentary; did not report eligible major non-communicable disease outcomes or evaluate physical inactivity and were duplicate papers; or did not provide enough quantitative data for analysis.
Outcomes
The primary outcome was the association between physical inactivity and each eligible NCD outcome. Measures of association included odds ratios (ORs), adjusted odds ratios (AORs), risk ratios, prevalence ratios, or other comparable effect estimates with corresponding 95% confidence intervals (CIs). Secondary outcomes included the prevalence of physical inactivity, differences in physical activity assessment methods, and findings from studies that could not be pooled because of differences in exposure definitions, outcome definitions, or reported effect measures.
Information sources and search strategy
A comprehensive literature search was conducted in PubMed/MEDLINE, Scopus, Web of Science, African Journals Online (AJOL), and Google Scholar. Reference lists of included studies and relevant review articles were also searched manually to identify additional eligible studies. Studies published from January 2010 to the date of the final database search were eligible. Search terms were developed in accordance with the review question and PECO framework by combining free-text terms related to physical inactivity, NCDs, and Nigeria with controlled vocabulary, including Medical Subject Headings (MeSH), where appropriate.
The search syntax was adapted for each database, using the Boolean operators AND and OR. The search strategy combined the following concepts: (“physical inactivity” OR “insufficient physical activity” OR “low physical activity”) AND (hypertension OR diabetes OR obesity OR overweight OR stroke OR “cardiovascular disease” OR cancer) AND Nigeria.
The searches identified 111 records in PubMed/MEDLINE, 206 in Scopus, 166 in Web of Science, 80 in AJOL, and 40 in Google Scholar, yielding 603 records before deduplication. Reference lists of relevant articles were also searched manually.
Study selection
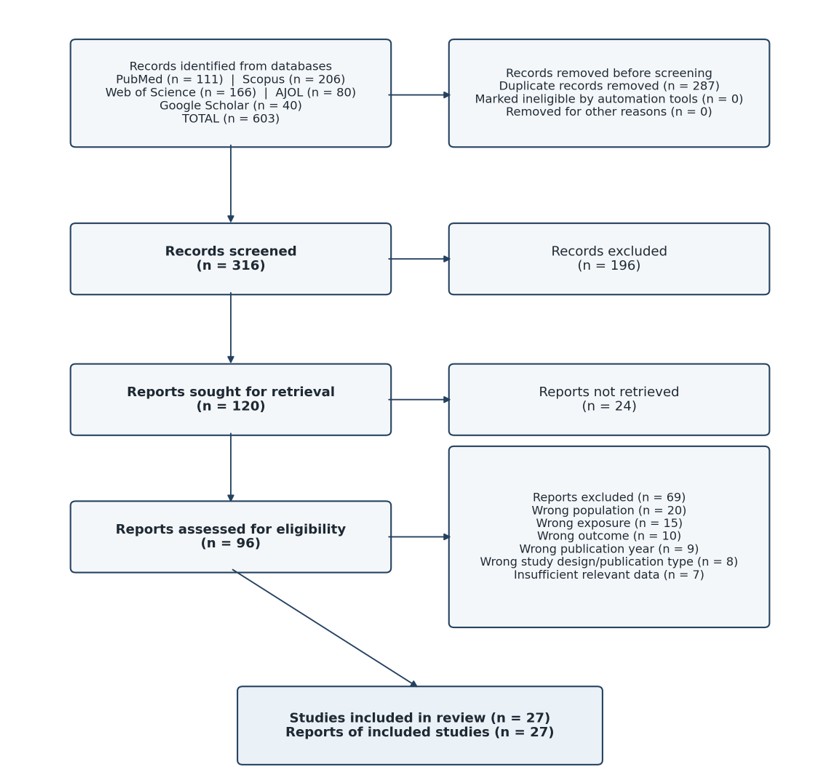
Before screening, records retrieved from the databases were compiled and duplicates removed. Of the 603 records identified, 287 duplicates were removed, leaving 316 records for title and abstract screening. After title and abstract screening, 196 records were excluded, and 120 reports were sought for full-text retrieval. Twenty-four reports could not be obtained, leaving 96 full-text reports for eligibility assessment. Of these, 69 were excluded for not meeting one or more eligibility criteria, and 27 studies were included in the review. A PRISMA 2020 flow diagram was used to record the study-selection procedure.
Data extraction
A standardised data-extraction form was used to obtain data from qualifying research. Among the data that were extracted were:
Where a study provided sufficient raw numerical data but did not report an effect estimate, an OR and corresponding 95% CI were calculated when feasible. Studies that could not contribute to the meta-analysis because their estimates were not sufficiently comparable were retained in the systematic review and summarised narratively. Crude and/or adjusted measures of association were extracted as reported by the individual studies, together with the corresponding 95% confidence intervals and relevant p-values. The adjustment status of each effect estimate was recorded because differences in covariate adjustment may affect comparability between study estimates.
Risk-of-bias assessment
The updated Joanna Briggs Institute (JBI) Critical Appraisal Tool for Analytical Cross-Sectional Studies was used to evaluate the risk of bias.
Seven internal-validity domains were taken into account in the evaluation:
Each domain was rated as Yes, No, or Unclear. Rather than relying solely on a numerical summary score, overall judgements were classified as low risk of bias, some concerns, or high risk of bias according to the nature and significance of the methodological limitations identified. Risk-of-bias assessments were not the only reason for rejecting otherwise qualified research; rather, they served as a guide for interpreting the review’s conclusions.
Data synthesis and statistical analysis
Study characteristics and findings were first summarised narratively. Where at least two studies reported sufficiently comparable outcomes and effect estimates, odds ratios (ORs) with corresponding 95% confidence intervals (CIs) were pooled using a DerSimonian–Laird random-effects model with inverse-variance weighting. The level of adjustment of the reported effect estimates was considered when assessing comparability across studies. Where adjusted and unadjusted estimates were combined within the same meta-analysis, the potential influence of differences in covariate adjustment was considered when interpreting the pooled estimate. Because sensitivity analyses restricted to adjusted estimates were only considered where a sufficient number of adjusted estimates were available, no such analysis was undertaken when only one adjusted estimate was available.
Statistical heterogeneity was assessed using Cochran’s Q statistic and the I² statistic. Meta-analyses were conducted using Python version 3.13.5, and forest plots were generated using Matplotlib. Outcomes for which effect estimates were insufficiently comparable or where there were fewer than two suitable estimates were synthesized narratively.
Assessment of publication bias
Publication bias was not assessed because each outcome-specific meta-analysis included only 2 studies. Accordingly, funnel plots and Egger’s test were not performed; these methods are generally not informative when fewer than 10 studies are available.
Study selection
The database searches identified 603 records: 111 from PubMed/MEDLINE, 206 from Scopus, 166 from Web of Science, 80 from African Journals Online (AJOL), and 40 from Google Scholar. After 287 duplicates were removed, 316 records remained for title and abstract screening. Of these, 196 were excluded and 120 reports were sought for retrieval. 24 reports could not be accessed, so 96 full-text reports were assessed for eligibility. Following full-text assessment, 69 reports were excluded, and 27 studies were included in the review (Figure 1).
Characteristics of included studies
The 27 included studies represented diverse adult populations and settings across Nigeria. Participants included community-dwelling adults, occupational groups, traders, healthcare workers, drivers, and adults living with hypertension or diabetes. Studies were conducted across several geopolitical zones, including North-Central, Northwest, Southwest, Southeast, and South-South Nigeria, and encompassed urban, peri-urban, and rural populations. This diversity in geographical setting, occupation, and population characteristics was considered when interpreting the findings, as these factors may influence physical activity levels and NCD outcomes.
The studies varied considerably in sample size, population characteristics, setting, and outcomes assessed. For example, a study among 79 adult female traders in Kaduna assessed obesity using body mass index and reported higher, but non-significant, odds of obesity among physically inactive participants. In contrast, a large population-based study involving 6,628 adults in Enugu reported that physical inactivity was associated with higher adjusted odds of obesity. Among studies assessing CVD risk, one study of adults with hypertension and/or diabetes in Edo State used the Framingham Risk Score and found a significant association between physical inactivity and high 10-year CVD risk, while another study among judiciary staff in Rivers State reported an association between physical inactivity and predicted moderate CVD risk. Rural populations were also represented, including community-dwelling adults in Ekiti State and adults from rural communities in the Federal Capital Territory.
The International Physical Activity Questionnaire (IPAQ), Global Physical Activity Questionnaire (GPAQ), WHO STEPS-based questionnaires, and study-specific measures were used to assess physical activity across the included studies. Reported NCD outcomes included hypertension, diabetes mellitus, obesity/overweight, and cardiovascular disease or cardiovascular risk. No eligible study provided sufficient outcome-specific evidence on the association between physical inactivity and cancer or stroke for quantitative synthesis. Table 1 presents the characteristics of the included studies.
Rural and urban patterns
Both rural and urban populations were represented in the included studies. Rural studies reported substantial levels of physical inactivity and NCD burden. For example, a study among adults from rural communities in the Federal Capital Territory reported a physical inactivity prevalence of 38.3% and identified physical inactivity as associated with hypertension. A predominantly rural Nigerian study reported higher odds of diabetes among physically inactive participants, although the association was not statistically significant. Another rural community study in Ekiti reported a physical inactivity prevalence of 29.8%, with hypertension, diabetes, and obesity prevalences of 66.4%, 4.8%, and 14.4%, respectively.
A study that directly compared rural and urban populations in Abuja found physical inactivity to be higher in rural than urban participants (76.9% vs 70.4%). In contrast, elevated blood pressure and obesity were higher in urban participants, whereas diabetes was more prevalent among rural participants. These findings indicate that the relationship between physical inactivity and NCD outcomes may differ according to population and setting. However, direct rural-urban comparisons were limited to a few studies and should therefore be interpreted cautiously.
Physical inactivity across the included studies
There were significant differences in the prevalence of physical inactivity across the populations and included studies. Differences were also observed in the methods and thresholds used to classify physical inactivity. Some studies used standardized instruments such as IPAQ and GPAQ, while others used WHO STEPS-based or study-specific measures. Because of these differences in study populations, measurement instruments, and definitions of physical inactivity, prevalence estimates were synthesized narratively rather than pooled.
Association between physical inactivity and NCD outcomes
The direction and strength of associations between physical inactivity and NCD outcomes varied across the included studies. Studies with sufficiently comparable effect estimates were considered for quantitative synthesis, while findings from studies with incompatible effect measures were synthesised narratively. Evidence relating to obesity, CVD risk, hypertension, and diabetes mellitus (Table 2).
Meta-analysis
Meta-analysis was conducted for obesity and cardiovascular disease risk because at least two sufficiently comparable studies provided usable effect estimates for each outcome. Hypertension and diabetes mellitus were synthesised narratively because only one suitable effect estimate was available for each.
Physical inactivity and obesity
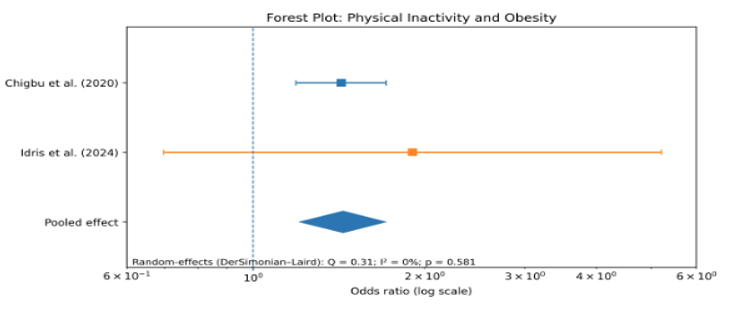
The meta-analysis that examined the association between obesity and physical inactivity included two studies [6,18]. No statistically detectable heterogeneity was observed (I² = 0%; Q = 0.31; p = 0.581), and the random-effects analysis revealed that physically inactive persons had 44% greater odds of obesity than physically active adults (pooled OR = 1.44; 95% CI: 1.20–1.72) (Figure 2).
Physical inactivity and cardiovascular disease risk
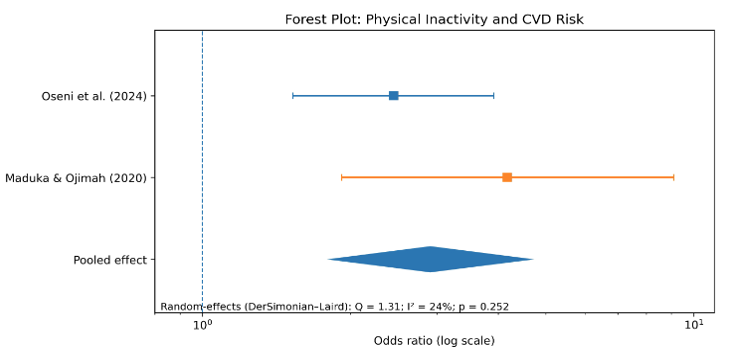
The meta-analysis of physical inactivity and cardiovascular disease (CVD) risk included two studies [22, 25]. The random-effects pooled estimate indicated higher odds of elevated CVD risk among physically inactive participants (pooled OR = 2.91; 95% CI: 1.79–4.74). No statistically significant heterogeneity was observed (I² = 24%; Q = 1.31; p = 0.252), although this result should be interpreted cautiously because only two studies were included (Figure 3).
Hypertension and diabetes mellitus
Although several included studies evaluated physical inactivity among people with hypertension or elevated blood pressure, sufficiently comparable effect estimates were not available for quantitative pooling; therefore, hypertension was synthesized narratively. One study reported that 56.1% of patients with hypertension were physically inactive [23], while another reported a physical inactivity prevalence of 91% among civil servants, among whom hypertension prevalence was 29% [27]. One study reported higher odds of physical inactivity among participants with diabetes mellitus (OR = 1.91; 95% CI: 0.65–5.63) [5]. However, the confidence interval included the null value, indicating substantial uncertainty in the estimate. Table 3 summarizes the pooled and narrative results.
Risk of bias
The updated Joanna Briggs Institute (JBI) Critical Appraisal Tool for Analytical Cross-Sectional Studies was used to evaluate the risk of bias. Of the 27 included studies, 19 (70.4%) raised some concerns, whereas 8 (29.6%) were judged to have a low risk of bias. None was judged to have a high risk of bias. The most common concerns related to inadequate or unclear handling of potential confounding and the validity and reliability of physical-activity assessment. Table 4 presents the full JBI risk-of-bias assessment.
Publication bias
Since only two papers were included in each outcome-specific meta-analysis, publication bias was not systematically evaluated. As a result, funnel plots and statistical tests for funnel-plot asymmetry were not carried out.
Principal findings
This systematic review and meta-analysis synthesized evidence from 27 studies examining the relationship between physical inactivity and non-communicable disease (NCD) outcomes among adults in Nigeria. Physical inactivity was frequently reported across diverse study populations, although its prevalence varied according to population characteristics, geographical setting, and the methods used to assess physical activity. Quantitative synthesis showed that physically inactive adults had 44% higher odds of obesity than physically active adults (pooled OR = 1.44; 95% CI: 1.20–1.72). Similarly, physical inactivity was associated with approximately threefold higher odds of elevated cardiovascular disease (CVD) risk (pooled OR = 2.91; 95% CI: 1.79–4.74). These findings indicate an association between physical inactivity and adverse cardiometabolic outcomes, although the small number of contributing studies limits the strength and generalizability of the pooled estimates.
Low statistical heterogeneity was observed for obesity (I² = 0%) and CVD risk (I² = 24%). However, these estimates should be interpreted cautiously because only two studies contributed to each meta-analysis. With such a small number of studies, both I² and Cochran’s Q have limited ability to detect between-study heterogeneity, and an I² of 0% should not be interpreted as evidence that the underlying studies are fully homogeneous. Hypertension and diabetes mellitus could not be quantitatively pooled because only 1 sufficiently comparable effect estimate was available for each outcome. Evidence for these outcomes was therefore interpreted narratively.
These findings are important given the substantial burden of physical inactivity in Nigeria. A previous systematic review and meta-analysis estimated that 52.0% of Nigerian adults were physically inactive, with a higher pooled prevalence among women than men and significantly higher levels of inactivity among urban populations [4]. Globally, approximately 31.3% of adults, equivalent to 1.8 billion people, did not meet recommended physical activity levels in 2022 [32]. The high prevalence of physical inactivity, together with the associations observed in the present review, suggests that increasing physical activity may represent an important modifiable target for NCD prevention in Nigeria.
The findings are broadly consistent with previous evidence linking insufficient physical activity with adverse cardiometabolic outcomes, although the strength and comparability of the evidence vary across outcomes. The pooled association with obesity was consistent in direction with findings from a global systematic review and meta-analysis [33], while a Nigerian observational study reported associations between physical activity and CVD risk factors [34]. Similarly, the observed association between physical inactivity and elevated CVD risk is consistent with prospective evidence indicating lower cardiovascular risk among individuals with higher levels of physical activity [37]. Evidence for hypertension and diabetes in this review was more limited, although available Nigerian and international studies generally support an inverse association between physical activity and cardiometabolic risk [39–43]. Differences in study populations, exposure definitions, outcome assessment, and adjustment for confounding, however, limit direct comparisons across studies.
Physical inactivity and obesity
The meta-analysis suggested that physical inactivity was associated with higher odds of obesity among adults, with a pooled odds ratio (OR) of 1.44 (95% CI: 1.20–1.72). This finding is consistent with evidence from a global systematic review and meta-analysis, which reported a significant association between physical inactivity and obesity (OR = 1.52; 95% CI: 1.23–1.87) [33]. However, the present finding should be interpreted cautiously because the pooled estimate was based on only 2 studies.
Evidence from Nigeria also supports an association between physical activity and obesity-related measures. Higher levels of moderate-to-vigorous physical activity have been reported to be negatively associated with waist circumference and body mass index among government workers in Maiduguri, suggesting that greater physical activity may be associated with more favourable body composition [34]. In addition, substantial variation in physical inactivity has been documented across Nigerian populations, with particularly high levels reported in some urban occupational groups [4]. These differences suggest that occupational characteristics, urban lifestyles, transportation patterns, and opportunities for recreational activity may influence the relationship between physical inactivity and obesity in Nigeria.
Several biological and behavioural mechanisms may underlie this association. Reduced physical activity lowers energy expenditure and may contribute to a positive energy balance and subsequent accumulation of body fat when energy intake is not correspondingly reduced. Regular physical activity may also improve insulin sensitivity and support healthier body composition, whereas prolonged physical inactivity may contribute to adverse metabolic changes [35].
Important methodological limitations should be considered when interpreting the pooled estimate. The two studies contributing to the meta-analysis reported effect estimates with different levels of adjustment: one study reported an adjusted OR of 1.43 (95% CI: 1.19–1.71), whereas the other reported a crude OR of 1.90 (95% CI: 0.70–5.20) [6,18]. Combining adjusted and crude estimates may introduce potential confounding bias because adjusted estimates account for measured covariates, whereas crude estimates do not. Consequently, the pooled OR of 1.44 should not be interpreted as a fully adjusted estimate of the association between physical inactivity and obesity.
A sensitivity meta-analysis restricted to adjusted estimates was not possible because only 1 of the 2 studies provided an adjusted estimate. The individual study estimates were directionally consistent, but differed in magnitude and statistical precision. The adjusted estimate was statistically significant, whereas the crude estimate was not [6,18]. The pooled finding should therefore be regarded as exploratory and interpreted cautiously, particularly given the small number of contributing studies and differences in covariate adjustment.
The absence of statistically detected heterogeneity should also be interpreted with caution. Although the pooled analysis yielded an I² of 0%, this does not establish that true heterogeneity was absent. With only 2 studies, both I² and Cochran’s Q have limited statistical power to detect between-study differences, and the estimates may be unstable. Thus, the observed I² of 0% should be understood as an absence of statistically detected heterogeneity rather than evidence of complete homogeneity. Differences in study populations, physical activity assessment methods, obesity definitions, and adjustment for confounding may still represent important sources of clinical and methodological heterogeneity. Overall, the evidence supports a possible association between physical inactivity and obesity among Nigerian adults, but the magnitude of this association remains uncertain and warrants confirmation through studies using standardized exposure and outcome measures and consistent adjustment for relevant confounders.
Physical inactivity and cardiovascular disease (CVD) risk
A particularly important finding of this review was the strong association between physical inactivity and elevated CVD risk. The random-effects pooled estimate indicated that physically inactive participants had approximately 2.9 times the odds of increased CVD risk compared with physically active participants. This association was statistically significant, while between-study heterogeneity was low (I² = 24%).
Higher levels of leisure-time physical activity were linked to a decreased risk of incident cardiovascular disease in both men and women, according to a global meta-analysis of 21 prospective cohort studies encompassing over 650,000 persons [37]. Additionally, it was projected that physical inactivity was responsible for 7.6% of cardiovascular disease fatalities worldwide [3].
Nigerian evidence also supports this relationship. Physical inactivity was significantly associated with increased 10-year CVD risk in one study [22], while another study among adults with type 2 diabetes reported inadequate physical activity in 56% of participants and multiple co-existing CVD risk factors in a substantial proportion [10]. Regular physical activity may reduce cardiovascular risk through favourable effects on blood pressure, insulin sensitivity, and vascular function [38,39].
However, since only two studies were included in the meta-analysis and they used different methods for assessing CVD risk, the pooled estimate should be viewed with caution. The pooled OR therefore reflects the general association between physical inactivity and elevated cardiovascular risk rather than a precise estimate for a single uniformly defined CVD outcome.
Physical inactivity and hypertension
Hypertension could not be meta-analysed because sufficiently comparable effect estimates were unavailable among the included studies. However, a nationwide survey comprising 3,782 Nigerian adults reported an association between low physical activity and hypertension (OR = 1.23; 95% CI: 1.05–1.42) [40]. This conclusion is in line with international evidence. An inverse dose-response association between physical activity and incident hypertension was discovered in a comprehensive study comprising 594,129 people, which also showed the positive benefits of physical exercise on blood pressure [39]. Moderate-intensity recreational physical exercise has also been shown to lower systolic and diastolic blood pressure in persons with hypertension, according to more recent meta-analytic data [41].
The inability to pool hypertension in the present review reflects the limited availability of comparable effect estimates rather than evidence of no association. This highlights the need for Nigerian studies to report standardized physical activity measures and adjusted effect estimates with corresponding 95% confidence intervals to facilitate future quantitative synthesis.
Physical inactivity and diabetes mellitus
The available Nigerian evidence suggested a possible association between physical inactivity and diabetes, although quantitative evidence was limited. One included study reported higher odds of physical inactivity among participants with diabetes (OR = 1.91; 95% CI: 0.65–5.63) [5]. The confidence interval was wide and included the null value, so the estimate was imprecise and did not demonstrate a statistically significant association. However, the relationship aligns strongly with international evidence. High vs low total physical activity was linked to a 35% decreased incidence of type 2 diabetes (RR = 0.65; 95% CI: 0.59–0.71), according to a comprehensive review and meta-analysis of 81 studies [42]. Similarly, reaching around 150 minutes of moderate physical activity per week was linked to a 26% decreased risk of type 2 diabetes compared with physical inactivity, according to a meta-analysis of 28 prospective studies including over 1.2 million individuals [43]. The limited Nigerian evidence therefore highlights the need for more studies reporting comparable effect estimates specifically examining physical inactivity as an exposure and diabetes as an outcome.
Variation in physical inactivity across studies
A notable finding of this review was the wide variation in reported physical inactivity across study populations. This finding is consistent with previous evidence from Nigeria, where a systematic review and meta-analysis reported significant differences in physical inactivity, including a higher pooled prevalence among women than men and significantly higher prevalence in urban than rural populations [4]. Such differences may reflect variation in occupational activity, transportation patterns, socioeconomic characteristics, and opportunities for recreational physical activity.
Rural populations also warrant consideration when interpreting the Nigerian evidence. Although previous national evidence has reported higher physical inactivity in urban than rural populations [4], the present review included rural studies demonstrating substantial levels of physical inactivity and NCD burden. In the directly comparative Abuja study, physical inactivity was higher among rural than urban participants, whereas elevated blood pressure and obesity were more prevalent in the urban group. These contrasting findings suggest that the relationship between physical inactivity and NCD outcomes may be influenced by differences in occupation, transportation, socioeconomic conditions, healthcare access, and opportunities for physical activity across settings. However, because relatively few studies directly compared rural and urban populations, these findings should not be interpreted as evidence of a consistent national pattern.
The differences observed across studies may also partly reflect methodological variation. Physical activity was assessed using exercise-frequency questions, WHO STEPS-based instruments, the International Physical Activity Questionnaire (IPAQ), the Global Physical Activity Questionnaire (GPAQ), and other study-specific measures. Differences in measurement instruments, definitions, and classification thresholds can affect estimates of physical inactivity and limit direct comparability across studies. Previous systematic-review evidence has similarly demonstrated substantial variability in physical activity estimates according to the measurement method used [44].
Given the substantial diversity in study populations, settings, measurement approaches, and definitions of physical inactivity, an overall pooled prevalence was not calculated. Instead, prevalence findings were synthesized descriptively to avoid presenting a single summary estimate that could obscure important methodological and population differences.
Risk of Bias and Methodological Considerations
Of the 27 included studies, 8 (29.6%) had a low risk of bias, whereas 19 (70.4%) raised some concerns. None was judged to have a high risk of bias. Problems with physical-activity assessment and inadequate or unclear adjustment for confounders were the most common concerns.
Reliance on self-reported physical activity was an important methodological concern because participants may inaccurately recall or report the frequency, duration, and intensity of their activities. Research comparing self-reported and directly measured physical activity has documented differences between these assessment approaches [44]. The observed associations between physical inactivity and NCD outcomes may also be affected by inadequate adjustment for confounders such as age, sex, socioeconomic factors, smoking, and obesity.
Because exposure and outcomes are assessed at approximately the same time in cross-sectional studies, temporal relationships cannot be established, limiting causal interpretation [45]. Reverse causation is possible: people with obesity, hypertension, diabetes, or cardiovascular disease may reduce their physical activity because of their existing health conditions. The findings should therefore be interpreted as evidence of association, not causation.
An important limitation of the evidence base is that all 27 included studies used a cross-sectional design. Because physical inactivity and NCD outcomes were assessed at approximately the same time, temporal sequence could not be established, thereby limiting causal interpretation [45]. Reverse causality is therefore a plausible explanation for some of the observed associations. For example, individuals living with obesity, hypertension, diabetes mellitus, cardiovascular disease, or related symptoms may reduce their physical activity because of their existing condition, physical limitations, or mobility constraints. Conversely, lower physical activity may contribute to the development or worsening of these conditions. The cross-sectional design of the included studies does not allow these possibilities to be distinguished. Therefore, the associations identified in this review should not be interpreted as evidence that physical inactivity causes NCDs, but rather as evidence of an observed association. Prospective cohort studies and other longitudinal designs are needed to establish temporality and better determine the direction and magnitude of these relationships.
Physical inactivity was associated with higher odds of obesity and elevated cardiovascular disease risk among Nigerian adults, while evidence for hypertension and diabetes mellitus was limited and could only be synthesized narratively. However, all 27 included studies were cross-sectional, precluding assessment of temporality and leaving the possibility of reverse causality. The pooled estimates for obesity and CVD risk were based on only 2 studies each, and the obesity meta-analysis combined adjusted and unadjusted effect estimates. Therefore, the findings should be interpreted as evidence of association rather than causation, and the pooled estimates should be considered exploratory. Differences in study populations, measurement methods, outcome definitions, and statistical adjustment further limit the certainty and generalizability of the findings. Public health strategies should continue to promote physical activity as an important component of NCD prevention, while further Nigerian research using standardized measurement methods, consistent reporting of adjusted effect estimates, and prospective longitudinal designs is needed to clarify temporality and strengthen causal inference.
What is already known about the topic
What this study adds
Conceptualization: Chinenye Mercy Tochukwu.
Data Curation: Chinenye Mercy Tochukwu.
Methodology: Chinenye Mercy Tochukwu, Timothy Winner Abosede, and Rahmat Tijani.
Validation: Chinenye Mercy Tochukwu.
Investigation: Ibrahim Attah Tijani and Rahmat Tijani.
Supervision: Polycarp Dauda Madaki.
Writing – Original Draft: Chinenye Mercy Tochukwu.
Writing – Review & Editing: Chinenye Mercy Tochukwu, Aminah Opeyemi Tiamiyu, and Ibrahim Attah Tijani.
| Author (Year) | Location | Study Design | Population | Sample Size (N) | Physical Activity Tool | NCD Outcome | Main Finding |
|---|---|---|---|---|---|---|---|
| Oguoma et al. (2016) [5] | – | Cross-sectional | Apparently healthy adults (≥ 18 years) | 422 | WHO Global Physical Activity Questionnaire (GPAQ) | Metabolic syndrome, prediabetes, diabetes | Prediabetes (OR = 1.69) and diabetes (OR = 1.91) were associated with physical inactivity; no significant association was found with metabolic syndrome. |
| Idris et al. (2024) [6] | Kaduna (Northwest) | Cross-sectional | Female traders aged ≥ 18 years | 79 | Self-reported activity based on WHO adult physical activity recommendations | Obesity based on BMI ≥ 30 kg/m² | Inactive women had higher, but non-significant, odds of obesity (OR = 1.90; p = 0.206). |
| Ogunyemi et al. (2023) [7] | Osun (Southwest) | Cross-sectional | University staff | 500 | IPAQ-SF | Cardiovascular disease (CVD) risk | Physical inactivity (37.6%) and CVD risk (61.0%) were common. Older age, female sex, work-related stress, and obesity were significantly associated with higher CVD risk. |
| Anthony et al. (2019) [8] | FCT (North-Central) | Descriptive cross-sectional | Adults from rural communities | 420 | Interviewer-administered questionnaire | Hypertension | Hypertension prevalence was 38.3%, and physical inactivity was associated with hypertension. |
| Olufayo et al. (2023) [9] | Ibadan (Southwest) | Cross-sectional | First-year university students | 546 | Interviewer-administered questionnaire | CVD risk factors | Physical inactivity prevalence was 94.5%; clustering of ≥2 CVD risk factors occurred in 23.4% |
| Odukoya et al. (2024) [10] | Lagos (Southwest) | Cross-sectional | Adults with diabetes | 357 | Interviewer-administered questionnaire | Diabetes/CVD risk factors | Inadequate physical activity was 56%; 40.3% had ≥3 coexisting CVD risk factors |
| Adetayo et al. (2026) [11] | Abuja (North-Central) | Comparative cross-sectional | Adults from rural and urban communities | 1,868 | WHO STEPS-based questionnaire | Elevated BP, diabetes, overweight/obesity | Physical inactivity was 76.9% in rural and 70.4% in urban participants. Elevated BP was 37.2% vs 44.3%, diabetes was 5.4% vs 3.2% and obesity was 5.7% vs 8.0% respectively |
| Olawuyi & Adeoye (2018) [12] | Ibadan (Southwest) | Cross-sectional | Civil Servants | 606 | WHO STEPwise approach | Obesity, raised BP, raised blood sugar | Low PA prevalence was 62.2%; obesity 57.3%, raised BP 33.1%, and raised blood sugar 7.1%. |
| Effiwatt et al. (2026) [13] | Calabar (South-South) | Cross-sectional | Commercial Drivers | 380 | Adapted WHO STEPS | Hypertension; predicted 10-year CVD Risk | Hypertension prevalence was ~40%; older age, high BMI, longer driving duration, and elevated fasting glucose were associated with hypertension |
| Dele-Ojo et al. (2021) [14] | Ado-Ekiti (Southwest) | Cross-sectional | University staff | 223 | – | Hypertension, diabetes, obesity | Physical inactivity was 83%; hypertension 35.4%, diabetes 12.1%, and obesity 23.3%. |
| Buremoh et al. (2020) [15] | Ibadan (Southwest) | Cross-sectional | Nurses | 196 | Structured questionnaire; exercise frequency | Overweight/obesity | 32% exercised moderately <once/week ; obesity was associated with frequent fried food intake and family history of CVD |
| Oladoyinbo et al. (2019) [16] | Abeokuta (Southwest) | Descriptive cross-sectional | Traders | 350 | Validated semi-structured questionnaire | Overweight/obesity | 41.4% had low PA; overweight 24.0%, obesity 3.7%. No significant association between PA and BMI. |
| Olaitan & Oladejana (2026) [17] | Ondo West (Southwest) | Cross-sectional | Commercial drivers | 300 | Interviewer-administered questionnaire; brisk walking assessed | Elevated blood pressure (EBP) | Elevated blood pressure prevalence was 29.3%; brisk walking was associated with elevated blood pressure (AOR = 1.96; 95% CI: 1.09–3.51; p = 0.023). |
| Chigbu et al. (2020) [18] | Enugu (South-South) | Cross-sectional | Adults | 6,628 | Structured interviewer-administered questionnaire | Obesity/overweight | Physical inactivity was associated with higher odds of obesity (AOR = 1.43; 95% CI: 1.19–1.71) and overweight (AOR 1.23; 95% CI: 1.09–1.39) |
| Adeniyi et al. (2016) [19] | Ibadan (Southwest) | Cross-sectional | Patients with type 2 diabetes and their adult children. | 315 | International Physical Activity Questionnaire (IPAQ) | Type 2 diabetes | Physical inactivity was higher among diabetic parents (50.3%) than their adult children (28.5%) |
| Ogwumike et al. (2016) [20] | – | Cross-sectional survey | Postmenopausal Women | 310 | IPAQ | Overall obesity and abdominal obesity | Obesity was significantly associated with lower physical activity; PA was associated with overall obesity but not abdominal obesity. |
| Adeniyi et al. (2010) [21] | Ibadan and Kano (Southwest and Northwest) | Cross-sectional comparative | T2D patients and matched non-diabetic adults | 496 | IPAQ | T2D | T2D patients were less sedentary (27.4%) than nondiabetic participants (37.5%); PA levels differed significantly (p < 0.001). |
| Oseni et al. (2024) [22] | Edo (South-South) | Descriptive cross-sectional | Adults with hypertension and/or diabetes | 394 | Semi-structured questionnaire | 10-year cardiovascular disease risk (Framingham Risk Score) | Physical inactivity was significantly associated with high 10-year CVD risk (OR = 2.45; 95% CI 1.53–3.92). |
| Idowu et al. (2013) [23] | Ekiti (Southwest) | Cross-sectional | Patients with hypertension | 212 | IPAQ | Hypertension | Physical inactivity prevalence was 56.1% among patients with hypertension. |
| Onwuakagba et al. (2023) [24] | Anambra (South-East) | Cross-sectional community survey | Adults with previous stroke | 310 | – | Stroke risk using Modified Framingham Stroke Risk Score (MFSRS) | Physical inactivity prevalence was 43.2%; 16% had moderate to high predicted stroke risk |
| Maduka & Ojimah (2020) [25] | Rivers (South-South) | Descriptive cross-sectional | Judiciary staff | 226 | Adapted WHO STEPS instrument | CVD risk | Physical inactivity prevalence was 39.8% and was associated with predicted moderate CVD risk (OR = 4.17; 95% CI: 1.92–9.10). |
| Showande & Odukoya (2020) [26] | Ibadan (Southwest) | Cross-sectional | Motor vehicle drivers | 152 | IPAQ-Short Form | Hypertension, diabetes, obesity | Physical inactivity prevalence was 52.6%; inactivity differed significantly across CVD risk-factor clusters (p = 0.020). |
| Oladimeji et al. (2014) [27] | Kaduna (Northwest) | Cross-sectional | Civil servants | 801 | WHO STEPS/CDC BRFSS based structured questionnaire | Hypertension, obesity | Physical inactivity was 91%; overweight/obesity was more prevalent among inactive participants, while no significant association with hypertension was found. |
| Adeyanju et al. (2023) [28] | Rivers (South-South) | Cross-sectional analytical study | Staff of two multinational companies | 296 | Semi-structured questionnaire | Obesity | Physical inactivity was 58.1%; regular exercise was associated with lower odds of obesity. |
| Amadi et al. (2018) [29] | Lagos (Southwest) | Cross-sectional | Drivers | 293 | – | Hypertension, diabetes, obesity and CVD risk factors | Physical inactivity prevalence was 50.9%; hypertension, diabetes, and obesity prevalences were 39.7%, 13.9%, and 21.1%, respectively. |
| Ogunmola et al. (2013) [30] | Ekiti (Southwest) | Descriptive cross-sectional | Community-dwelling adults aged ≥40 years | 104 | Modified Health Insurance Plan (HIP) physical activity measure | Hypertension, diabetes mellitus, and obesity | Physical inactivity prevalence was 29.8%. Hypertension, diabetes and obesity prevalence were 66.4%, 4.8% and 14.4%, respectively. |
| Odugbemi et al. (2012) [31] | Lagos (Southwest) | Descriptive cross-sectional | Adult traders | 400 | Structured questionnaire | Hypertension, diabetes mellitus, and obesity | Physical inactivity prevalence was 92%; hypertension, diabetes mellitus, and obesity prevalence were 34.8%, 0.8%, and 12.3%, respectively. |
Note. AOR = adjusted odds ratio; BMI = body mass index; BP = blood pressure; BRFSS = Behavioral Risk Factor Surveillance System; CI = confidence interval; CVD = cardiovascular disease; EBP = elevated blood pressure; GPAQ = Global Physical Activity Questionnaire; HIP = Health Insurance Plan; IPAQ = International Physical Activity Questionnaire; IPAQ-SF = International Physical Activity Questionnaire–Short Form; MFSRS = Modified Framingham Stroke Risk Score; NCD = non-communicable disease; OR = odds ratio; PA = physical activity; T2D = type 2 diabetes; WHO STEPS = WHO STEPwise approach to noncommunicable disease risk-factor surveillance.
| Study | NCD outcome | Exposure/comparator | Effect measure | Effect estimate (95% CI) | p-value | Finding |
|---|---|---|---|---|---|---|
| Chigbu et al. (2020) [18] | Obesity | Physically inactive vs physically active | AOR | 1.43 (1.19–1.71) | <0.001 | Physical inactivity was significantly associated with higher odds of obesity. |
| Idris et al. (2024) [6] | Obesity | Physically inactive vs physically active | OR | 1.90 (0.70–5.20) | 0.206 | Physical inactivity was associated with higher odds of obesity, although the association was not statistically significant. |
| Oseni et al. (2024) [22] | High 10-year CVD risk | Physically inactive vs physically active | OR | 2.45 (1.53–3.92) | <0.01 | Physically inactive participants had significantly higher odds of elevated CVD risk. |
| Maduka & Ojimah (2020) [25] | Moderate CVD risk | Physically inactive vs physically active | OR | 4.17 (1.92–9.10) | <0.001 | Physical inactivity was significantly associated with higher odds of moderate CVD risk. |
| Adeyanju et al. (2023) [28] | Overweight/obesity | None/rare exercise vs sometimes/always | AOR | 0.70 (0.43–1.12) | 0.315 | Regular exercise was associated with lower adjusted odds of elevated BMI, but the association was not statistically significant. |
| Oguoma et al. (2016) [5] | Diabetes mellitus | Physically inactive vs physically active | OR | 1.91 (0.65–5.63) | >0.05 | Physical inactivity was associated with higher odds of diabetes, but the association was not statistically significant. |
| Multiple included studies | Hypertension | – | – | – | – | Physical inactivity was reported among hypertensive populations, but sufficiently comparable effect estimates for the physical inactivity–hypertension association were unavailable. |
Note. AOR = adjusted odds ratio; CI = confidence interval; CVD = cardiovascular disease; OR = odds ratio.
| NCD outcome | Studies pooled | Pooled OR (95% CI) | I² | Q | Heterogeneity p-value |
|---|---|---|---|---|---|
| Obesity | 2 | 1.44 (1.20–1.72) | 0% | 0.31 | 0.581 |
| CVD risk | 2 | 2.91 (1.79–4.74) | 24% | 1.31 | 0.252 |
| Hypertension | Narrative synthesis only | – | – | – | – |
| Diabetes mellitus | Narrative synthesis only | OR = 1.91 (0.65–5.63) | – | – | – |
Note. CI = confidence interval; CVD = cardiovascular disease; I² = I-squared statistic; OR = odds ratio; Q = Cochran’s Q statistic. Each pooled estimate is based on 2 studies; hypertension and diabetes mellitus were synthesised narratively.
| Study | Q1 | Q2 | Q3 | Q4 | Q5 | Q6 | Q7 | Overall judgement |
|---|---|---|---|---|---|---|---|---|
| Chigbu et al. (2020) [18] | Y | Y | Y | Y | Y | Y | Y | Low risk |
| Idris et al. (2024) [6] | Y | Y | U | Y | Y | N | Y | Some concerns |
| Oseni et al. (2024) [22] | Y | Y | Y | Y | Y | Y | Y | Low risk |
| Maduka & Ojimah (2020) [25] | Y | Y | Y | U | Y | Y | Y | Some concerns |
| Adeyanju et al. (2023) [28] | Y | Y | U | Y | Y | Y | Y | Some concerns |
| Oguoma et al. (2016) [5] | Y | Y | Y | Y | Y | U | Y | Some concerns |
| Anthony et al. (2019) [8] | Y | Y | U | Y | Y | Y | Y | Some concerns |
| Ogunyemi et al. (2023) [7] | Y | Y | Y | Y | Y | Y | Y | Low risk |
| Olufayo et al. (2023) [9] | Y | Y | U | Y | U | U | Y | Some concerns |
| Odukoya et al. (2024) [10] | Y | Y | Y | Y | Y | Y | Y | Low risk |
| Adetayo et al. (2026) [11] | Y | Y | Y | U | Y | Y | Y | Some concerns |
| Olawuyi & Adeoye (2018) [12] | Y | Y | Y | Y | Y | Y | Y | Low risk |
| Effiwatt et al. (2026) [13] | Y | Y | Y | U | Y | Y | Y | Some concerns |
| Dele-Ojo et al. (2021) [14] | Y | U | U | U | U | U | Y | Some concerns |
| Buremoh et al. (2020) [15] | Y | Y | U | Y | Y | U | Y | Some concerns |
| Oladoyinbo et al. (2019) [16] | Y | Y | U | Y | U | U | Y | Some concerns |
| Olaitan & Oladejana (2026) [17] | Y | Y | U | Y | Y | Y | Y | Some concerns |
| Ogwumike et al. (2016) [20] | Y | Y | Y | Y | Y | Y | Y | Low risk |
| Adeniyi et al. (2010) [21] | Y | Y | Y | Y | U | U | Y | Some concerns |
| Adeniyi et al. (2016) [19] | Y | Y | Y | Y | U | U | Y | Some concerns |
| Idowu et al. (2013) [23] | Y | Y | Y | Y | U | N | Y | Some concerns |
| Onwuakagba et al. (2023) [24] | Y | Y | U | Y | Y | U | Y | Some concerns |
| Showande & Odukoya (2020) [26] | Y | Y | Y | Y | Y | U | Y | Some concerns |
| Oladimeji et al. (2014) [27] | Y | Y | Y | Y | Y | Y | Y | Low risk |
| Amadi et al. (2018) [29] | Y | Y | U | Y | Y | Y | Y | Some concerns |
| Ogunmola et al. (2013) [30] | Y | Y | Y | Y | Y | Y | Y | Low risk |
| Odugbemi et al. (2012) [31] | Y | Y | U | Y | U | U | Y | Some concerns |
Note. Q1–Q7 = appraisal questions 1–7; Y = yes; N = no; U = unclear.