
Research | Open Access | Volume 9 (4): Article 182 | Published: 09 Nov 2026

Views: 54
Menu, Tables and Figures
| Period | Dog bites | Snakebites | ||||||
|---|---|---|---|---|---|---|---|---|
| Notified cases | Rate per 100,000 per year (95% CI) | Deaths | CFR, % (95% CI) | Notified cases | Rate per 100,000 per year (95% CI) | Deaths | CFR, % (95% CI) | |
| Complete years | ||||||||
| 2021 | 1,037 | 13.7 (12.9 to 14.6) | 3 | 0.29 (0.06 to 0.84) | 494 | 6.5 (6.0 to 7.1) | 26 | 5.26 (3.47 to 7.62) |
| 2022 | 993 | 13.2 (12.3 to 14.0) | 3 | 0.30 (0.06 to 0.88) | 614 | 8.1 (7.5 to 8.8) | 30 | 4.89 (3.32 to 6.90) |
| 2023 | 1,035 | 13.7 (12.9 to 14.6) | 4 | 0.39 (0.11 to 0.99) | 836 | 11.1 (10.3 to 11.9) | 31 | 3.71 (2.53 to 5.22) |
| 2024 | 1,132 | 15.0 (14.1 to 15.9) | 9 | 0.80 (0.36 to 1.50) | 691 | 9.2 (8.5 to 9.9) | 27 | 3.91 (2.59 to 5.63) |
| 2025 | 1,509 | 20.0 (19.0 to 21.0) | 3 | 0.20 (0.04 to 0.58) | 650 | 8.6 (8.0 to 9.3) | 10 | 1.54 (0.74 to 2.81) |
| 2021 to 2025 | 5,706 | 15.1 (14.7 to 15.5) | 22 | 0.39 (0.24 to 0.58) | 3,285 | 8.7 (8.4 to 9.0) | 124 | 3.77 (3.15 to 4.48) |
| Partial year (five months) | ||||||||
| 1 January to 1 June 2026 | 717 | NC | 6 | 0.84 (0.31 to 1.81) | 221 | NC | 3 | 1.36 (0.28 to 3.92) |
CFR, notified case fatality ratio: deaths recorded among notified cases divided by notified cases. CI, confidence interval, exact Poisson for rates and exact binomial for CFRs. NC, not calculated for a partial year. Rates are notified cases per 100,000 population per year, with the 2021 census population of 7,548,702 as the denominator. Deaths are those recorded by health facilities among notified cases. The weekly form records no cause of death and no laboratory confirmation of rabies.
Table 1: Notified dog-bite and snakebite cases, notification rates, recorded deaths and notified case fatality ratios by year, Sierra Leone, 1 January 2021 to 1 June 2026
| District | Population, 2021 census | Dog bites | Snakebites | ||||||
|---|---|---|---|---|---|---|---|---|---|
| Notified cases | Rate per 100,000 per year (95% CI) | Deaths | CFR, % (95% CI) | Notified cases | Rate per 100,000 per year (95% CI) | Deaths | CFR, % (95% CI) | ||
| Bo | 756,975 | 159 | 4.2 (3.6 to 4.9) | 1 | 0.63 (0.02 to 3.45) | 82 | 2.2 (1.7 to 2.7) | 4 | 4.88 (1.34 to 12.02) |
| Bombali | 387,236 | 1,086 | 56.1 (52.8 to 59.5) | 1 | 0.09 (0.00 to 0.51) | 672 | 34.7 (32.1 to 37.4) | 14 | 2.08 (1.14 to 3.47) |
| Bonthe | 297,561 | 108 | 7.3 (6.0 to 8.8) | 1 | 0.93 (0.02 to 5.05) | 46 | 3.1 (2.3 to 4.1) | 1 | 2.17 (0.06 to 11.53) |
| Falaba | 166,205 | 117 | 14.1 (11.6 to 16.9) | 0 | 0.00 (0.00 to 3.10) | 132 | 15.9 (13.3 to 18.8) | 4 | 3.03 (0.83 to 7.58) |
| Kailahun | 550,435 | 357 | 13.0 (11.7 to 14.4) | 1 | 0.28 (0.01 to 1.55) | 312 | 11.3 (10.1 to 12.7) | 9 | 2.88 (1.33 to 5.41) |
| Kambia | 367,699 | 157 | 8.5 (7.3 to 10.0) | 0 | 0.00 (0.00 to 2.32) | 171 | 9.3 (8.0 to 10.8) | 10 | 5.85 (2.84 to 10.49) |
| Karene | 290,313 | 89 | 6.1 (4.9 to 7.5) | 2 | 2.25 (0.27 to 7.88) | 224 | 15.4 (13.5 to 17.6) | 16 | 7.14 (4.14 to 11.34) |
| Kenema | 772,472 | 275 | 7.1 (6.3 to 8.0) | 2 | 0.73 (0.09 to 2.60) | 204 | 5.3 (4.6 to 6.1) | 11 | 5.39 (2.72 to 9.44) |
| Koinadugu | 206,133 | 114 | 11.1 (9.1 to 13.3) | 0 | 0.00 (0.00 to 3.18) | 261 | 25.3 (22.3 to 28.6) | 2 | 0.77 (0.09 to 2.74) |
| Kono | 620,703 | 1,427 | 46.0 (43.6 to 48.4) | 1 | 0.07 (0.00 to 0.39) | 163 | 5.3 (4.5 to 6.1) | 1 | 0.61 (0.02 to 3.37) |
| Moyamba | 346,771 | 358 | 20.6 (18.6 to 22.9) | 2 | 0.56 (0.07 to 2.00) | 191 | 11.0 (9.5 to 12.7) | 6 | 3.14 (1.16 to 6.71) |
| Port Loko | 528,038 | 275 | 10.4 (9.2 to 11.7) | 2 | 0.73 (0.09 to 2.60) | 316 | 12.0 (10.7 to 13.4) | 26 | 8.23 (5.45 to 11.82) |
| Pujehun | 429,574 | 287 | 13.4 (11.9 to 15.0) | 1 | 0.35 (0.01 to 1.93) | 179 | 8.3 (7.2 to 9.6) | 7 | 3.91 (1.59 to 7.89) |
| Tonkolili | 557,257 | 212 | 7.6 (6.6 to 8.7) | 1 | 0.47 (0.01 to 2.60) | 227 | 8.1 (7.1 to 9.3) | 11 | 4.85 (2.44 to 8.50) |
| Western Area Rural | 662,156 | 530 | 16.0 (14.7 to 17.4) | 2 | 0.38 (0.05 to 1.36) | 91 | 2.7 (2.2 to 3.4) | 2 | 2.20 (0.27 to 7.71) |
| Western Area Urban | 609,174 | 155 | 5.1 (4.3 to 6.0) | 5 | 3.23 (1.06 to 7.37) | 14 | 0.5 (0.3 to 0.8) | 0 | 0.00 (0.00 to 23.16) |
| Sierra Leone | 7,548,702 | 5,706 | 15.1 (14.7 to 15.5) | 22 | 0.39 (0.24 to 0.58) | 3,285 | 8.7 (8.4 to 9.0) | 124 | 3.77 (3.15 to 4.48) |
CFR, notified case fatality ratio: deaths recorded among notified cases divided by notified cases. CI, confidence interval, exact Poisson for rates and exact binomial for CFRs. Rates are mean annual notified cases per 100,000 population per year, with the 2021 census population as the denominator.
Table 2: Notified dog-bite and snakebite cases, mean annual notification rates, recorded deaths and notified case fatality ratios by district, Sierra Leone, 2021 to 2025
Eric Nzirakaindi Ikoona1, Lucy Namulemo2, Bridget Magoba1, Mary Magdalene Sinnah1, Mohamed Alex Vandi1, Foday Sahr1
1 National Public Health Agency, Freetown, Sierra Leone, 2 School of Professional Counseling, Lindsey Wilson University, Columbia, Kentucky, United States of America
&Corresponding author: Eric Nzirakaindi Ikoona, National Public Health Agency, Freetown, Sierra Leone. Email: ikoonae@yahoo.com ORCID: https://orcid.org/0000-0003-3402-1961
Received: 20 Jun 2026, Accepted: 30 Oct 2026, Published: 09 Nov 2026
Domain: Injury Epidemiology
Keywords: dog bites, snake bites, rabies, public health surveillance, One Health
©Eric Nzirakaindi Ikoona et al. Journal of Interventional Epidemiology and Public Health (ISSN: 2664-2824). This is an Open Access article distributed under the terms of the Creative Commons Attribution International 4.0 License (https://creativecommons.org/licenses/by/4.0/), which permits unrestricted use, distribution, and reproduction in any medium, provided the original work is properly cited.
Cite this article: Eric Nzirakaindi Ikoona et al. Dog bites and snakebites notified in Sierra Leone, 1 January 2021 to 1 June 2026: A national descriptive surveillance study. Journal of Interventional Epidemiology and Public Health. 2026; 9(4):182. https://doi.org/10.37432/jieph-d-26-00188
Introduction: Sierra Leone’s surveillance counts dog bites and snakebites, the exposures that precede rabies and envenoming. We measured how often dog bites and snakebites were notified, and how often notified cases died, by year, district and age group.
Methods: This descriptive study used aggregate Integrated Disease Surveillance and Response notifications from all 16 districts. We calculated annual notification rates per 100,000 population for 2021 to 2025 with 2021 census denominators, notified case fatality ratios (CFRs) and 95% confidence intervals in Python. Notifications from 1 January to 1 June 2026 are reported separately.
Results: From 2021 to 2025, facilities notified 5,706 dog bites with 22 deaths (CFR: 0.39%) and 3,285 snakebites with 124 deaths (CFR: 3.77%). Snakebites accounted for 124 (84.9%) of 146 deaths. Mean annual rates per 100,000 were 15.1 and 8.7 for dog bites and snakebites respectively. The dog-bite rate rose from 13.7 per 100,000 population in 2021 to 20.0 per 100,000 population in 2025, as Kono’s notifications grew from 142 to 620. Bombali (56.1) and Kono (46.0) had the highest dog-bite rates, and Bombali (34.7) and Koinadugu (25.3) the highest snakebite rates. Snakebite CFRs were highest in Port Loko (8.23%, 26/316) and Karene (7.14%, 16/224). Children aged 5 to 14 years accounted for 942 (34.5%) of 2,730 case-based dog bites.
Conclusion: Dog-bite notifications were more frequent, and snakebite notifications more often fatal. These counts give Sierra Leone a district baseline. The National Public Health Agency should begin with snakebite death audits and antivenom stock checks in Port Loko and Karene, and rabies vaccine stock checks in Kono and Bombali.
Dog bites and snakebites happen where people, animals and their shared environment meet. People meet dogs in compounds, in markets and on the paths children walk to school. They meet snakes in the fields, fallows and grain stores where rural households farm, herd and sleep [1,2]. The hazard lies in that contact. Prevention acts on it by vaccinating dogs, managing dog populations, protecting feet and treating bites early [3,4]. Both problems call for a One Health response [5].
Dog bites cause almost all human rabies. Rabies kills an estimated 59,000 people a year, and nearly every person who develops symptoms dies [6,7]. Prompt wound washing and post-exposure prophylaxis prevent the disease, and mass dog vaccination removes its source [7,8]. Snakebite envenoming is a neglected tropical disease that kills more than 100,000 people a year, mostly in rural farming populations [1,9,10]. Climate projections to 2070 place the largest gains in vulnerability to snakebite in low-income countries of Africa and Southeast Asia [11].
National surveillance in Sierra Leone counts the bite. The bite is the exposure that precedes both diseases, and it marks the moment when the health system can still prevent death. Rabies appears weeks to months after the bite, is seldom confirmed in a laboratory, and often kills at home. In Tanzania, official records averaged 11 rabies deaths a year, while bite-injury data predicted 1,499 [12]. Health workers count a snakebite when the patient arrives, before envenoming has declared itself. Notified bites are the risk factor that the surveillance system measures in every district every week. They serve as the available proxy for the burden of rabies exposure and snakebite envenoming.
Bite data have guided effective programs elsewhere in Africa. Mass dog vaccination in rural Tanzania reduced both dog rabies and human dog-bite injuries [13]. In rural Ghana, a treatment protocol with outcome monitoring lowered snakebite case fatality from 8 (11%) of 72 patients to 3 (1.3%) of 238 [14]. Antivenom is cost-effective in all 16 West African countries modelled [15].
Published evidence from Sierra Leone is sparse. Ministry of Health records list 1,301 to 1,544 dog and cat bites a year between 2018 and 2020 [16]. Among 2,558 dog-owning households, 14% kept fully vaccinated dogs, and 782 (31%) respondents would seek traditional care after a bite [17,18]. A community study found 66 snakebite victims in 14 villages of Moyamba District, and a Makeni case report described neurotoxic envenoming managed without antivenom [19,20]. We identified no analysis of either event against district populations.
Sierra Leone notifies both events through one system. In January 2021, the third-edition Integrated Disease Surveillance and Response (IDSR) tools added snakebite to the weekly form that already carried dog bite [21]. The same facility staff count both events on the same form, so a joint analysis compares them under one reporting process. The Neglected Tropical Diseases Master Plan 2023 to 2027 sets targets of zero rabies deaths and a 20% reduction in snakebite mortality. It plans a baseline study of snakebite and assigns monitoring to IDSR and the One Health platform [22].
We measured how often dog bites and snakebites were notified, and how often notified cases died, by year, district and age group in Sierra Leone between 1 January 2021 and 1 June 2026. We estimated annual and district notification rates per 100,000 population, described deaths and notified case fatality ratios (CFRs), and compared age groups. The study covers bites that reached a reporting health facility. It provides the national and district baseline that the Master Plan calls for, for use by the National Public Health Agency (NPHA) and district health management teams.
Study design and setting
We conducted a descriptive, population-wide study of routinely collected aggregate surveillance data. Reporting follows the Strengthening the Reporting of Observational Studies in Epidemiology (STROBE) statement and its extension for routinely collected health data (RECORD), with the checklist in Additional file 1 [23,24]. Sierra Leone had 7,548,702 residents at the 2021 Mid-Term Population and Housing Census [25]. Canine rabies is endemic, and dog vaccination coverage is low [16,17]. Health facilities in every district report to one electronic surveillance platform, which reached national coverage in 2019 [26]. The 16 districts are the level at which surveillance officers work, health commodities are allocated, and census populations are published, so we analysed the data by district.
Surveillance system and case definitions
NPHA leads national surveillance under the World Health Organization IDSR strategy for the African Region [27]. At each of more than 1,500 reporting facilities, a focal person tallies priority events from the registers each epidemiological week and submits the totals by noon on Monday. Entry is electronic, on a District Health Information Software 2 (DHIS2) platform [28]. A facility that saw no cases of an event enters zero [27]. District surveillance officers approve each report, and validation rules flag inconsistent entries [28]. Reporting completeness was 96% in a 2021 assessment of 156 facilities and above 98% nationally in 2023 [21,28]. Facilities also notify individual cases through electronic case-based surveillance, which records the date seen and age in years [26].
A dog-bite case is any person who presents to a health facility after a bite by a dog. A snakebite case is any person who presents after a bite by a snake. Both definitions are clinical, rest on the history given, and require no identification of the animal, laboratory test or sign of rabies or envenoming [27]. A death is a death that a facility records in a person notified of the event. Human rabies is a separate, immediately notifiable disease. A suspected case has one or more of headache, neck pain, nausea, fever, fear of water, anxiety, agitation, or tingling or pain at the wound site, after suspected contact with a rabid animal [27].
Data source and preparation
The study used four exports from the national platform, and the study team prepared the analytical datasets. The main export, dated 1 June 2026, gave counts of cases and deaths for each event by district, calendar year and age band (under 5 years or 5 years and older). It covered every notification from 1 January 2021, with no exclusions. The second export gave the platform total for each event by district and year. The third gave national cases and deaths by month to May 2026 and by age band. The fourth held the case-based records of dog bite, snakebite and human rabies seen from 2021 to 2025. The weekly form has two animal-bite lines, one for dog bites and one for snakebites.
The platform stores one value for each facility, week and data element, so a weekly report cannot be entered twice. Every district had an entry for both events in every year from 2021 to 2025. Under mandatory zero reporting, we analyzed the remaining blank cells of the main export as zero. We recomputed every national total from the 16 district rows. One stored total differed from its rows: snakebite deaths in people aged 5 years and older in 2024, stored as 2 against a district sum of 27. We used the district sum, confirmed by the second export and approved by the NPHA director of applied epidemiology and surveillance.
Platform totals add death entries to case entries, and the 2024 snakebite total of 718 equals 691 cases plus 27 deaths. With deaths subtracted, platform totals equalled the main export in every year to 2024 and supplied the final case counts for 2025. The third export reproduced every yearly count and supplied the counts for 2026 and for the age bands.
Measures and population denominators
The notification rate was the number of notified cases divided by person-years, expressed per 100,000 population per year. The notified CFR was the number of recorded deaths divided by the number of notified cases, expressed as a percentage. Rates use the five complete calendar years, 2021 to 2025. District-year rates use the platform totals.
District populations came from the most recent census, conducted in 2021 [25]. Statistics Sierra Leone has published no projections, so we applied the 2021 population to each year. Sensitivity analyses grew every district population by 1.04% (intercensal) and 2.2% (United Nations) per year [29,30]. A third used the 2015 census populations of the same districts [29]. Age denominators apply the latest published age structure, the 2015 census shares of 13.2% under 5 years and 28.8% at 5 to 14 years [31].
Statistical analysis
We summarized cases and deaths by year, age band and district as counts and percentages. Exact Poisson 95% confidence intervals (CIs) accompany rates, and exact binomial 95% CIs accompany CFRs [32,33]. The analysis is descriptive and uses no hypothesis tests. We report the five months of 2026 separately and compare them with January to May of each earlier year. Analyses used Python 3.13 with pandas 3.0, NumPy 2.5 and SciPy 1.18. Additional file 2 contains the script and the counts.
Ethical considerations
The exports held aggregate counts and case-based surveillance records without names. NPHA, the custodian of national surveillance data, granted institutional clearance for the analysis and its publication. Individual consent was not required for secondary analysis of surveillance records, and only aggregated counts are reported. The study complied with the provisions of the Declaration of Helsinki on privacy and confidentiality of personal information [34].
Notifications and deaths
In the five complete years, 2021 to 2025, health facilities notified 8,991 bites and 146 deaths. Dog bites accounted for 5,706 (63.5%) notifications and 22 (15.1%) deaths. Snakebites accounted for 3,285 (36.5%) notifications and 124 (84.9%) deaths. The notified CFR was 0.39% (95% CI: 0.24 – 0.58) for dog bites and 3.77% (95%CI: 3.15 to 4.48) for snakebites. The mean annual notification rate per 100,000 population was 15.1 (95%CI: 14.7 – 15.5) for dog bites and 8.7 (95% CI: 8.4 – 9.0) for snakebites (Table 1).
Time
The annual dog-bite rate stayed between 13.2 and 13.7 per 100,000 population from 2021 to 2023. It rose to 15.0 in 2024 and 20.0 in 2025 (Table 1). Facilities notified 1,509 dog bites in 2025 and 1,037 in 2021, a rate ratio of 1.46 (95% CI: 1.34 – 1.57). The snakebite rate rose from 6.5 per 100,000 in 2021 to 11.1 in 2023 and stood at 8.6 in 2025.
District-year totals locate these changes (Additional file 1, Table S1 and Figure S1). Kono’s dog-bite total rose from 142 in 2021 to 620 in 2025, and its rate rose from 22.9 to 99.9 per 100,000. Bombali’s total rose from 142 to 286, while the other 14 districts combined fell from 756 to 606. For snakebite, Bombali’s total rose from 66 to 212. The other 15 districts combined rose from 454 in 2021 to 720 in 2023 and returned to 448 in 2025.
Recorded dog-bite deaths ranged from three to nine a year, and nine (40.9%) of the 22 fell in 2024. Recorded snakebite deaths numbered 26 to 31 a year from 2021 to 2024 and 10 in 2025. The snakebite CFR fell from 5.26% (26/494, 95% CI 3.47 to 7.62) in 2021 to 1.54% (10/650, 95% CI 0.74 to 2.81) in 2025.
In the five months to 1 June 2026, facilities notified 717 dog bites with six deaths and 221 snakebites with three deaths (Table 1). In January to May of 2025, they notified 672 dog bites and 190 snakebites. Across 2021 to 2025, the January to May counts ranged from 431 to 672 dog bites and from 154 to 249 snakebites (Additional file 1, Table S2). Snakebites clustered in the rainy season, with 2,055 (62.6%) of 3,285 notified from May to October.
Person
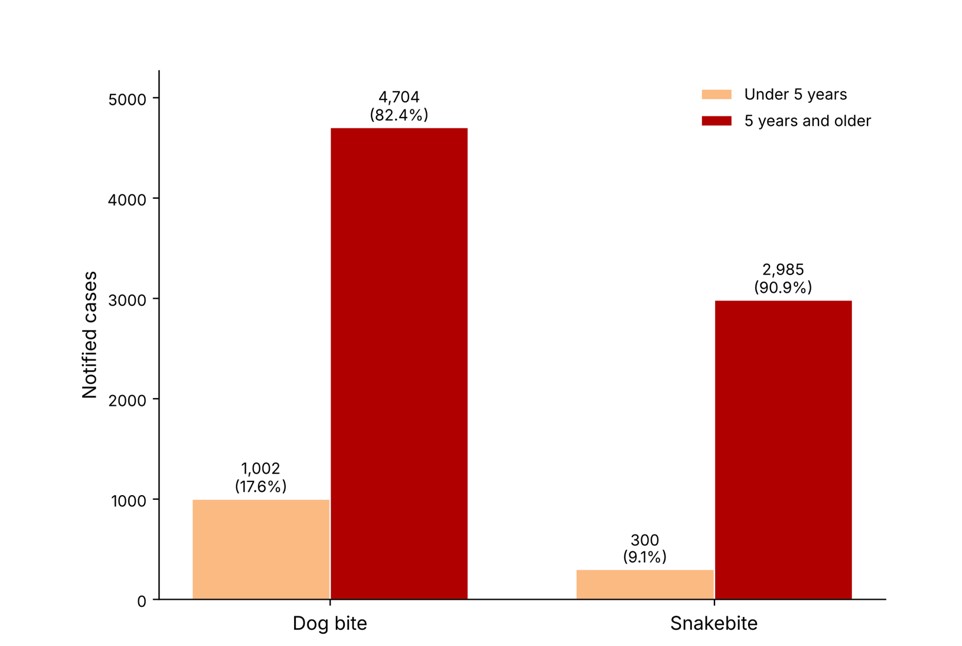
Every notification from 2021 to 2025 carried an age band. Children under 5 years accounted for 1,002 (17.6%) of 5,706 dog bites and 300 (9.1%) of 3,285 snakebites (Figure 1). Additional file 1, Table S3 gives the rates and notified CFRs of the two age bands.
Case-based records gave age in years for 2,730 dog bites and 1,217 snakebites (Additional file 1, Table S4). Children aged 5 to 14 years accounted for 942 (34.5%) dog bites, and they form 28.8% of the population. Children under 5 years accounted for 263 (9.6%) dog bites and 41 (3.4%) snakebites. Adults aged 25 to 44 years accounted for 475 (39.0%) snakebites, and people aged 15 to 24 years for 315 (25.9%).
Place
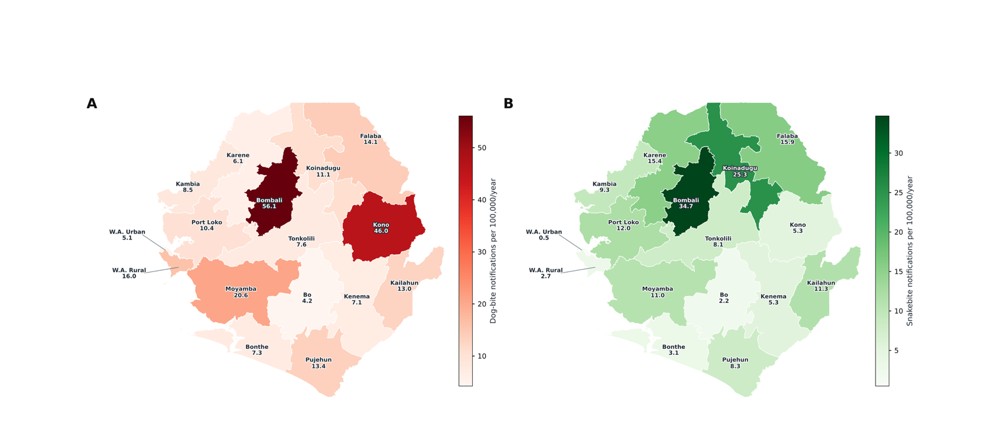
District dog-bite rates ranged from 4.2 per 100,000 per year in Bo to 56.1 in Bombali, a 13-fold range (median 10.7) (Table 2). Bombali (56.1) and Kono (46.0) stood apart from third-ranked Moyamba (20.6). Bombali and Kono hold 13.4% of the population and notified 2,513 (44.0%) of 5,706 dog bites (Figure 2A).
District snakebite rates ranged from 0.5 per 100,000 per year in Western Area Urban to 34.7 in Bombali (median 8.8). The four highest rates were in the north: Bombali (34.7), Koinadugu (25.3), Falaba (15.9) and Karene (15.4). These four districts hold 13.9% of the population and notified 1,289 (39.2%) of 3,285 snakebites (Figure 2B).
Recorded deaths differed by district. Western Area Urban recorded five deaths among 155 dog-bite notifications (3.23%). Case-based surveillance recorded five suspected human rabies cases, two in 2024 and three in 2025. Two Freetown hospitals notified all five, and none had a laboratory result. Port Loko recorded 26 snakebite deaths among 316 notifications (8.23%), and Karene recorded 16 among 224 (7.14%). Together, the two districts recorded 42 (33.9%) of 124 snakebite deaths from 540 (16.4%) of 3,285 notifications. Their combined CFR was 7.78% (95% CI: 5.66 – 10.37), and the CFR of the other 14 districts was 2.99% (82/2,745, 95% CI: 2.38 – 3.69). Seven districts recorded fewer than five snakebite deaths, and their CFR intervals are wide (Table 2).
Population growth of 1.04% and 2.2% a year lowered every five-year rate by 2.1% and 4.3% (Additional file 1, Table S5). Under 2015 census denominators, Kono (56.4) passed Bombali (51.4) for dog bites, and the same four districts kept the highest snakebite rates (Table S6).
We measured how often dog bites and snakebites were notified, and how often notified cases died, by year, district and age group. From 2021 to 2025, dog bites were notified 1.7 times as often as snakebites, and snakebite notifications accounted for five of every six recorded deaths. Dog-bite notification rose by 46%, and the rise came from Kono. Snakebite notifications concentrated in four northern districts and in the rainy season, and notified snakebite fatality was highest in Port Loko and Karene. School-age children carried the largest share of dog bites, and adults the largest share of snakebites.
Dog bites
The national dog-bite rate of 15.1 per 100,000 lies within the range of facility surveillance records in neighbouring countries. Guinea notified about 10 dog bites per 100,000 a year, and the Volta Region of Ghana about 50 [35,36]. In three Liberian cities, community surveys counted 77 to 393 bite victims per 100,000 a year, and about four in ten victims had visited no health facility [37]. Facility notification therefore measures the part of the exposure that reaches care.
The national rise belongs to two districts. Kono’s total quadrupled between 2021 and 2025, Bombali’s doubled, and the other 14 districts together notified fewer dog bites in 2025 than in 2021. The 2025 count also restores the 2019 level of 1,544 dog and cat bites [16]. More dogs, rabies among dogs and more complete reporting would each produce a rise at this local level, so Kono’s dog population, vaccination coverage and reporting practice deserve direct study. Reporting contributes in Bombali, where a national campaign against dog bites began in November 2019 and strengthened reporting channels [38,39].
Case-based ages identify school-age children as the group most often bitten by dogs, as in Guinea [35]. The two streams disagree on children under 5 years, who formed 17.6% of weekly dog-bite counts and 9.6% of case-based records. Facilities should verify the weekly age tally before under-fives are named a risk group. The weekly form records no cause for the 22 deaths after dog bites, and national bulletins attribute some of them to clinical rabies [40]. Freetown hospitals notified all five human rabies cases, and Western Area Urban, the district of the national referral hospital, recorded five dog-bite deaths. The annual dog-bite CFR ranged from three to nine deaths, and its yearly intervals overlap.
Snakebites
The national snakebite rate of 8.7 per 100,000 is low for West Africa. Routine systems recorded 24 per 100,000 in the Volta and Oti Regions of Ghana, 101 in the Savannah Region of Ghana and 130 in Burkina Faso [41-43]. The notified CFR of 3.77% is high. The Savannah series recorded 0.4%, the Volta and Oti series recorded no deaths, and a study in Cameroon recorded 2.5% [41,42,44]. A low notification rate with a high fatality ratio is the pattern expected where mainly severe bites reach a facility. Scarce antivenom produces the same pattern, and death audits in the districts with the highest fatality would show which explanation holds.
The four districts with the highest rates lie in the northern savanna, where households farm and herd cattle, the occupational setting of West African snakebite [9,45]. People aged 15 to 44 years carried 790 (64.9%) of 1,217 case-based snakebites, and six in ten bites came in the rainy season. Both Ghanaian series show the same age and season [41,42].
The snakebite CFR fell from 5.26% in 2021 to 1.54% in 2025, and the two intervals do not overlap. Recorded deaths dropped from 27 in 2024 to 10 in 2025. Better survival and less complete recording of deaths would each lower the ratio, and a review of the 2025 facility registers would distinguish them.
Port Loko and Karene recorded a combined snakebite CFR of 7.78%, more than twice the 2.99% of the other districts, and the two intervals are separate. Koinadugu, with the second-highest notification rate, recorded 0.77% (2/261). Notified fatality depends on the severity of the bites that arrive, the delay before arrival, antivenom supply, referral between districts and the completeness of death recording [1,9]. The surveillance counts identify where fatality is high, and district death audits can establish why.
Implications for policy and practice
Four program actions follow, each beginning with verification in named districts. First, NPHA and the district health management teams of Port Loko and Karene should audit every snakebite death for delay, treatment and antivenom supply. Second, the Ministry of Health should check stocks against notified demand. Rabies vaccine in Kono and Bombali and antivenom in Bombali, Koinadugu, Falaba and Karene come first. Third, each dog-bite death should trigger a joint investigation by the district health management team and the district livestock officer of the Ministry of Agriculture and Food Security, coordinated through the One Health platform [46]. Dog vaccination and humane dog population management, through responsible ownership, veterinary care and reproductive control, address the source [3,47]. Fourth, case-based records covered 2,730 (47.8%) of 5,706 dog bites and 1,217 (37.1%) of 3,285 snakebites, and fewer than 1% carried a final vital status. A complete national investigation form for every notified bite would supply outcome, sex, occupation, time to care, post-exposure prophylaxis and antivenom [48]. Notification could then track the Master Plan targets [22]. Any country that runs IDSR can pair its weekly bite counts with census denominators and produce district rates and fatality ratios without new data collection [27].
Strengths and limitations
The system covers every district, and every district reported both events in every year, so district comparisons do not depend on a sample. One reporting process carried both events, and census denominators with exact intervals make district counts comparable.
The findings have five limits. First, notifications count people who reached a reporting facility. Bites treated at home or by traditional healers are missing, so notified rates set a lower bound on incidence, and district differences combine exposure, care seeking and reporting. A patient referred between facilities can be counted at each. Second, case definitions are clinical: dog-bite deaths lack confirmation as rabies, and snakebite counts include bites without envenoming. Third, facilities record deaths that occur in their care, so deaths at home are missing, and district CFRs rest on small numbers. Fourth, the weekly form has two age bands and no sex, occupation or treatment variable, and age denominators rest on the 2015 census. Case-based records gave age in years for about half of dog bites and a third of snakebites. Fifth, district populations differ by up to 49% between the 2015 and 2021 censuses, so the order of closely ranked districts depends on the census used.
From 2021 to 2025, Sierra Leone’s surveillance system notified 15.1 dog bites and 8.7 snakebites per 100,000 a year, and snakebite notifications accounted for 124 (84.9%) of the 146 recorded deaths. Dog-bite notifications rose by 46%, and Kono accounted for the rise. Notified snakebite fatality was highest in Port Loko and Karene. These figures describe bites that reached a reporting health facility. They give the country the district baseline that its Master Plan calls for, and they show other IDSR countries what their own weekly counts can yield. NPHA and the district health management teams should start with snakebite death audits and antivenom stock checks in Port Loko and Karene. In Kono and Bombali, they should start with rabies vaccine stock checks, joint investigations of dog-bite deaths and a review of the rise in Kono.
What is already known about the topic
What this study adds
Conceptualization: Eric Nzirakaindi Ikoona.
Data curation: Eric Nzirakaindi Ikoona, Dr Lucy Namulemo, Bridget Magoba, Mary Magdalene Sinnah, Mohamed Alex Vandi, and Foday Sahr.
Formal analysis: Eric Nzirakaindi Ikoona, Dr Lucy Namulemo, Bridget Magoba, Mary Magdalene Sinnah, and Foday Sahr.
Funding acquisition: Eric Nzirakaindi Ikoona and Dr Lucy Namulemo.
Investigation: Eric Nzirakaindi Ikoona, Dr Lucy Namulemo, and Mohamed Alex Vandi.
Methodology: Eric Nzirakaindi Ikoona, Dr Lucy Namulemo, and Foday Sahr.
Project administration: Eric Nzirakaindi Ikoona, Dr Lucy Namulemo, and Mary Magdalene Sinnah.
Resources: Eric Nzirakaindi Ikoona and Dr Lucy Namulemo.
Software: Eric Nzirakaindi Ikoona, Dr Lucy Namulemo, Bridget Magoba, and Mohamed Alex Vandi.
Supervision: Eric Nzirakaindi Ikoona, Dr Lucy Namulemo, Bridget Magoba, Mohamed Alex Vandi, and Foday Sahr.
Validation: Eric Nzirakaindi Ikoona, Dr Lucy Namulemo, Bridget Magoba, Mary Magdalene Sinnah, Mohamed Alex Vandi, and Foday Sahr
Visualization: Eric Nzirakaindi Ikoona and Dr Lucy Namulemo
Writing – original draft: Eric Nzirakaindi Ikoona
Writing – review & editing: Eric Nzirakaindi Ikoona, Dr Lucy Namulemo, Bridget Magoba, Mary Magdalene Sinnah, Mohamed Alex Vandi, and Foday Sahr
Supplementary Files
| Period | Dog bites | Snakebites | ||||||
|---|---|---|---|---|---|---|---|---|
| Notified cases | Rate per 100,000 per year (95% CI) | Deaths | CFR, % (95% CI) | Notified cases | Rate per 100,000 per year (95% CI) | Deaths | CFR, % (95% CI) | |
| Complete years | ||||||||
| 2021 | 1,037 | 13.7 (12.9 to 14.6) | 3 | 0.29 (0.06 to 0.84) | 494 | 6.5 (6.0 to 7.1) | 26 | 5.26 (3.47 to 7.62) |
| 2022 | 993 | 13.2 (12.3 to 14.0) | 3 | 0.30 (0.06 to 0.88) | 614 | 8.1 (7.5 to 8.8) | 30 | 4.89 (3.32 to 6.90) |
| 2023 | 1,035 | 13.7 (12.9 to 14.6) | 4 | 0.39 (0.11 to 0.99) | 836 | 11.1 (10.3 to 11.9) | 31 | 3.71 (2.53 to 5.22) |
| 2024 | 1,132 | 15.0 (14.1 to 15.9) | 9 | 0.80 (0.36 to 1.50) | 691 | 9.2 (8.5 to 9.9) | 27 | 3.91 (2.59 to 5.63) |
| 2025 | 1,509 | 20.0 (19.0 to 21.0) | 3 | 0.20 (0.04 to 0.58) | 650 | 8.6 (8.0 to 9.3) | 10 | 1.54 (0.74 to 2.81) |
| 2021 to 2025 | 5,706 | 15.1 (14.7 to 15.5) | 22 | 0.39 (0.24 to 0.58) | 3,285 | 8.7 (8.4 to 9.0) | 124 | 3.77 (3.15 to 4.48) |
| Partial year (five months) | ||||||||
| 1 January to 1 June 2026 | 717 | NC | 6 | 0.84 (0.31 to 1.81) | 221 | NC | 3 | 1.36 (0.28 to 3.92) |
CFR, notified case fatality ratio: deaths recorded among notified cases divided by notified cases. CI, confidence interval, exact Poisson for rates and exact binomial for CFRs. NC, not calculated for a partial year. Rates are notified cases per 100,000 population per year, with the 2021 census population of 7,548,702 as the denominator. Deaths are those recorded by health facilities among notified cases. The weekly form records no cause of death and no laboratory confirmation of rabies.
| District | Population, 2021 census | Dog bites | Snakebites | ||||||
|---|---|---|---|---|---|---|---|---|---|
| Notified cases | Rate per 100,000 per year (95% CI) | Deaths | CFR, % (95% CI) | Notified cases | Rate per 100,000 per year (95% CI) | Deaths | CFR, % (95% CI) | ||
| Bo | 756,975 | 159 | 4.2 (3.6 to 4.9) | 1 | 0.63 (0.02 to 3.45) | 82 | 2.2 (1.7 to 2.7) | 4 | 4.88 (1.34 to 12.02) |
| Bombali | 387,236 | 1,086 | 56.1 (52.8 to 59.5) | 1 | 0.09 (0.00 to 0.51) | 672 | 34.7 (32.1 to 37.4) | 14 | 2.08 (1.14 to 3.47) |
| Bonthe | 297,561 | 108 | 7.3 (6.0 to 8.8) | 1 | 0.93 (0.02 to 5.05) | 46 | 3.1 (2.3 to 4.1) | 1 | 2.17 (0.06 to 11.53) |
| Falaba | 166,205 | 117 | 14.1 (11.6 to 16.9) | 0 | 0.00 (0.00 to 3.10) | 132 | 15.9 (13.3 to 18.8) | 4 | 3.03 (0.83 to 7.58) |
| Kailahun | 550,435 | 357 | 13.0 (11.7 to 14.4) | 1 | 0.28 (0.01 to 1.55) | 312 | 11.3 (10.1 to 12.7) | 9 | 2.88 (1.33 to 5.41) |
| Kambia | 367,699 | 157 | 8.5 (7.3 to 10.0) | 0 | 0.00 (0.00 to 2.32) | 171 | 9.3 (8.0 to 10.8) | 10 | 5.85 (2.84 to 10.49) |
| Karene | 290,313 | 89 | 6.1 (4.9 to 7.5) | 2 | 2.25 (0.27 to 7.88) | 224 | 15.4 (13.5 to 17.6) | 16 | 7.14 (4.14 to 11.34) |
| Kenema | 772,472 | 275 | 7.1 (6.3 to 8.0) | 2 | 0.73 (0.09 to 2.60) | 204 | 5.3 (4.6 to 6.1) | 11 | 5.39 (2.72 to 9.44) |
| Koinadugu | 206,133 | 114 | 11.1 (9.1 to 13.3) | 0 | 0.00 (0.00 to 3.18) | 261 | 25.3 (22.3 to 28.6) | 2 | 0.77 (0.09 to 2.74) |
| Kono | 620,703 | 1,427 | 46.0 (43.6 to 48.4) | 1 | 0.07 (0.00 to 0.39) | 163 | 5.3 (4.5 to 6.1) | 1 | 0.61 (0.02 to 3.37) |
| Moyamba | 346,771 | 358 | 20.6 (18.6 to 22.9) | 2 | 0.56 (0.07 to 2.00) | 191 | 11.0 (9.5 to 12.7) | 6 | 3.14 (1.16 to 6.71) |
| Port Loko | 528,038 | 275 | 10.4 (9.2 to 11.7) | 2 | 0.73 (0.09 to 2.60) | 316 | 12.0 (10.7 to 13.4) | 26 | 8.23 (5.45 to 11.82) |
| Pujehun | 429,574 | 287 | 13.4 (11.9 to 15.0) | 1 | 0.35 (0.01 to 1.93) | 179 | 8.3 (7.2 to 9.6) | 7 | 3.91 (1.59 to 7.89) |
| Tonkolili | 557,257 | 212 | 7.6 (6.6 to 8.7) | 1 | 0.47 (0.01 to 2.60) | 227 | 8.1 (7.1 to 9.3) | 11 | 4.85 (2.44 to 8.50) |
| Western Area Rural | 662,156 | 530 | 16.0 (14.7 to 17.4) | 2 | 0.38 (0.05 to 1.36) | 91 | 2.7 (2.2 to 3.4) | 2 | 2.20 (0.27 to 7.71) |
| Western Area Urban | 609,174 | 155 | 5.1 (4.3 to 6.0) | 5 | 3.23 (1.06 to 7.37) | 14 | 0.5 (0.3 to 0.8) | 0 | 0.00 (0.00 to 23.16) |
| Sierra Leone | 7,548,702 | 5,706 | 15.1 (14.7 to 15.5) | 22 | 0.39 (0.24 to 0.58) | 3,285 | 8.7 (8.4 to 9.0) | 124 | 3.77 (3.15 to 4.48) |
CFR, notified case fatality ratio: deaths recorded among notified cases divided by notified cases. CI, confidence interval, exact Poisson for rates and exact binomial for CFRs. Rates are mean annual notified cases per 100,000 population per year, with the 2021 census population as the denominator.